Metabolic nanoscopy enhanced by experimental and computational approaches
Introduction
Since the development of the first microscope, visualization of biological microorganisms has been available. The first microscope used an optical magnification method to see small objects. Over time, the technique could be varied in multiple ways with various characteristics of light, such as wavelength and phase change. Today, not only the characteristics of visible light, but also infrared light, electrons, X-rays, acoustic signals, and mechanical force are used to observe micro- or nanoscopic events.
Optical microscopes can visualize the shapes of objects with the most direct method. Since the techniques use light, technically, the process of watching the objects with our eyes has the highest similarity with the process of watching them in every microscope technique. Because of their non-destructive nature, live samples can be imaged without the need for any form of treatment, even without freezing which is required for cryogenic electron microscopy. Therefore, even though the spatial resolution of optical microscopy is lower than other technologies, such as X-ray or electron microscopy, optical microscopy has been used as a main tool for biological research. The recent developments in microscopy techniques enabled nanoscopic molecular distribution in biosamples. As shown in Fig. 1, the improved temporal resolution and spatial resolution allow us to observe molecular compositions and their heterogeneity in sub-cellular organelles.
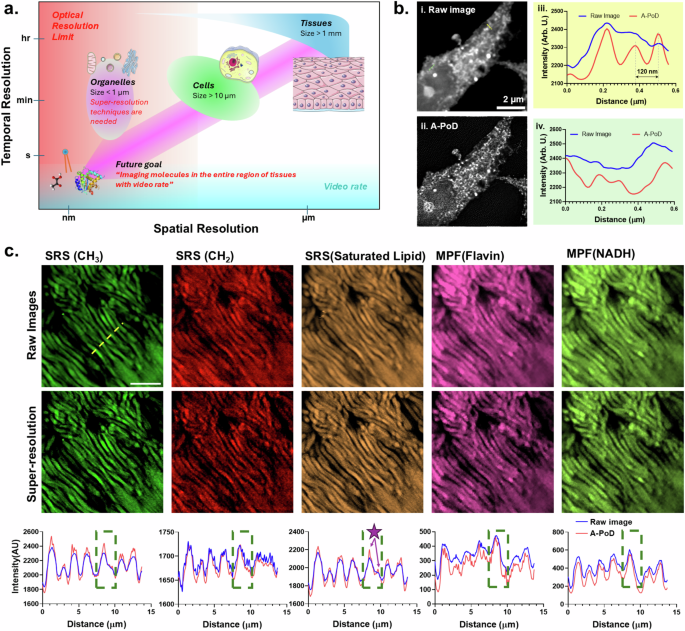
a The improved spatial allows us to visualize molecular heterogeneity in the sub-cellular organelle, and high temporal resolutions allow us to study the time-resolved mechanisms of biomolecules. b Comparison between diffraction-limited SRS image (i) and super-resolution SRS image (ii) of a single HeLa cell. Using the super-resolution deconvolution method, A-PoD, the diffraction-limited images can be converted into super-resolution images. After conversion, the clear structure can be revealed. From the two intensity profiles, (iii) and (iv), the difference can be confirmed. The profiles were taken from the two dashed lines in images, (i) and (ii). c Application of digital super-resolution imaging method to SRS and MPF images of human retinal tissue. Images from five different channels of SRS (–CH3, –CH2, and saturated lipid) and MPF (Flavin and NADH) were taken. As shown in the super-resolution images (top: raw images, bottom: A-PoD, super-resolution) and intensity profiles (blue: raw image, red: A-PoD, super-resolution), the enhanced contrast and resolution allow us to visualize sub-cellular components of each single rod cell (dark green dotted box), such as the outer membrane of rod cell (purple arrows with a star in saturated lipid channel). Scale bar: 10 µm (panel a was created with Servier Medical Art).
Optical microscopy techniques have been developed in various ways. Molecular-specific microscopy techniques, including fluorescence, infrared, and Raman microscopy, have been developed, leading to an increase in molecular specificity and the number of detectable channels from the same sample. To overcome the relatively lower resolution of optical microscopy compared with other high-resolution imaging techniques, super-resolution microscopy techniques have been developed since the end of the 20th century1. In addition, recent advanced computational methods further improve the capabilities of super-resolution imaging techniques. In this review, recent developments in microscopic techniques and computational approaches to visualize various molecular distributions in nanoscopic regions are summarized.
Super-resolution microscopy
In 1873, Ernst Abbe defined the diffraction limit2, and this has been an unbreakable rule in optical microscopy. Due to the wave property of photons, the resolution of every optical technique is limited by the rule of diffraction2. Therefore, the resolution limit, the so-called diffraction limit (d), is defined by the wavelength of light (λ) and numerical aperture (NA) of the objective lens as follows3,4
where, NA characterizes the range of angles of which an optical system can accept light. Assuming the shape of the light from an object to the lens as a cone, the half-angle (θ) of the cone can be defined. NA can also be defined by nsinθ, where n is the refractive index of the medium. Beyond this diffraction limit, the measured images of objects become blurry. When an image of an ideal single-point emitter is taken, the measurement result of the single-point emitter is called the point spread function (PSF). PSF can be utilized to describe the characteristics of the measurement setup. The relationship between the ideal image (X) and measured image (Y) can be described as follows:
However, in the fluorescence microscopy field, the first approach to overcome the diffraction limit was theoretically designed in 1971 and experimentally demonstrated in 19945,6. Since the first development of super-resolution microscopy, a lot of new techniques have been developed. Stimulated emission depletion (STED) is one of the most famous super-resolution fluorescence microscopies7. It utilizes two beams of fluorescence excitation and depletion by stimulated emission. The first Gaussian beam excites fluorophores, and the next beam having a donut shape with a longer wavelength induces stimulated emission of the fluorophores. Due to the stimulated emission, the fluorescence signal in the donut-shaped beam is removed. Therefore, as shown in Fig. 2a, the effective PSF can be reduced.
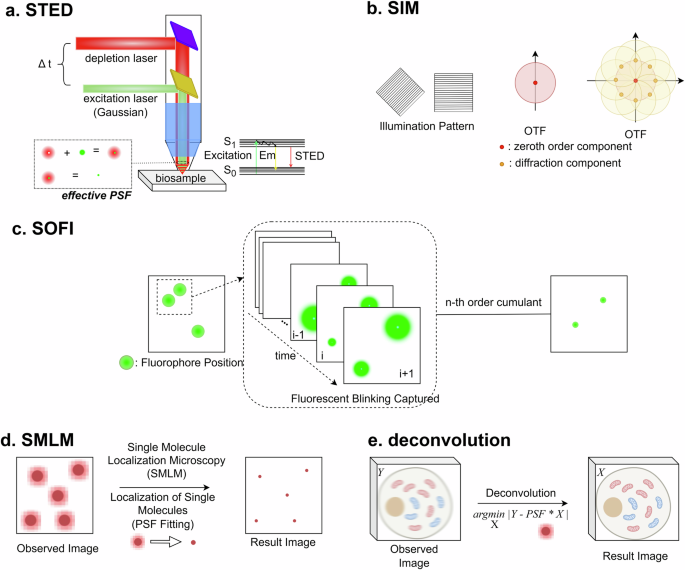
a STED. Due to the donut-shaped depletion beam, through stimulated emission, the fluorescence signal of dye molecules outside of the Gaussian-shaped excitation beam is turned off. As a result of the process, effective PSF size decreases. By controlling the time delay of the depletion beam (Δt), the resolution of STED can be optimized59. b SIM. Different frequencies or directions of illumination pattern changes the coverage in OTF. Through the repeated imaging process, the area that is covered by the measurement in OTF increases. Therefore, more components in a wide region of spatial frequency can be expressed in the spatial domain of the reconstructed images. c SOFI. Through the analysis based on the n-th order cumulants of each fluorophore, the fluorescence signal from different pixels can be separated. d SMLM. A single molecule localization process based on PSF fitting can specify the location of each emitter. e Deconvolution. Computationally, the ideal image can be retrieved through the inverse calculation of the convolution equation.
Structured illumination microscopy (SIM) is another method to reduce PSF size8. By utilizing structured illumination, such as a sinusoidal excitation pattern, multiple frames of images can be collected at different positions and orientations of the structured illumination pattern. Through repeated measurements, the missing information in the optical transfer function (OTF), PSF in the Fourier domain, can be filled up. As a result, the size of PSF can be reduced multiple times, and the spatial resolution is improved, as shown in Fig. 2b.
Another approach is based on the intensity fluctuation of fluorophores. Every fluorophore fluctuates between bright and dark states, but the fluctuation of each fluorophore is independent of each other. When a time series of multiple fluorophores is taken with a wide-field fluorescence microscope, in the time series, every emitter has its own blinking pattern, which is independent of each other. The independent blinking pattern can be expressed as a correlation function or its own probability distribution. Therefore, by calculating the n-th order auto-cumulants of the probability distribution in the measured time series, the signals of different emitters can be disentangled. By this approach described in Fig. 2c, the spatial resolution of a fluorescence microscope can be improved. This method to enhance spatial resolution is called super-resolution optical fluctuation imaging (SOFI)9.
As a different method to analyze the time series of blinking fluorescent emitters, the direct localization concept of each single emitter can be utilized. If the fluorophores are distributed with enough distances, the positions of each emitter can be calculated precisely based on direct fitting with PSF (Fig. 2d). After this localization of each emitter in every frame, the resulting images are accumulated in a single image. Then, the super-resolution image of the sample can be restored from the measured time series. This method is called single-molecule localization microscopy (SMLM). Because of the distance limit to localize neighbored single emitters, the sparsity of the emitters in a single frame should be preserved. To keep the sparsity, multiple approaches, such as fluorescent blinking10, labeling photoactivatable dyes11, or reversibly labeling dyes12, can be utilized.
To overcome the limitations of previous methods, new approaches have been utilized. Naturally, the first issue that should be solved is spatial resolution. Even if the diffraction limit is exceeded by using the aforementioned super-resolution technique, higher spatial resolution is always needed to see more details of molecules. Accordingly, the previous method was refined, or other methods have been developed to achieve 1–3 nm spatial resolution13 or axial sub-nanometer resolution14.
The second issue is the development of super-resolution microscopy for various imaging modalities. Previous methods mainly focused on fluorescence microscopy, for example, STED, SMLM, and SOFI utilize the characteristics of fluorophores, such as depletion of emission by stimulated emission, intensity fluctuation through the blinking process, or single molecule detection capability. In the cases of other non-fluorescent imaging modalities like Raman or IR imaging, previous methods cannot be utilized. Since SIM does not require any characteristics of fluorophores, the SIM-based Raman imaging method has been developed by Watanabe et al. 15. Expansion microscopy, the measurement technique after expanding samples through the gelation process, has been introduced by Chen et al. 16. The method has been applied to achieve super-resolution stimulated Raman scattering (SRS) microscopy17.
The third issue is about temporal resolution. Super-resolution techniques like SOFI, SIM, and SMLM need to take time series for super-resolution image reconstruction. This process of taking time series can limit the temporal resolution of the technique. Therefore, new approaches are used to reduce the number of frames in the time series. In the case of SMLM, the density of blinking emitters is related to the number of frames. If the maximum localizable density of emitters is increased, the number of total frames to reconstruct a single super-resolution image can be reduced. Therefore, new algorithms18,19,20 to reconstruct SMLM images were developed, and methods were also developed to reconstruct super-resolution images from a single frame of wide-field fluorescence image (SUPPOSe)21, SRS image, and multiphoton fluorescence image (A-PoD) 22.
Computational methods in super-resolution microscopy
Recent advances in the aforementioned super-resolution imaging techniques are also closely related to increasing computational power and developments of new algorithms. Even though the main ideas of the techniques are based on instrumentational approaches, for analysis and image reconstruction, computational techniques are needed. For example, for reconstruction of super-resolution images from SIM and SMLM stacks, computational analysis is necessary. For example, to retrieve a super-resolution image from the SIM image stack, a process to restore a super-resolution image based on the illumination pattern is needed. As an advanced technique of SIM, blind-SIM approach that does not need any additional parameters about the illumination pattern has been developed23, but the image reconstruction algorithm is also needed to retrieve a super-resolution image through the method.
In SMLM, to increase the maximum density of localizable emitters in a single frame, computational approaches were used. By overlapping multiple PSFs in a single localization process, the localization precision of multiple emitters could be increased24. Deconvolution-based approaches were also developed that increase both the localizatoin precision and temporal resolution18,19,20.
Deconvolution is a restoring process of cleaning signals from corrupted signals25. This computational method can be expressed as follows
where, Y stands for the corrupted signal, and X means the clean signal. A describes the theoretical pattern of signal corruption, and it is called a blurring kernel. By optimizing X to minimize the loss function, the ideal signal of X can be retrieved. When the blurring kernel as PSF and the corrupted signal as the measured image are set, the aforementioned process will be the computational approach to remove the blurring effect following PSF. This computational process means that super-resolution images can be retrieved from the blurry images, as described in Fig. 2e and the examples in Fig. 1.
The image deconvolution method has been utilized for various purposes from general digital image processing to astronomical and biological research. Especially for microscopy image analysis, this deconvolution method was applied to make a 3D widefield image of chromosome clear26. Recently, the method was also utilized to improve the spatial resolution of super-resolution microscopy. Based on the PSF of SIM, a higher resolution image of super-resolution microscopy could be restored27. This approach showed another capability of the computational method to boost the spatial resolution of super-resolution microscopy.
If a unique solution of the deconvolution equation exists, this method can be the best way to improve the spatial resolution of every type of image. However, this is an ill-posed inverse problem. In addition, considering the noise in the images, the deconvolution equation should be corrected as follows.
where, P stands for Poissonian random variable describing shot noise of sensors, and G means additive noise having Gaussian distribution.
To solve the more complicated ill-posed inverse problem, some obviously wrong solutions should be removed. For this purpose, several mathematical techniques have been utilized, and one of the famous methods is the iterative method based on maximum likelihood estimation, the Richardson–Lucy deconvolution28,29. After 50 years later of its development, it is still used mainly in the image deconvolution field.
Another approach to idealizing the solution is the utilization of penalized regression. In minimization processes, by adding one more term of the main variable as a penalty term, overfitting can be avoided.
By controlling the weighting factor, (lambda), strength to constrain the variable can be adjusted. If the power of the penalty parameter is adjusted, the sparsity of the variable X can also be adjusted.
From this equation, if n is equal to or smaller than 1, the components of zeros in X can be increased. By using this approach, the false intensity values in images can be minimized, and this method is called sparse deconvolution. For example, in SMLM data, except for the localized molecular signals, intensity values in other areas should be zero. However, some typical artifacts of deconvolution, such as ringing artifacts, can be generated in the empty spaces of images. Due to these types of artifacts, even though the theoretical meaning of deconvolution is computationally retrieving super-resolution images, it is generally not considered a part of super-resolution techniques.
By utilization of the sparse deconvolution, retrieving the most probable emitters’ distribution was available. The approaches of CSSTORM18, FALCON19, and SPIDER20 are based on the sparse deconvolution. Depending on the power of penalty parameters, the sparsity of the results can be varied. For example, CSSTORM and FALCON are based on L1 norm penalized regression (n = 1), and SPIDER is based on L0 norm penalized regression (n = 0). A lower n value provides stronger data sparsity. Due to the strong sparsity, the programs could retrieve super-resolution images from the high emitter density conditions. Even if the deconvolution process is different from the direct localization of single molecules, these three methods proved that the sparse deconvolution concept is meaningful enough to generate super-resolution images.
The limitation of the above-mentioned deconvolution programs is the maximum emitter density of the images. The programs could not restore any super-resolution images from one single frame of widefield fluorescence microscope images. The reason is related to the difficulty of controlling sparsity. To overcome the limit, another approach was developed. For enough sparsity to reconstruct a super-resolution image from a widefield fluorescence image having extremely high emitter density, super-positioning of the virtual emitter concept was applied21,22.
In fluorescent samples, the fluorophores are discontinuously dispersed, and their intensity is almost homogeneous because the fluorescence process is based on the same transitions between two quantum states. If it is assumed that a single virtual emitter in a deconvolution process represents a bundle of fluorophores, by optimizing the positions of the virtual emitters, super-resolution images can be reconstructed. During the process, the number of total virtual emitters and unit intensity of them should be limited. The sum of the total emitters’ intensity should be equal to the sum of raw image intensity. Then, after optimization of the virtual emitters’ positions, the empty space of the image cannot have any other intensity values. Through this process, the concept of this superposition of virtual emitters can provide enough sparsity to reconstruct super-resolution images from a single frame of wide-field fluorescence microscope images.
The programs based on this concept have been developed in two ways. One method is called the superposition of virtual point sources (SUPPOSe)21. This program reconstructs super-resolution fluorescence microscope images. To optimize the positions of virtual emitters, SUPPOSe utilizes a genetic algorithm. The other program is Adam-based pointillism deconvolution (A-PoD)22. It utilizes Adam solver to optimize emitters’ positions. This program was applied to analyze SRS images with multiphoton fluorescence images. Due to the lack of single molecule detection capabilities of the technique, SMLM cannot be utilized. Therefore, A-PoD could be a good solution to achieve super-resolution Raman imaging.
AI-based super-resolution imaging
Recently, advances in computational approaches also provided solutions for super-resolution imaging techniques. Neural network (NN) programs are used in various fields. In super-resolution microscopy techniques, machine learning-based super-resolution imaging methods have been developed30 and provided nice results. This machine learning concept was demonstrated in 195931.
Perceptron (Fig. 3a, b) is the main component of machine learning programs32,33. This concept mimics the structure of neuronal cells. In neuronal cells, signals from other neurons come into the cells through dendrites, and depending on the signal level, the generated output signal is controlled. There is a threshold of input signal to generate a minimum output signal, and the output signal is delivered through axons. In artificial neural networks (ANN), perceptrons process the input signal based on their activation functions, and the output signal is generated depending on the results. The activation functions in the perceptrons can be various types of functions. In the first age of perceptron, the step function was utilized to digitalize the signal. Now, the most general activation function is rectified linear unit (ReLu)34, and depending on the purpose of the network, sigmoid, linear, or leaky ReLu35 can be used.

a Biological neuron. The signal from other cells is delivered through the dendrite. Depending on the input signal and threshold of the neuron, the output signal is generated and delivered to another neuron through synapses between axons and dendrites of the next cell. b Perceptron. The basic element of a neural network program, perceptron, accepts the input signal from other perceptrons or input layers. Based on the activation function and the input signal, the output signal is calculated. c. Layers. By stacking multiple perceptrons parallelly, a single layer is constructed. The perceptrons can be connected from the input layer to the output layer to generate results. d Representative networks, CNN: for image processing and image segmentation, the network doing the convolutional process can be designed. RNN: to repeat some calculations like loop structures, by connecting the output of perceptrons to the former layer, recurrent neural networks can be constructed.
By parallel stacking of the perceptrons as shown in Fig. 3c, one single layer of NN is constructed. Each perceptron can have various types of connections, and the structure of the connection between perceptrons defines the characteristics of the network. For example, as described in Fig. 3d, in a convolutional neural network (CNN), the perceptrons are connected following the shape of the kernel, and the output signals are delivered to the next perceptron after the multiplication of the weighting factor from the kernel. Due to the structure, CNN plays a similar role to the mathematical convolution process. A recurrent neural network (RNN) is another example of the simplest structure. To design an NN structure repeating tasks like loop structures in other types of codes, RNN is designed. By connecting the output of a layer to the former layer, a loop structure in the neural net program can be implemented. U-Net is also a famous example that can process images of multiple frequency components like the coarse-to-fine algorithm36,37,38. Like these examples, NN structures are designed considering the known computational algorithms.
Every perceptron has its own parameters to control the output signal. The parameters can be controlled through multiple processing to compare the calculation results with known solutions. This step is called the training process. If the NN is trained through this process with the known solution, the training data, this method is called supervised learning. Due to this supervised learning method, NNs can have proper parameters to generate the right response every time. This method is powerful enough to generate practical results in various fields including super-resolution image processing. For example, the parameters to take super-resolution images can be automatized, and for fluorescence correlation microscopy analysis, machine learning approaches help us to read out the physical parameters and denoise39,40. However, it also has some limitations related to the methodology of the approach, such as the limited explainability of a model.
This approach is based on inductive reasoning. Even if the network structure does not have any scientific information, by repeating enough training process, the network can generate nice results. In some cases, this method is considered as a black box that generates results through unknown processes. To solve this problem, explainable NNs have been studied41,42. By implementing theoretical models in network structures and loss functions, the calculation process of the NN can be explained. In addition, networks memorizing and utilizing theoretical models can be designed. Through these processes, scientific NNs can be designed.
Multiplexing and multimodalities
Fluorescent probes have the advantage of high specificity, but due to the spectral broadness, the maximum number of dyes that can be imaged at the same time is limited. Therefore, it is challenging to take multiple molecules from the same sample. However, to maintain their functions, biological samples have extremely heterogeneous conditions. To understand their nature, multiplex imaging techniques are needed, and multiple approaches have been made to achieve this goal (Table 1).
In biological sciences, multiplex imaging is the method based on cyclic immunochemistry to study the biological context of various biomarkers and biomolecules. The representative methods based on fluorophores are co-detection by indexing (CODEX)43,44 and fluorescence in situ hybridization (FISH)45,46. CODEX utilizes DNA conjugated antibodies. The antibodies are labeled on multiple target proteins, and due to the various types of conjugated DNA, different labeling on various proteins is available. FISH is based on a genetic analysis method. By using fluorescent probes conjugated to complementary DNA or RNA sequences, specific target genetic sequences can be labeled. Based on this technique, genetic information can be read out from cellular or tissue environments. Using these approaches, single-cell level genetic information or protein composition can be analyzed, and the information has been utilized to visualize phenotypic expressions of cells in tissues.
In general, the word, multiplex, also has the meaning of a signal involving simultaneous transmission. Beyond the existing biological definition, the technique can be understood in different ways. Only considering the pure goal of the technique to evaluate multiple biological components, imaging techniques to show multiple channels of various molecular signals can be considered as a multiplex imaging method. One approach to show multiple bio-components is the vibrational microscopy technique. Without fluorescent labeling, by detecting the vibration signals of various molecules, the compositions of the samples can be quantified. Representative vibrational microscopy techniques are Raman scattering and infrared (IR) microscopies. Since Raman scattering microscopy utilizes visible light, Raman microscopy has wide compatibility. To measure Raman scattering, the wavelength shift of the scattered light should be measured. However, scattering cross-section of Raman scattering is too small. Therefore, the signal-to-noise ratio of the method is too low to be utilized as a hyperspectral imaging technique. To solve this problem, non-linear optics-based Raman microscopy techniques were developed, such as coherent anti-stokes Raman spectroscopy (CARS) and SRS47. Especially, SRS improves the signal intensity more than 108 times, and it can preserve the same spectral shape as the spontaneous Raman scattering signal. Due to this advance, using SRS, hyperspectral images of biological samples are becoming measurable48.
In addition, new analysis and measurement techniques made SRS more powerful. The spectral information of biological samples contains every functional group of the molecular components. To quantify the averaged protein, lipid, and nucleic acids distribution, intensity overlap between different channels can be linearly unmixed49,50. For more precise analysis of components, various techniques can be used, such as multivariate curve resolution-alternating least squares (MCR-ALS)51,52, principal component analysis (PCA)52, or spectral similarity analysis53. Especially, using penalized reference matching SRS microscopy, multiple lipid subtype distributions could be revealed in various biological samples53. To improve the spatial resolution of multichannel images, the aforementioned image deconvolution method, A-PoD22, was developed.
Another approach for multiplex imaging is based on the multimodal imaging. As mentioned above, multiplex imaging shows multiple biocomponents from a single sample. Differently, multimodal imaging is the incorporation of multiple imaging techniques, such as SRS, fluorescence, second harmonic generation (SHG), and mass spectroscopy. However, if only the main aim of the techniques is considered, the techniques can be connected to each other. Unmixing signals from multiple components can be possible using multimodal imaging techniques.
Recently, by utilizing the characteristic of Raman microscopy based on visible light, a non-linear multimodal microscopy technique of multiphoton fluorescence, SHG, and SRS was developed54. The signals from different imaging modalities have various molecular spectroscopic origins. For example, fluorescence is related to electronic excitation and relaxation processes, so it can be detected with high selectivity when the fluorophores are excited electronically by strong visible light. Raman scattering signal is related to the vibrational energy states and functional groups of molecules. SHG is a tool to detect molecules having some symmetries, such as collagen fibers. Therefore, the various optical imaging modalities can show the heterogeneous molecular composition in bio-samples without any repeated and complex labeling processes.
Achieving super-resolution across multiple imaging modalities remains challenging, as the techniques for super-resolution vary between modalities. While various approaches have been explored, no universal method has been developed, making it difficult to apply super-resolution consistently across different imaging modalities. As introduced in the previous paper22, super-resolution images of different imaging modalities from the same ROI can be measured using the A-PoD-based multimodal imaging concept. Although A-PoD assumes a sparse emitter distribution, its pointillism approach enables the retrieval of super-resolution images from single frames with high emitter densities. This capability is essential for combining multiple imaging modalities in super-resolution. For artifact reduction, standard images can help identify instrumental image artifacts, while sparsity-related artifacts can be minimized using the information in the A-PoD protocol55. To expand the detectable information beyond chemical to metabolic reaction activity, the deuterium labeling concept using heavy water or glucose was also developed50,56.
Summary
The ultimate goal of developing advanced microscopy techniques is to reveal all forms of molecular distribution and their associated chemical events, offering a holistic understanding of aging and diseases.57,58, and the origin of life. To achieve this goal, numerous techniques have been developed, and still, more techniques are being studied. The advances of optical techniques in the 19th century, chemical methods in the 20th century, and computational techniques in the 21st century are being combined. Based on these techniques, the final goal will be achieved to show the ultimate information of medical and biological studies (Fig. 4).
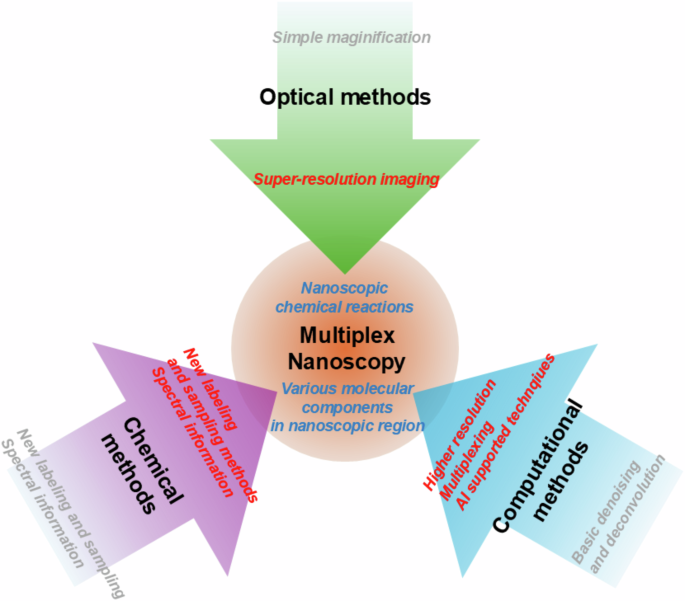
Optical methods provided basic microscopy and super-resolution imaging techniques. Chemical methods gave us stable and various labeling techniques. Chemical studies also provided us with basic knowledge to understand molecular spectroscopic characteristics of dyes and biomolecules. Computational methods can boost the two techniques to achieve the main goal of multiplex nanoscopy.
Responses