Metasurface enabled high-order differentiator
Introduction
Image processing1 is of primary interest in the rapidly evolving information technologies, such as machine learning, autonomous driving, machine vision, microscopy imaging, etc. Image differentiation or edge detection2 can visualize changes or discontinuities of the image’s complex amplitude, a key image feature, and has attracted significant attention in recent years. However, with the explosion of data and the growing demand for real-time processing, digital approaches have encountered the dilemma of processing speed and power consumption3. Thus, due to the inherent nature of massively parallel processing and low power consumption, optical analog processing has gradually become a promising candidate4,5,6,7. Optical edge detection can be traced back to the seminal discovery, namely, phase contrast imaging, by Zernike8. Since then, differential interference contrast microscopy9 and spiral phase contrast imaging10,11 based on Fourier optics were developed to enhance and detect the image’s edge. Whereas, traditional bulky optical elements typically adopted in these setups suffer from the integration obstacle.
Recent years have also witnessed a growing interest in replacing bulky optical elements with ultrathin nanophotonic replicas for advanced optical imaging12,13,14,15 and optical analog image processing4,16,17,18,19,20,21,22,23,24,25,26,27,28,29,30,31,32,33,34,35,36,37,38,39,40,41,42. Theoretically, in order to quantify changes in a function, one merely needs to calculate its derivative. In other words, by performing the spatial optical analog differentiation, we can acquire the edge information of images. By leveraging different nanophotonic systems, such as metasurfaces17,18,23,26,27,28,32,33,34,35,36,37,38,39,40,41, photonic crystal22,25, plasmonic-based interface20, and topological photonics29, researchers proposed a diversity of brilliant proposals for realizing the optical analog differentiation. However, we note that most of these previous schemes have merely focused on first- and second-order differentiation. Several profound attempts have also been made to perform high-order optical analog differentiation31,36 using an all-dielectric multilayer structure with a limited working bandwidth and a well-designed metasurface with a broad working bandwidth. Particularly, by leveraging the PB metasurface, the fourth-order differentiation operation of the angular spectrum has been realized36. However, how to realize scalable high-order differentiation of images and multiple-order parallel operation with a single device has not been fully explored. Meanwhile, what features might high-order differentiation lead to? These serve as the primary motivations for our present work.
Here, by revisiting the basic principle of the Fourier transform, we propose a scalable scheme to realize arbitrary high-order optical analog differentiations. Specifically, by elaborately designing the phase gradient of the Pancharatnam-Berry (PB) metasurface and placing it in the Fourier plane of the 4f imaging system, we equivalently construct a complex amplitude filter, ({(ik)}^{n}), and thus realize the n-order differentiation operation in the experiment. Furthermore, we illustrate that this optical differentiator can be used for optical super-resolution measurement, providing a scheme for optical alignment in multiple exposure semiconductor technologies. PB metasurfaces can also offer a potential for broadband operation, and the 4f imaging system in our demonstration can also be replaced or integrated with other meta-devices.
Results
Principle of high-order optical differentiation with PB metasurface
Generally, based on the angular spectrum theory, the output light field of an optical 4f imaging system can be expressed as43,
where (t({k}_{x},{k}_{y})) represents the optical transfer function of meta-devices at the Fourier plane, (A({k}_{x},{k}_{y})) represents the angular spectrum of the input optical image, ({E}_{in}(x,y)). Actually, by conducting the Fourier transform with a lens, one can directly acquire the angular spectrum, (A({k}_{x},{k}_{y})=iint {E}_{in}(x,y)exp (-i{k}_{x}x-i{k}_{y}y)dxdy), that is, (A({k}_{x},{k}_{y})={ {{mathcal{F}}} }({E}_{in}(x,y))). Drawing on the differentiation property of the Fourier transform,
accordingly, in order to perform arbitrary order differentiation operation, (frac{{partial }^{n+m}}{partial {x}^{n}partial {y}^{m}}), on an input image ({E}_{in}(x,y)), one merely needs to modulate the optical transfer function as, (t({k}_{x},{k}_{y})={(i{k}_{x})}^{n}{(i{k}_{y})}^{m}), which has also been presented in some previous works31,36. In this regard, how to construct such an optical transfer function for image differentiation in a practical experimental system is critical and urgent. Whereas, achieving the desired optical transfer function, namely conducting arbitrary intensity modulation directly with metasurfaces, remains a challenge. Due to its phase robustness and lower demands on fabrication precision, PB metasurfaces with polarization-assisted phase modulation present a promising solution. Here, leveraging the PB phase, we propose a scalable approach for constructing transfer functions to achieve high-order differentiation operations.
Without loss of generality, here, we take the partial derivative in the x-direction as an example. Theoretically, when the right-handed and left-handed circular polarization (RCP and LCP) light illuminate a PB metasurface, the polarization states of transmitted or reflected light switch to LCP and RCP, meanwhile acquiring additional phase (exp (-iphi ({k}_{x}))) and (exp (iphi ({k}_{x}))), respectively. This is because the unit cells of PB metasurfaces can be seen as half-wave plates (HWP) with an orientation angle, (phi ({k}_{x})/2). In this regard, if the PB metasurface is placed at the Fourier plane of a 4f imaging system, and the input image has a horizontal polarization state, we select the vertical polarization component after it passes through the metasurface. Accordingly, the light field behind the metasurface can be expressed as,
If we design the metasurface to enable (sin (phi ({k}_{x}))propto {(i{k}_{x})}^{n}), we can thereby construct the desired optical transfer function to achieve high-order differentiation operations. Drawing on the basic principle of Taylor’s expansion, if (phi ({k}_{x})) is a small value close to zero, (sin (phi ({k}_{x}))approx phi ({k}_{x})). Accordingly, we artificially tailor the gradient phase of the PB metasurface as, ({phi }_{n}({k}_{x})={c}_{n}{({k}_{x})}^{n}), with ({k}_{x}) also representing the coordinate in the plane of the metasurface and ({c}_{n}) being a constant to ensure that ({phi }_{n}({k}_{x})) is sufficiently small. Accordingly, Eq. (3) can be expressed as,
which is formally consistent with Eq. (2).
For demonstration, here, we set ({c}_{1}=1.04times {10}^{3}{{{{rm{m}}}}}^{-1}), ({c}_{3}=4.66times {10}^{9}{{{{rm{m}}}}}^{-1}), and ({c}_{5}=2.03times {10}^{16}{{{{rm{m}}}}}^{-1}), for realizing first-, third-, and fifth-order differentiation operation, the corresponding phase gradients are illustrated in Fig. 1. As shown in Fig. 1a, for the particular case with (n=1), which is the commonly used linear gradient phase for edge detection or first-order differentiation operation23. As shown in Fig. 1b and c, we can easily prepare the required optical transfer function for realizing high-order differentiation. Note that, based on the principle of Taylor’s expansion, ({E}_{{ {{mathcal{F}}} }}) can be approximated as ({({k}_{x})}^{n}A({k}_{x})) only at a limited working area, as indicated by the region between black dashed lines. In order to enlarge the working areas, we can reduce the value of ({c}_{n}). Additionally, in order to realize the required optical transfer functions, as indicated by the region between black dashed lines in Fig. 1, we just need to vary the gradient phase slowly by (2pi), corresponding to a 180-degree rotation in the orientation angle of unit cells, roughly over a span of 1.5 mm, which is compatible with the current manufacturing precision. Namely, by leveraging the PB metasurface, we can readily achieve analog high-order differentiation operation.
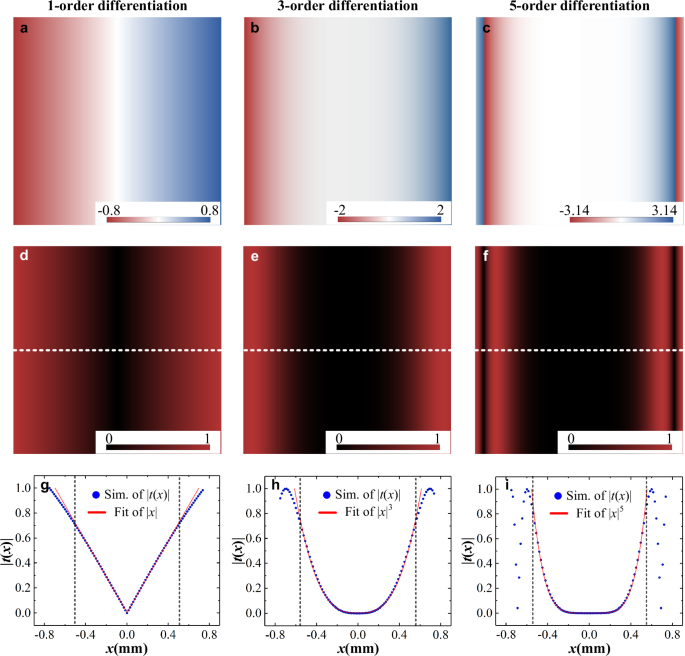
First column (a, d, and g), second column (b, e, and h), and third column (c, f, and i) correspond to first-order, third-order, and fifth-order differentiation, respectively. In each case, the first row represents the gradient phase of the PB metasurface. The second row illustrates the corresponding calculated optical transfer function with Eq. (2). The third row corresponds to the field distributions along white dashed lines, where blue points and red lines are the simulated results and fitted curves, respectively. Note that, here, we adopt the real space coordinate, x, to reflect the size of the metasurface, which is actually proportional to the momentum space coordinate, kx.
Metasurface fabrication and characterization
Dielectric materials, possessing lower loss, are commonly used for wavefront engineering via artificially constructing meta-atoms. Particularly, due to its large refractive index, stability, and CMOS compatibility, silicon (Si) is widely adopted for metasurface fabrication44. Accordingly, we use Si metasurface to achieve high-order differentiation. Figure 2a illustrates the structure of the meta-atom or the unit cell, which consists of a Si nanorod on a K9 glass substrate. The parameters of the unit cell are optimized with the software COMSOL Multiphysics. Specifically, the optimized nanorod has the size of (197times 95times 600n{m}^{3})(L×W×H), and the period (P) is 300 nm.
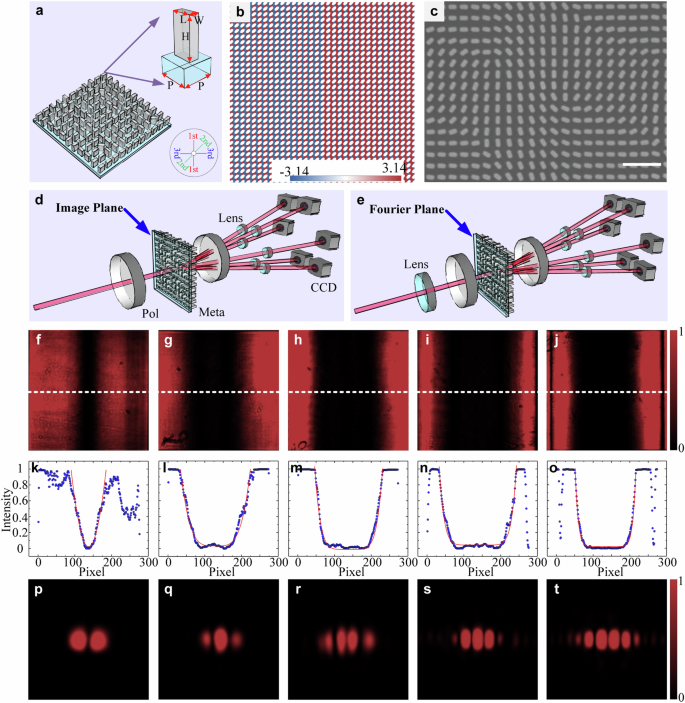
a the structure of the metasurface. b the gradient phase of the designed PB metasurface. c the SEM image of the fabricated metasurface. d and e the experimental setup for measuring the optical transfer functions and for performing the high-order derivatives of fundamental Gaussian mode, respectively. f–j correspond to the measured optical transfer functions for high-order differentiation operations from first-order to fifth-order. k–o illustrate the intensity distributions (blue dots) along white dashed lines in (f–j). Here, the red lines are the theoretical predictions with Eq. (2). p–t illustrate the observations for high-order derivatives of fundamental Gaussian mode. The white scale bar in c represents 1 µm. L length, W width, H height, P period, Pol polarizer, Meta metasurface, CCD charge coupled device.
Then, we leverage the universal top-down semiconductor fabrication process to arrange the unit cells (Methods). In previous works, one sample is generally used for one certain operation. Here, to further enhance the computational capacity of the sample and fully leverage its performance, we integrate multiple orders of differentiation operation onto a single metasurface through angle multiplexing45. For this, the phase profile of the gradient phase is modified as,
Here, (Lambda) represents the grating period, which determines the diffraction angle with respect to the propagation direction, namely, the z-axis. According to the PB or geometric phase of the HWP, the orientation angle of nanorods should be governed by (theta (x,y)={mbox{arg}}(varPhi (x,y))/2). Under this consideration, by passing through the designed PB metasurface, the light beam can be diffracted into different directions, thereby achieving j-order differentiation operation at specific directions of ({varphi }_{j}) and ({varphi }_{j}+pi) with respect to the x-axis. As shown in Fig. 2b, we experimentally integrate first-order, second-order, and third-order differentiation operations onto a single chip, with diffraction directions being (({0^ circ}) and ({180^ circ})), (({90^ circ}) and ({270^ circ})), and (({45^ circ}) and ({225^ circ})), respectively. From Fig. 2b, the multi-beam interference phase pattern can be seen clearly. Correspondingly, the scanning electron microscopy (SEM) image of the prepared sample is illustrated in Fig. 2c.
After fabricating the sample, we first measure its optical transfer function. As shown in Fig. 2d, a horizontally polarized Gaussian beam is guided to illuminate the sample. Subsequently, the diffracted light beams pass through a polarizer oriented at ({90^ circ}) and are imaged onto a CCD camera. Namely, the camera is located at the image plane of the sample. Here, the working area of our sample is merely (1.5 , times , 1.5{{{{rm{mm}}}}}^{2}), where a Gaussian beam, with a large beam waist, can be approximated as a plane wave. Accordingly, images acquired by the CCD camera can directly reflect the transfer function of the sample. The measured results of differentiation operations from first-order to fifth-order are successively presented in Fig. 2f–j. Correspondingly, we extract the intensity distributions along the white dashed lines therein and plot them in Fig. 2k–o. Blue dots and red lines represent experimental results and theoretical predictions with Eq. (2). Their consistencies clearly indicate that the prepared samples can perform high-order differentiation operations. Note that here we present the intensity distribution rather than the amplitude information in Fig. 1. Accordingly, the theoretical predictions correspond to the square modulus of Eq. (2).
In order to further demonstrate the capability of the sample, we perform the high-order analog differentiation of a Gaussian input. As shown in Fig. 2e, a Gaussian beam is guided to illuminate the sample after Fourier transform with a lens. The transmitted diffracted light beams are then guided to perform another Fourier transform and recorded by the CCD camera. This setup constitutes a typical 4f imaging system, with the sample located at the Fourier plane to conduct wave vector engineering. The experimental observations are illustrated in Fig. 2p–t. Theoretically, the high-order partial differential of the Gaussian function can be expressed as, ({partial }^{n}G(x,y)/partial {x}^{n}propto G(x,y){H}_{n}(x/sqrt{2{sigma }^{2}})), where, (G(x,y)=(1/(sigma sqrt{2pi }))times exp (-({x}^{2}+{y}^{2})/(2{sigma }^{2}))) with (sigma) being related to the waist of the Gaussian beam, and ({H}_{n}(bullet )) represents the Hermite polynomial. It is very similar to the formula of a Hermite-Gaussian (HG) beam46, presenting as a 1D horizontal lattice with (n+1) lobes, which can be clearly seen in our experimental observations. Accordingly, we termed it as HG-like mode. This verifies that our sample can indeed be used for optical analog differentiation operations.
High-order differentiation operations for intensity and phase images
As well known, optical image processing is a direct and promising application of optical analog computing. Differentiation operation can also be used for image edge detection. In this regard, here we conduct high-order differentiation of the image with the fabricated sample. For this, as shown in Fig. 3a, we prepare an intensity image of a cat and a phase image of a square by loading suitable digital holographic gratings (Methods) onto the spatial light modulator (SLM). Subsequently, the horizontally polarized light beams carrying the desired images are guided to a standard 4f imaging system, with the metasurface located at the Fourier plane. Finally, we filter out horizontally or vertically polarized light beams using a polarizer, corresponding to the direct imaging or differentiation operations, respectively. We then use a CCD camera located at the image plane of the imaging system to capture them.

a illustrates the experimental setup, and the insets therein represent the holographic gratings displayed by the SLM. b and h illustrate the direct imaging of an intensity object, “cat,” and a phase object, “square,” respectively. c–g correspond to the optical differentiation of cat image from first-order to fifth-order successively. i–m correspond to the high-order differentiation of square image. n–s correspond to the intensity distributions along white dashed lines in (h–m). SLM spatial light modulator, Pol polarizer, Meta metasurface, CCD charge coupled device.
We illustrate the experimental observations in Fig. 3b–g for the intensity image of the cat. By comparing the direct imaging in Fig. 3b with the high-order differentiation imaging in Fig. 3c–g (corresponding to the high-order differentiation operations from first-order to fifth-order), one can notice that only the edges of the cat are lit up. One can also see that there are multiple peaks around the image’s outline. Specifically, the number of peaks corresponds to the differentiation order, which is a typical feature of the high-order derivative31. Similarly, the high-order differentiation operations for the phase image of the square are also realized, and the corresponding results are illustrated in Fig. 3h–m. For comparison, in Fig. 3n–s, we plot the intensity distributions along the white dashed lines. These plots clearly show the features of the high-order differentiation operations, namely, discrete intensity peaks. Also, similar to the Gaussian mode, the intensity of the peaks generated by the higher-order differentiation of the image decreases from the center toward the edges. Meanwhile, these multiple peaks can provide a sharper peak or dip at the center of the edge position as the differentiation order increases47. Given the above, our sample can be effectively used for differentiation operations for both intensity and phase objects. Note that by improving the smoothness of the input image’s intensity distribution and enhancing the contrast of orthogonal polarization filtering, the imaging quality of higher-order differentiation can be further improved. In our demonstration, the phase jump between the inner and outer of the square is (pi). Since the phase discontinuity at the edges of a general image can take arbitrary values, in Supplementary Note 8, we perform high-order differentiation on phase images with different phase jumps.
Generally, biological samples that hide features in phase structures cannot be clearly revealed by direct imaging. Consequently, there has been a longstanding urgent need for optical image processing. Here, the ability to perform operations for the phase image indicates that our sample could be used for biological microscopy imaging. To verify this, we conduct the first-order and second-order differentiation operations on onion epidermal cells with our sample, and the corresponding results are illustrated in Supplementary Note 1. Furthermore, working bandwidth is another important consideration in practical applications. Accordingly, we demonstrate the capacity for broadband operation of the fabricated sample in Supplementary Note 2. All these observations confirm the effective performance of our sample.
High-order differentiation enabled optical super-resolution: Towards optical alignment in nano-fabrication
Previously, optical analog differentiation operations were typically used in image processing. Whether the scope of their application can be extended is of widespread interest, which serves as the motivation for the content of this section. As discussed above, the high-order differentiation of a Gaussian beam exactly corresponds to high-order HG-like modes. We note that optical super-resolution beyond the Rayleigh limit can be achieved through spatial mode filtering or interferometric detection48,49,50. However, compact meatsurface devices for optical-resolution detection have not been fully explored, inspiring us to consider whether our high-order differential metasurface can be used for achieving optical super-resolution detection.
Surpassing the diffraction limit has been a longstanding challenge in optical imaging. The Rayleigh limit or criterion specifies the minimum resolvable distance between two adjacent incoherent point sources constrained by optical diffraction. Here, we leverage the fabricated metasurface to create a super-resolution detector that exceeds the Rayleigh limit. Theoretically, the point spread function of point sources can be approximated as a Gaussian function49. In this regard, as shown in Fig. 4a, we use two collimated Gaussian beams emitted from two independent He-Ne lasers to prepare two incoherent separated point sources equivalently. Note that, here, two independent laser sources are both coherent. However, since the two lasers are independent, meaning their phases are not synchronized, and thus there is no interference between them. Namely, they are incoherent with respect to each other. We adjust their separation distances precisely by moving one point source with a motorized translation stage. These two sources are then guided to the constructed super-resolution detector, which consists of the differential metasurface and a single-mode fiber (SMF) connected to a power meter. Consider a particular case where two point sources completely overlap and are aligned with the center of the metasurface. After modulation with the metasurface, these two point sources are both converted into HG-like modes. Since the SMF can only support the fundamental Gaussian mode, the converted HG-like modes cannot pass through the SMF and be detected by the power meter. When one of the point sources is transversely displaced by a distance d, the resultant light field after metasurface can be expressed as,
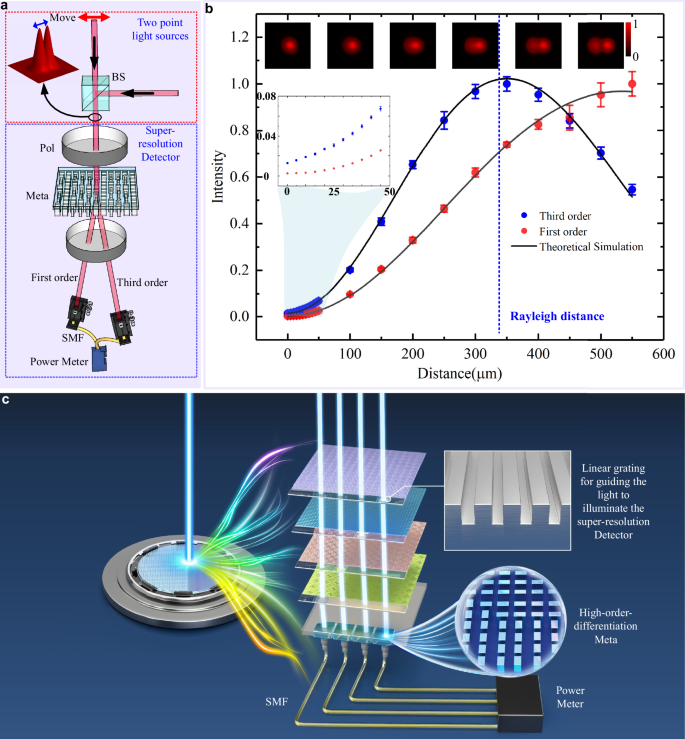
a illustrates the experimental setup. b presents the signal collected by the proposed super-resolution detector as the separation distance between the two point sources changes. Top insets therein show the intensity distributions of two point sources directly captured by the CCD camera. These six images correspond to separation distances ranging from 0 to 500 µm, with intervals of 100 µm. Error bars represent the standard derivations based on more than 50 independent measurements, which is acquired through continuous measurement with the power meter (Thorlabs, S130C) for 15 seconds. c the proposal for optical alignment in future nano-fabrication. Specifically, the light beams pass through the chips and then are guided to illuminate the super-resolution detector for alignment. BS beam splitter, Pol polarizer, Meta metasurface, SMF single-mode fiber.
Considering we only perform the operation along the x-direction, we conventionally omit the y-coordinate. Subsequently, the resultant light field is collected by SMF, which corresponds to calculating the overlap integral of the consequent light field with the fundamental Gaussian mode. In other words, the signal detected by the power meter can be expressed as,
After a series of algebra, we conclude that,
Compared with using a camera to capture the optical pattern, which cannot resolve two point sources below Rayleigh distance, as clearly shown in the insets of Fig. 4b, the intensity collected by our designed detector, indicated by Eq. (8), varies with the changes of separation distance. In other words, the distance can be determined via intensity detection. Taking the first-order and third-order Hermite polynomials for examples, with ({H}_{1}(varsigma )=2varsigma), ({H}_{3}(varsigma )=8{varsigma }^{3}-12varsigma), and (varsigma=-d/(2sigma )), third-order differentiation produces more significant intensity variations than first-order differentiation due to the higher-order exponential terms, thereby indicating an enhanced resolution capability. In theory, our method can be extended to determine the absolute distance of laser 1 and laser 2 from the metasurface, namely, optical super-resolution with unknown illuminations, as discussed in Supplementary Note 6.
Without loss of generality, we perform the experiment with first-order and third-order differentiation operations. By controlling the separation distance from 0 to 550 µm, we successively record the resultant optical intensities and plot them in Fig. 4b. For comparison, we calculate the theory predictions with Eq. (8). The consistencies between the experimental observations (indicated by blue or red dots) and theoretical ones (indicated by black lines) verify the excellent performance of our proposal. The third-order differentiation operation exhibits a more significant variation within the Rayleigh distance. Theoretically, the order of the exponential term increases with the order of the Hermite polynomials, which means that higher-order differentiation can achieve finer resolution. Furthermore, in our demonstration, the beam waists of two point sources are roughly 230 µm and 270 µm, with a corresponding Rayleigh distance of approximately 330 µm, indicated by the blue dashed line. Interestingly, when the distance between two point sources is below the Rayleigh distance, conventional direct imaging fails to resolve them, as indicated by the top insets of Fig. 4b. Whereas, our system can still resolve a separation of 5 µm, as shown in the left inset of Fig. 4b, corresponding 0.015 of the Rayleigh limit. This resolution is comparable to the pixel size of the CMOS scientific camera. Specifically, in our experiment, the pixel size of the camera (Thorlabs, CS2100M) is (5.04times 5.04)µm2. Note that, due to the influence of stray light in the realistic environment, imperfections in the polarization extinction ratio of the polarizer, and small shifts in the polarizer’s angle, a measurable value still exists at d = 0.
Considering that the Si metasurface is compatible with CMOS processes, the presented super-resolution detector provides a potential solution for the alignment. In modern semiconductor fabrication, multiple exposure techniques are often used to achieve higher processing precision or to create 3D chip configurations. During the multiple exposure process, except for the first exposure, all subsequent layers must align the mask with the patterns left by the previous mask to ensure accurate overlay. As shown in Fig. 4a, if we consider the metasurface device as a reference and the moving laser beam as a result of mask displacement, the lateral offset of the mask relative to the reference marker can be determined by monitoring the intensity output of the power meter. In this regard, the presented super-resolution detector could provide a potential solution for optical alignment. As shown in Fig. 4c, we present a proposal for optical alignment for multiple-exposure semiconductor manufacturing systems. Our proposal involves embedding a high-order differentiator metasurface directly into the semiconductor chips being produced, and integrating a linear grating on the mask, which is used to guide the transmitted or reflected light. Alternatively, a coating can also be applied to replace the grating to allow only the grating area to transmit or reflect light. Then, illuminating the first mask with a laser beam, the lateral displacement of the transmitted light spot relative to the metasurface will change as the mask moves. According to the concept presented in Fig. 4a, we can determine this lateral displacement by monitoring the intensity output of the power meter. After completing the exposure of the first layer, we repeat the above steps to align and expose the other masks. This proposal could also find potential applications in the field of 3D chip-stacking and heterogeneous integration. In this consideration, the five layers in Fig. 4c can be seen as the chips to be stacked. Note that, for simplicity, we only present the transmission case in Fig. 4c. Whereas, in some certain applications, considering the substrate could be non-transparent or with a large thickness, a reflective optical system is more practical. In this regard, our approach, far surpassing the Rayleigh diffraction limit, provides a potential solution for optical alignment. Additionally, compared with the conventional microscopy imaging system, the proposed scheme requires only a single-point detector, which could simplify the optical system.
Discussion
As well known, to meet the demands of different lithography applications, the alignment accuracy needs to reach the sub-micron or even nanometer scale. In our proposal, the resolution can be further improved by decreasing the size of the Gaussian beam, corresponding to an increase in the value of numerical aperture (NA). For demonstration, we reduced the beam waist of the Gaussian beam from 230 µm to approximately 70 µm, effectively increasing the NA from 0.0012 to 0.0038. Based on this, as shown in Fig. 5, we verify that the high-order differentiation detector can still resolve it even with a lateral offset of 200 nm. Actually, the resolution is primarily limited by power fluctuations, as seen from the histograms of multiple measurements for 0 nm, 200 nm, 400 nm, 600 nm, and 800 nm, indicated in the top-left inset of Fig. 5. Wherein the average intensity is resolvable, however, their power histograms overlap in some regions.
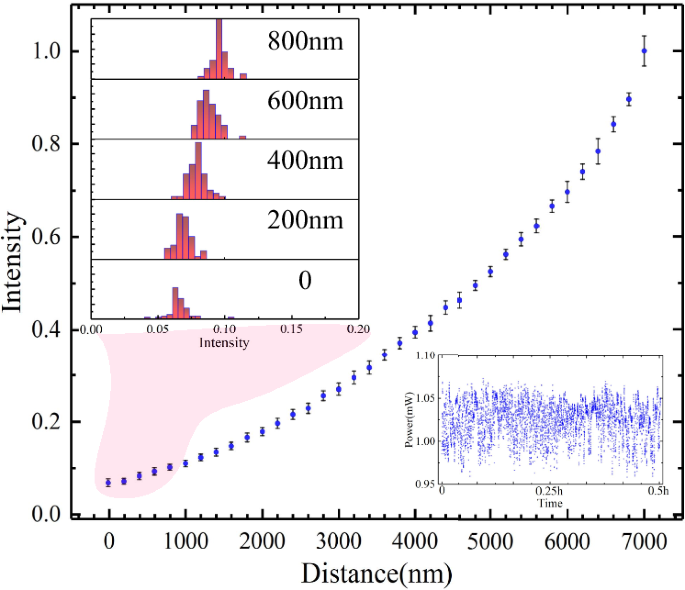
Top-left inset presents the histograms of multiple measurements for lateral displacement of 0 nm, 200 nm, 400 nm, 600 nm, and 800 nm, namely, the points marked by the pink area. The bottom-right inset presents the output intensity fluctuations of the laser source. Error bars represent the standard derivations based on more than 50 independent measurements, which is acquired through continuous measurement with the power meter (Thorlabs, S130C) for 15 seconds.
In our demonstration, power fluctuations primarily arise from the intensity fluctuations of the laser source. As shown in the bottom-right inset of Fig. 5, the intensity stability of our laser source is roughly 2%. On the other hand, the jitter during the movement of the motorized stage, the stability of the optical adjustment mirror mount, and the unstable interference caused by the reflection at the optical component and the laser also limit further improvements in precision. In this regard, the resolution can be further improved by replacing the current laser source, motorized stage, and mirror mount with more stable ones, and placing an optical isolator in the optical path. This paves the way for super-resolution microscopy imaging and for surpassing the diffraction limit in optical alignment for multiple-exposure semiconductor technologies. Additionally, as discussed in Supplementary Note 6, the proposed scheme for optical super-resolution could be extended to resolve multiple unknown point light sources, which has potential applications in super-resolution imaging.
Furthermore, by leveraging the basic mathematical feature of the Fourier transform, we theoretically proposed the universal phase-gradient functions of PB metasurface for arbitrary order differentiation operations. In the experiment, we realized the fifth-order differentiation for both intensity and phase objects. We also demonstrated that it can be used for biological microscopy imaging and has a broad operation bandwidth. Although we merely present the partial derivatives along the x-direction, based on the coordinate equivalence and the proposed theory in Eq. (2), our proposal can be extended to realize the arbitrary order analog full derivatives, the corresponding theoretical analyses are illustrated in Supplementary Notes 4 and 5. In this regard, our scheme can be used to conduct Taylor expansion for wavefront estimation. Similarly, the present demonstration in the Cartesian coordinate can also be extended to the polar coordinate for higher-order isotropic differentiation operation30,31,32. The polarization-dependent characteristic of our scheme makes it highly compatible with polarization entanglement, enabling quantum image processing51,52, which is urgently needed in quantum imaging53. Note that our present demonstration was performed within the 4 f imaging system. The phase of the Fourier lens can also be integrated into the differential phase to simplify and compact the system54,55, the corresponding theoretical analyses are illustrated in Supplementary Note 7. We will leave these possibilities in our future study.
Methods
Metasurface fabrication
The fabrication process of the high-order differential metasurface is as follows. First, the 600 nm α-Si film (its refractive index is illustrated in Supplementary Note 3) is deposited on the glass substrate. Subsequently, an 80 nm PMMA layer is spin-coated and baked at 180 °C for 1 hour. Our lab has consistently followed this baking process, as it yields stable results. Then, the PMMA layer is exposed to an electron beam (Elionix F125) and developed in an MIBK/IPA solution at 22 °C for 120 seconds to prepare the desired nanostructures. A 40 nm Cr film serving as a hard mask is then deposited at the rate of 0.5 Å/s using an electron beam evaporator (ULVAC ei-501z), followed by the lift-off process. Then, the Si film is etched by inductively coupled plasma (Leuven, ICP), and the remaining Cr film is finally removed by immersing the sample in a chromium etchant for 10 minutes. Note that we use K9 glass as the substrate due to its excellent mechanical properties, including high strength, hardness, and heat resistance, which reduce the risk of sample damage.
Holographic gratings for preparing input image
Generally, mimicking the optical interference holography and displaying the digital holographic gratings with a spatial light modulator (SLM) to generate complex amplitude images is widely adopted in the area of light field engineering. To realize the amplitude modulation with a pure-phase SLM, a common method involves modulating the diffraction efficiency by engineering the phase depth. Accordingly, the holograms displayed by the SLM can be expressed as56,
where (Phi {(x,y)}_{{{{rm{image}}}}}) and (I{(x,y)}_{{{{rm{image}}}}}) are the phase and intensity distributions of the desired prepared images, (Phi {(x,y)}_{{{{rm{Linear}}}}}) represents the phase of the linear blazed grating, which determines the diffraction angle of the prepared images, and ({{{{rm{sinc}}}}}^{2}(bullet )) is used to map the intensity to the diffraction efficiency. Finally, the phase distribution (ranging from 0 to (2pi)) of (Phi {(x,y)}_{{{{rm{SLM}}}}}) is converted into a grayscale image (ranging from 0 to 255), which is then loaded onto the SLM. By illuminating the SLM, the desired optical images can be thereby acquired.
Responses