Metformin-regulated glucose flux from the circulation to the intestinal lumen
Introduction
Metformin is one of the most widely prescribed antidiabetes drugs worldwide. While the anti-diabetic action of metformin is believed to occur primarily through the inhibition of hepatic gluconeogenesis1, its underlying mechanisms remain not fully understood. Various biological effects potentially explaining metformin’s action, such as the inhibition of mitochondrial respiratory complex I and subsequent increase in the AMP/ATP ratio leading to AMPK activation, have been identified1. However, these effects are typically observed only at concentrations significantly higher than in vivo levels, posing a challenge to their relevance in metformin’s effects2. Conversely, when the drug is orally administered, the intestinal tract is exposed to high concentrations of metformin, and the drug persists in the intestinal tract for an extended period3. These findings have prompted many researchers to investigate the intestinal actions of metformin4,5,6,7,8.
More than a decade ago, metformin was found to promote the accumulation of radioactivity in the intestine during[18F]fluorodeoxyglucose ([18F]FDG) positron emission tomography(PET) –computed tomography (CT)9, an imaging modality widely adopted for cancer detection. Given that FDG is a tracer of glucose and that metformin augments glucose utilization in intestinal cells in rodents10,11, the metformin-induced intestinal accumulation of [18F]FDG in humans was thought to reflect enhanced glucose utilization4. In PET-CT, however, the images of the two modalities are obtained sequentially, raising the possibility that bowel peristalsis during image acquisition might result in misregistration of CT and PET images. It has thus been difficult to determine whether the accumulation of [18F]FDG occurs in the intestinal wall or intraluminal space with the use of PET-CT.
PET- magnetic resonance imaging (MRI), in which PET and MRI images are acquired simultaneously, provides better tissue registration, especially for organs prone to movement, as well as better soft-tissue contrast compared with conventional PET-CT12,13. By exploiting these advantages of [18F]FDG PET-MRI, we recently showed that metformin increases the amount of radioactivity in the intestinal lumen14,15, indicating that it stimulates the transfer of glucose from the circulation to the intestinal lumen. Whereas this finding implied the existence of a previously unrecognized glucose flux in humans, it was based on a retrospective analysis of existing images with a semiquantitative measure14,15. Moreover, whereas FDG is commonly used to evaluate glucose flux in the body16,17,18, the dynamics of glucose and FDG are not entirely identical.
To provide further insight into the metformin-induced transfer of glucose from the circulation to the intestine, we developed a new bioimaging system based on PET-MRI that allows quantitation of glucose flux to the intestinal lumen. We also analyzed metformin-induced changes in the dynamics of glucose and its derivatives in the intestine with the use of stable isotope (13C)–labeled glucose and mass spectrometry in mice. Our findings reveal that a substantial amount of glucose is transferred from the circulation to the intestinal lumen, a process enhanced by metformin. Furthermore, the glucose excreted into the intestine is metabolized by gut microbiota, producing short-chain fatty acids that likely contribute to the symbiosis between gut microbiota and the host.
Methods
Human [18F]FDG PET-MRI studies
These clinical studies were conducted in accordance with the Declaration of Helsinki and its amendments. They received approval from the Ethics Committee of Kobe University Hospital (approval nos. A210001, A210010, and C200017) and were registered with the University Hospital Medical Information Network Clinical Trials Registry (UMIN No. 000043446 and 000045137), and with the Japan Registry of Clinical Trials (jRCTs051200115), respectively. The inclusion and exclusion criteria for study subjects are shown in Table S1. Blood parameters were evaluated only on the day of the PET-MRI.
To evaluate the site of metformin-induced intestinal FDG excretion, we performed a continuous image acquisition of PET-MRI as an exploratory, single-group study (UMIN No. 000043446). The PET-MRI (Signa PET/MR, GE Healthcare) was conducted after intravenous administration of [18F]FDG (3.5 MBq/kg) in subjects with T2DM who had been taking metformin at a dose of 1000 mg or more per day for at least one month and had fasted for at least 6 h. PET and MRI images were acquired continuously for 90 min and every 10 min starting 1 min after [18F]FDG injection, respectively. The [18F]FDG accumulation in each part of the intestine was evaluated based on SUVpeak, as previously described15. A total of 5 patients were recruited from April 2021 to March 2023. The study was completed as planned with no deviations or adverse events.
To quantitatively evaluate the excretion of FDG into the intestinal lumen, PET-MRI image acquisition was performed in exploratory, two single-group studies (jRCTs051200115 and UMIN No. 000045137). The PET-MRI was conducted after intravenous administration of [18F]FDG (3.5 MBq/kg) in T2D subjects treated with metformin at 1000 mg or more per day (jRCTs051200115) or without any dose of metformin (UMIN No. 000045137) for at least one month. For quantitative analysis of [18F]FDG accumulation in the intestinal wall and lumen, subjects received an intramuscular injection of butylscopolamine (10 mg) 60 min after [18F]FDG administration to reduce peristalsis, and 3D images of the entire intestine were then acquired using the imaging sequence for MR enterography (MRE)19. [18F]FDG PET images were superimposed on the MRE images to obtain information on the 3D distribution of radioactivity in the intestine. We also utilized soft-tissues contrast obtained by MRI for discrimination of the wall and lumen using an Advantage Workstation 4.7 (GE Healthcare), as previously described15. In short, we first segmented the intestinal tracts from the whole MRI image data. The intra-abdominal fat is removed by setting a threshold using the Fat image of the 2-point Dixon method in MRE. Other structures besides the intestinal tracts are semi-automatically removed using imaging software equipped to the device (Advantage workstation 3.2, GE HealthCare). Among the remaining bowel structures, regions with high signal intensity on the T2-weighted images of MRE are segmented using a threshold, delineating the areas of bowel fluid, i.e., the bowel lumen. Among the remaining bowel structures, areas with high signal intensity on the T1-weighted images of the 2-point Dixon method, i.e., highly concentrated residue (corresponding largely to stool or concentrated intestinal fluid), are removed. The remaining portions are segmented as the bowel wall. A total of 10 subjects with (n = 5) or without (n = 5) metformin treatment were recruited from January 2021 to February 2023 and from October 2021 to March 2023, respectively, and completed the study as planned with no deviations or adverse events. Some parts of the study were interventional.
Mice studies
Mice were handled according to the guidelines of, and the study was approved by, the Animal Experimentation Committee of Kobe University Graduate School of Medicine (approval nos. P180503 and P210104) and the Animal Care and Use Committee of RIKEN Kobe Institute (approval no. A2021-06). Although it is not well established whether sex differences exist, our previous study found no sex differences in retrospective human analyses. Therefore, mouse experiments were conducted using males only for simplicity.
Intestinal [18F]FDG accumulation in mice
Male C57BL/6J mice at 5 weeks of age were treated with metformin by adding the drug to drinking water at a concentration of 3 mg/ml. This resulted in a metformin exposure of approximately 700 mg/day per mouse. Metformin-treated mice at 4 weeks after the onset of drug administration or control mice were deprived of food for 16 h and then injected in the conscious state with [18F]FDG at a dose of 10 MBq (in 0.1 ml of physiological saline) through a cannula placed in the tail vein. One hour after the injection, the mice were anesthetized with 3% isoflurane and a blood sample was collected from the right atrium. The intestinal tract was then resected from the pylorus to the anus and divided into four parts (upper small intestine, lower small intestine, cecum, and colon). The contents of the intestinal tract were collected by washing with 7.5 ml of physiological saline each for the upper and lower small intestine or with 3 ml each for the cecum and colon. Each intestinal segment, the luminal contents, and the blood sample were weighed and were measured for radioactivity with a gamma well counter (Wizard 2480, PerkinElmer). Tissue radioactivity was determined as MBq/tissue, with becquerels being determined with the use of a cross-calibration factor calculated with a dose calibrator and the gamma well counter.
For [18F]FDG metabolite analysis by TLC20, intestinal tissue segments and luminal contents were prepared from mice as described above with the exception that [18F]FDG was administered at a dose of 30 MBq. About 100 mg of the dissected intestinal tissue or luminal contents were homogenized in an ice-cold solution of 2 M perchloric acid and 4 mM EDTA. The homogenates were centrifuged at 430 × g for 5 min at 4°C, and the resulting supernatants were neutralized with a solution containing 2 M KOH with 0.3 M MOPS and then centrifuged again, with the new supernatants being subjected to TLC. The samples (2 µl) were spotted at the origin point of a normal-phase plate (Silica60 HPTLC, Merck), which was then developed with an eluent solvent containing 1-butanol/acetic acid/H2O (2:1:1, v/v/v). The chromatogram was imaged with an image analyzer (FLA 7000, GE Healthcare Life Sciences), and [18F]FDG and its metabolites were identified on the basis of their retardation factor (Rf) values (0.7 for [18F]FDG, 0.4 for [18F]FDG-6-P, 0.2 for [18F]FD-PGL, and 0.1 for [18F]FDG-1,6-P2). The corresponding signal intensities of FDG and its metabolites in each tissue were quantified using image processing software (MultiGage, Fujifilm, Japan). They were divided by the sum of the signal intensities to calculate the composition ratio.
Mathematical analysis of intestinal glucose excretion rate (GER)
We generated a compartment model consisting of blood and intestinal lumen compartments (Fig. S1) on the basis of the following assumptions: (1) [18F]FDG and glucose move unidirectionally from blood to the intestinal lumen and are neither reabsorbed, degraded, nor excreted outside the intestinal tract after the movement into the intestinal lumen, (2) the fractional rate constant (k_1) and (k_2) that define the excretion rate is the same for [18F]FDG and glucose, and (3) blood glucose levels remain unchanged from the fasting state during the test time. If the radioactivity and concentration of [18F]FDG and glucose in the blood at a certain time point t were defined as R_b (t) and C_b (t), respectively, the derivative of intraluminal radioactivity [R_i (t)] of [18F]FDG and concentration of glucose [C_i (t)]were obtained by the following equation:
Time integration of both sides of Eq. (1) yields the following equation:
R_i (t), which indicates total absolute radioactivity transferred into the intestinal lumen at time t, was evaluated by [18F]FDG PET-MRE in humans or by measuring radioactivity with a gamma counter in mice.(,{int }_{0}^{t}{R}_{{_b}}left(tright){dt}) was determined by a curve-fitting method based on the radioactivity either associated with the aorta as assessed by [18F]FDG PET-MRE at 60 and 120 min after [18F]FDG injection in humans or in blood samples collected at 30, 60, and 90 min after [18F]FDG injection in mice. Calculation of k_1 is then performed with the following equation:
As k_2 was assumed to be proportional to k_1, GER was calculated as
The reaction constants for glucose and FDG with various proteins, such as enzymes or glucose transporters, are not entirely identical. Lumped constants have been reported in various species and organs21,22,23,24,25,26,27 (Table S2) whereas the lumped constant in intestinal cells has not been reported. We thus assumed a lumped constant of 1 (i.e., assuming k_1 and k_2 are identical) in the current analysis. We used the data of the intraluminal radioactivity at 60 minutes after [18F]FDG administration. The circulating blood volume (liters) of human (man) was calculated as 0.168H3 + 0.050 W + 0.444, where H is height (meters) and W is weight (kilograms), and that of mice (milliliters) as 0.072 W, where W is weight (grams)28,29.
[13C]Glucose administration in mice
Male C57BL/6 J mice at 6 weeks of age were treated (or not) with metformin for 4 weeks as described above. As indicated, a cocktail of antibiotics (ampicillin at 5 mg/ml, gentamycin at 5 mg/ml, neomycin at 5 mg/ml, metronidazole at 5 mg/ml, and vancomycin at 2.5 mg/ml, all obtained from Fujifilm Wako) was administered in 200 µl of water by oral gavage daily for the final 7 days of metformin treatment. At 10 weeks of age, the blood glucose level and body mass of the mice were measured before they were deprived of food for 16 h and then injected with [12C6]glucose (Sigma-Aldrich) or [13C6]glucose (>99% 13C, Cambridge Isotope Laboratories) at a dose of 0.35 g/kg via the tail vein. The mice were killed and all feces in the colon and rectum were collected at 1 h after glucose injection.
SCFA measurement
SCFAs were extracted from feces as described previously30, with some modifications. Feces (50 mg) were mixed with 500 μl of 0.5% phosphoric acid, agitated for 20 min with a vortex mixer, subjected to ultrasonic treatment for 5 min with a Bioruptor II instrument (Sonicbio), and centrifuged at 17,500 × g for 10 min 4 °C. The resulting supernatant was transferred to a new tube, 500 μl of diethyl ether containing of 4-methylvaleric acid (internal standard) at 10 μg/ml were added, and the mixture was agitated for 5 min and then centrifuged again. The ether layer was transferred to a vial, with pure water serving as a blank sample to correct for background interference.
GC-MS analysis was performed with a 7000 C gas chromatograph equipped with a 7890B inert mass spectrometer detector and a DB-FFAP capillary column (inner diameter, 0.25 mm; length, 30 m; film thickness, 0.25 μm) (Agilent Technologies), and with hydrogen as the carrier gas. A portion (1 µl) of the ether layer was injected with a 10-μl syringe and a 7693 A autosampler (Agilent Technologies). The injection was performed in splitless mode, with the injection port temperature held at 250 °C. The initial oven temperature was maintained at 40 °C for 2 min, increased first at a rate of 5 °C/min to 150 °C and then at 10 °C/min to 240 °C, and then held for an additional 15 min. The mass spectrometer transfer line, ion source, and quadrupole temperatures were set at 240°, 280°, and 150 °C, respectively. Ionization was performed in the electron impact mode at 70 eV. Data were acquired at 45.5 min with a 4.5-min solvent delay and with the selected ion monitoring (SIM) mode. The selected ions monitored are listed in Table S3. The dwell time for an all SIM channel was set at 20 ms. Calibration curves were generated from triplicate analysis of standard solutions at 0.1, 1, and 10 μg/ml, with the ratio of the chromatographic peak area of each analyte to that of the internal standard being determined. The ratio of 13C to total carbon for each SCFA [13C/total C (%)] was calculated from the mass spectral isotopic distributions obtained from GC-MS analysis, as described previously31.
Statistics and reproducibility
Measurements were taken from distinct samples. Quantitative data are presented as means ± s.e.m. and were compared between or among groups with the two-tailed unpaired Student’s t test or by two-way analysis of variance (ANOVA) with Bonferroni’s post hoc test, respectively. A P value of <0.05 was considered statistically significant.
Reporting summary
Further information on research design is available in the Nature Portfolio Reporting Summary linked to this article.
Results
FDG is excreted from the small intestine and moves along the intestinal tract
Metformin-induced intestinal accumulation of [18F]FDG during PET-CT is apparent mainly in the colon9,32. We first investigated the temporal changes in the amount of radioactivity in the intestine after [18F]FDG injection in human subjects. PET-MRI images were continuously acquired for 90 min after the intravenous administration of [18F]FDG in five individuals with type 2 diabetes (T2D) treated with metformin. The characteristics of these study subjects and movies of continuous PET-MRI images are shown in Table S4 and Supplementary Movie 1, respectively. Still images of a representative individual at various times after [18F]FDG injection are also shown in Fig. 1a. Radioactivity was apparent in the small intestine within 10 min after [18F]FDG injection and subsequently increased in amount in the ascending and then descending colon (Fig. 1a). Close-up examination of the movies revealed that the radioactivity moved along the intestinal tract toward the anus by peristalsis (Supplementary Movie 1). Temporal changes in the amount of radioactivity in the aorta and portions of the intestine for a representative individual are shown in Fig. 1b. The amount of radioactivity in the jejunum was initially higher than that in other regions of the intestine at the start of the observation period and then decreased gradually (Fig. 1b). On the other hand, the amount of radioactivity in other parts of the intestine—including the ileum; the ascending, transverse, and descending colon; and the rectum—increased over time. The temporal changes in radioactivity for the other study participants showed an essentially similar pattern, with the exception that the amount of radioactivity in the jejunum at the start of the observation period was not the highest among the intestinal regions in case 2 (Fig. S2). These results thus indicated that intravenously injected [18F]FDG is transferred to the intestinal lumen primarily via the jejunum and then moves toward the anal end of the intestinal tract.

a Images of a representative subject (case 5: 60-year-old woman taking 2250 mg of metformin daily). b Temporal changes in the amount of radioactivity during [18F]FDG PET-MRI imaging of the aorta and various portions of the intestine for a representative subject (case 1: 56-year-old man taking 1500 mg of metformin daily). A-, T-, and D-colon: ascending, transverse, and descending colon, respectively. SUVpeak, peak of standardized uptake value.
Quantitative analysis of FDG excretion in the human intestine
We next attempted to quantify the intraluminal excretion of FDG by developing a bioimaging system based on PET-MRI. We adopted imaging sequences of magnetic resonance enterography (MRE)19 to generate three-dimensional (3D) images of the entire intestinal tract (Supplementary Movie 2). We then superimposed the [18F]FDG PET images onto the 3D MRE images to obtain information on the 3D distribution of radioactivity. We termed this imaging sequence PET-MRE. We performed PET-MRE for individuals with T2D treated or not treated with metformin and evaluated the absolute amount of radioactivity in each part of the intestine with discrimination between the wall and lumen. The characteristics of these study subjects and corresponding maximum intensity projection (MIP) PET images are shown in Table S5 and in Fig. 2, respectively.
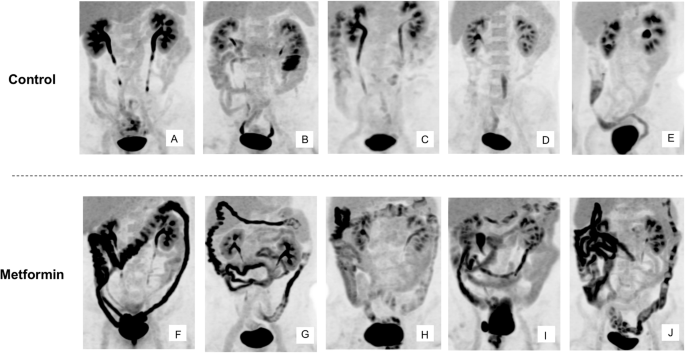
Images obtained at 60 min after [18F]FDG injection are shown for individuals with T2D not treated (A–E) or treated (F–J) with metformin.
This quantitative analysis revealed that radioactivity was present in the wall and lumen of the intestine in similar amounts in subjects not taking metformin (2.21 ± 0.39 and 1.91 ± 0.39 MBq for the wall and lumen of the entire intestine, respectively) (Fig. 3a and Table S6) In subjects treated with metformin, however, the amount of radioactivity in the lumen was three to four times as great as that in those not taking the drug, whereas the amount of radioactivity in the wall was similar between the two groups (Fig. 3a and Table S6). The ratio of FDG excreted in the lumen was 1.18 ± 0.25 and 4.21 ± 0.21 % of the total injected dose, respectively.
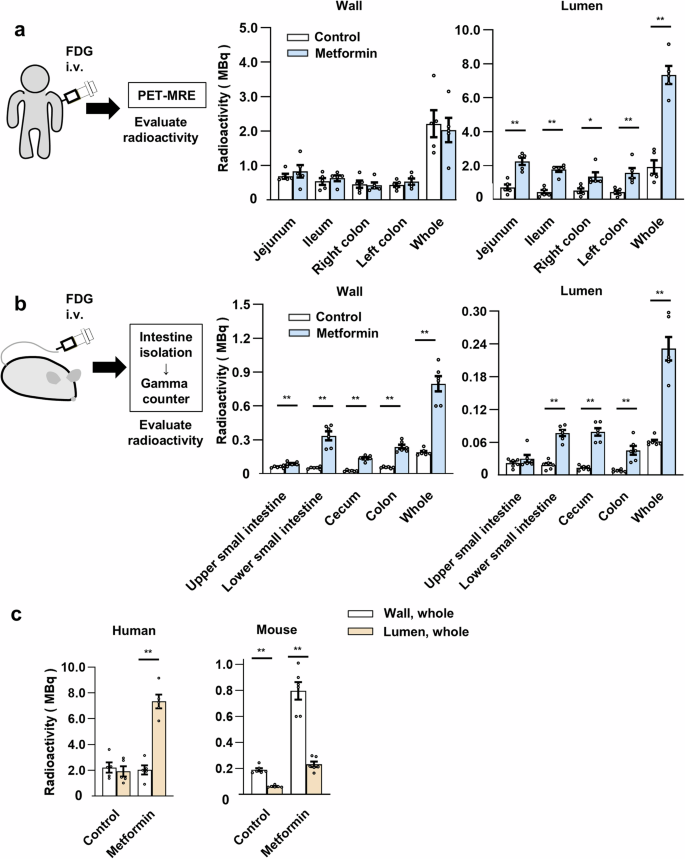
a Quantitation of radioactivity in the wall and lumen of the entire intestine or regions thereof at 60 min after intravenous (i.v.) [18F]FDG administration as determined by PET-MRE in individuals with T2D treated or not (control) with metformin (n = 5 individuals in each group). b Direct measurement of radioactivity in the wall and contents (lumen) of the isolated intestine at 60 min after intravenous [18F]FDG injection for mice treated or not (control) with metformin (n = 6 mice per group). c, Distribution of radioactivity in the intestinal wall and lumen for humans and mice as determined in (a, b). All data are means ± s.e.m. *P < 0.05, **P < 0.01 (two-tailed unpaired Student’s t test). The exact P values corresponding to the symbols in each figure are as follows: (a): 5.5 × 10⁻³, 1.1 × 10⁻³, 2.2 × 10⁻², 7.0 × 10⁻³, and 3.9 × 10⁻⁵, respectively; (b): 8.9 × 10⁻³, 2.8 × 10⁻⁶, 6.6 × 10⁻⁷, 3.5 × 10⁻⁶, 4.7 × 10⁻⁶, 4.3 × 10⁻⁶, 3.1 × 10⁻⁶, 1.1 × 10⁻³, and 1.3 × 10⁻⁶, respectively; (c) 3.5 × 10⁻⁶, 1.0 × 10⁻⁶, and 1.2 × 10⁻⁵, respectively.
Quantitative analysis of FDG excretion in the mouse intestine
We next investigated intestinal FDG dynamics by directly measuring the radioactivity associated with the isolated intestine of mice. C57BL/6 J mice, treated or not with metformin, were injected with [18F]FDG via the tail vein, the entire intestine was isolated 1 h after the injection, and the radioactivity associated with the wall and contents of different regions of the intestine was measured with a gamma counter. Blood glucose levels (103.2 ± 10.3 and 99.2 ± 8.6 mg/dl, respectively; means ± s.e.m., P = 0.75 by the two-tailed unpaired Student’s t test) and body weight (22.6 ± 0.2 and 23.3 ± 0.5 g, respectively, P = 0.14) did not differ significantly between the control and metformin-treated mice. Similar to humans, radioactivity was detected in both the wall and lumen (contents) of the mouse intestine and, with the exception of the upper small intestine, the amount in the lumen was increased three- to fourfold by metformin treatment (Fig. 3b and Table S6). However, unlike humans, the amount of radioactivity in the wall was also increased by metformin treatment in all parts of the intestine examined. The distribution of radioactivity in the wall and lumen of the intestine differed substantially between humans and mice under both control and metformin-treated conditions (Fig. 3c).
We also examined the relative abundance of intact and metabolized forms of [18F]FDG in the wall and lumen of the mouse intestine by thin-layer chromatography (TLC) and autoradiography (Fig. S3, Table S7). In the wall of the small intestine of control mice, both intact and metabolized forms of [18F]FDG were present, with the metabolized forms being predominant. On the other hand, most [18F]FDG (>90%) in the lumen of the small intestine, where the glucose derivative is excreted in humans (Fig. 1), was present in the intact form (Fig. S3, Table S7), which may reflect the fact that facilitative glucose transporters transfer only the intact form of FDG33. In the cecum and large intestine, however, most [18F]FDG in both the wall and lumen was present in metabolized forms. We obtained similar findings with metformin-treated mice. These results suggested that FDG is excreted into the small intestine in the intact form and is then metabolized, possibly by the gut microbiota, as it moves to the lower intestine.
Previous studies found that metformin-induced accumulation of radiolabeled glucose in the intestine was evident only in the wall, not in the contents, for mice that were anesthetized before tracer administration34,35. Our preliminary experiments showed that anesthesia of mice before [18F]FDG injection reduced the amount of radioactivity detected in intestinal contents. Given that anesthesia affects hexokinase activity in some organs36,37, it is possible that such treatment attenuates intestinal glucose excretion by altering intracellular glucose metabolism.
Estimation of the rate of glucose excretion by mathematical analysis
We next evaluated the rate of glucose excretion into the human intestine with mathematical analysis. We set a compartment model consisting of a blood vessel and an intestinal lumen compartment (Fig. S1). We calculated the rate constant (k) of FDG movement on the basis of the radioactivity detected in the intestinal lumen and blood, and we then determined GER as the product of k, the fasting blood glucose concentration, and the estimated total blood volume for each of the studied individuals (Table 1). GER and GER standardized by body mass for the control group were 6.76 ± 1.30 mg min–1 (0.41 ± 0.08 g h–1) and 1.00 × 10⁻¹ ± 0.19 × 10⁻¹ mg min–1 kg–1, respectively, and those for the metformin group were 27.51 ± 2.23 mg min–1 (1.65 ± 0.13 g h–1) and 3.83 × 10⁻¹ ± 0.38 × 10⁻¹ mg min–1 kg–1, respectively.
We also estimated GER in mice with the same compartment model. GER and GER standardized by body mass for the control mice were 1.99 × 10⁻³ ± 0.18 × 10⁻³ mg min–1 and 0.88 × 10⁻¹ ± 0.08 × 10⁻¹ mg min–1 kg–1, respectively, and those for the metformin-treated mice were 7.41 × 10⁻³ ± 0.82 × 10⁻³ mg min–1 and 3.20 × 10⁻¹ ± 0.38 × 10⁻¹ mg min–1 kg–1, respectively (Table 2). These results thus showed that the transfer of FDG from blood vessels to the intestinal lumen occurs at similar rates in humans and mice (1.00 × 10⁻¹ ± 0.19 × 10⁻¹ versus 0.88 × 10⁻¹ ± 0.08 × 10⁻¹ mg min–1 kg–1, respectively), and that metformin increases the rates by similar extents in both species (3.82- and 3.63-fold increases, respectively). They also suggested that the glucose flux from the circulation into the intestinal lumen may be a common physiological feature among mammalian species, whereas the rates of glucose metabolism in intestinal cells appear to differ substantially between humans and mice (Fig. 3c).
Analysis of the dynamics of glucose and its derivatives in the intestine
Whereas our experiments with [18F]FDG suggested that glucose is excreted into the intestinal lumen and metabolized by the gut microbiota in the large intestine, the dynamics of FDG are not entirely the same as those of glucose. We therefore attempted to confirm intestinal glucose excretion and subsequent metabolism with the use of glucose labeled with the stable isotope 13C. C57BL/6J mice, treated or not with metformin, were thus injected via the tail vein either with glucose in which all six carbon atoms are 13C ([13C6]glucose) or with normal glucose ([12C6]glucose) as a control (Fig. 4a). One hour after the injection, feces obtained from the isolated colon were subjected to gas chromatography–mass spectrometry (GC-MS) analysis. The various groups of mice showed no substantial differences in blood glucose levels or body mass (Table S8).
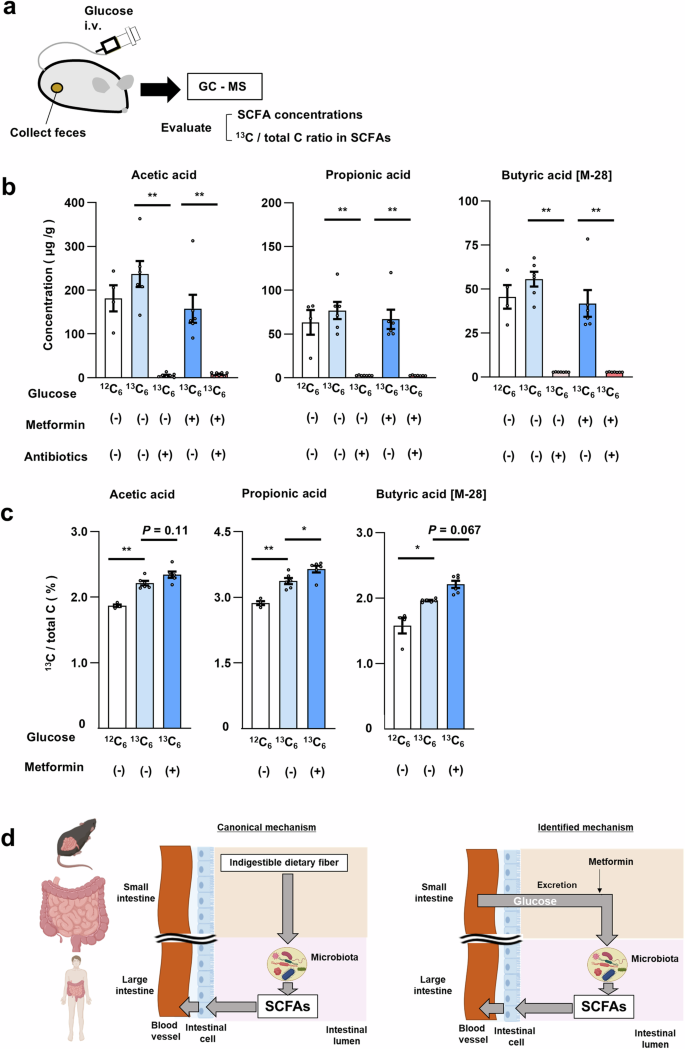
a Schematic of the experimental protocol. b, c Concentration of SCFAs (b) and the proportion of 13C among total carbon of SCFAs (c) in feces of mice injected with [12C6]glucose (>99% 12C) or [13C6]glucose (>99% 13C) and treated (or not) with metformin for 4 weeks or antibiotics for 7 days. Each dot represents an individual mouse. The numbers in (b) are n = 4, 6, 7, 6, and 7, respectively. The numbers in (c) are n = 4, 6, and 6, respectively. d Schematic summary showing the generation of SCFAs by the gut microbiota from indigestible dietary fiber (canonical mechanism) as well as from glucose excreted into the intestine from the circulation in a manner sensitive to stimulation by metformin (identified mechanism). All quantitative data are means ± s.e.m. *P < 0.05, **P < 0.01 (two-way ANOVA with Bonferroni’s post hoc test). The exact P values corresponding to the symbols in each figure are as follows: (b): 4.4 × 10⁻⁶, 1.0 × 10⁻³, 2.6 × 10⁻⁵, 1.6 × 10⁻⁴, 9.0 × 10⁻⁸, and 6.0 × 10⁻⁵, respectively; (c): 3.9 × 10⁻³, 2.5 × 10⁻³, 3.1 × 10⁻², and 1.8 × 10⁻², respectively.
We did not detect non-metabolized [13C6]glucose in feces, consistent with the finding that [18F]FDG is present mostly as metabolized forms in the lumen of the large intestine (Fig. S3). We next examined short-chain fatty acids (SCFAs) as representative carbohydrate metabolites produced by gut microbiota38. The absolute abundance of SCFAs—including acetic acid, propionic acid, and butyric acid—in feces showed no significant differences among control mice injected with [12C6]glucose or [13C6]glucose and metformin-treated mice injected with [13C6]glucose (Fig. 4b). However, the amount of each SCFA was greatly diminished by prior treatment of the mice with antibiotics (Fig. 4b), confirming that the measured SCFAs were produced by the gut microbiota. We next examined each SCFA for its content of 13C (Fig. 4c). In control mice injected with [12C6]glucose, the proportion of 13C among total carbon in SCFAs was ~1.5% to 3%, consistent with the ratio calculated based on the abundance of 13C in nature39. Injection of [13C6]glucose increased the 13C content of all SCFAs, and metformin treatment significantly increased the incorporation of 13C into propionic acid and tended to increase that into acetic and butyric acids. These results indicated that glucose in the circulation is transferred to the intestinal lumen and is then metabolized, at least in part, to SCFAs.
Discussion
Previous studies with rodents have suggested that glucose in the circulation is transferred to the intestinal lumen34,40,41,42, but this phenomenon has remained largely uncharacterized, particularly in humans. The magnitude of the glucose flux we identified in metformin-treated individuals (1.65 ± 0.13 g h–1) is approximately 20% of hepatic glucose output in the fasting state and comparable to urinary glucose excretion in individuals treated with sodium-glucose cotransporter (SGLT) 2 inhibitors43. The simultaneous acquisition of PET and MRI images by [18F]FDG PET-MRI allows accurate registration of the two images and detailed evaluation of glucose flux into the intestinal lumen, which led to the identification of the previously unrecognized substantial glucose flux.
Individuals who do not receive metformin treatment excrete approximately one-fourth of the amount of glucose excreted by those who receive metformin treatment. This finding is also unexpected and it suggests that the glucose flux has physiological significance independent of metformin’s action. One consequence of this flux appears to be the provision of carbohydrate to the gut microbiota. SCFAs are generated by the gut microbiota as a result of the metabolism of indigestible dietary fiber (Fig. 4d). However, our current findings suggest that, even in the absence of such fiber, glucose excreted into the intestine serves as a source for SCFA production. The abundance of SCFAs in feces or blood has been found to be increased by metformin treatment5,44. The intestinal glucose flux characterized here may contribute to this effect of metformin.
The mechanism by which glucose is excreted from intestinal cells is unknown. Continuous PET/MRI imaging revealed that FDG is initially observed in the jejunum, suggesting its involvement in FDG excretion. While FDG appeared in the colon within 30 minutes after its administration in some study participants, this timeframe is sufficient for FDG to transit from the jejunum to the colon, considering the reported small intestinal transit time45,46. The presence of [18F]FDG in the intact form in the lumen of the mouse small intestine suggests that glucose excretion is mediated by a protein that selectively interacts with intact FDG such as glucose transporters. Expression of the glucose transporter GLUT2 at the luminal surface of the jejunum was previously found to be increased by metformin treatment in rodents40,47. Given that GLUT2 is a bidirectional transporter, this phenomenon may account for the stimulatory effect of metformin on glucose excretion into the intestinal lumen. Another recent study, however, showed that metformin promoted the accumulation of GLUT2 at the basal surface of the small intestine48. We cannot completely exclude the possibility that the intestinal tract other than the jejunum excrete glucose via transporters other than GLUT2. A previous study suggests that GLUT1 is involved in intestinal glucose excretion in a certain conduction42.
The reaction constants of glucose and FDG for their interacting proteins, such as hexokinase and glucose transporters, are not identical49, and the ratio of the constants for glucose and FDG is termed the lumped constant. The reported lumped constant has varied from 0.44 to 1.35 in different organs and species21,22,23,24,25,26,27 (Table S2). Given that lumped constant in the intestine in mice and humans are not reported, we calculated GER under the assumption that lumped constant is 1; that is, the velocity of transfer of glucose and FDG from blood to the intestinal lumen is identical. If the lumped constant is smaller or greater than 1, the GER determined in the present study may be somewhat under- or over-estimated, respectively (Figure S4).
SGLT1, which is expressed at the luminal surface of the small intestine, mediates the uptake of glucose but not that of FDG50. Glucose excreted into the intestinal lumen may therefore be reabsorbed to some extent by SGLT1. However, metformin was shown to downregulate the abundance of SGLT1 in the intestine47,51, suggesting that the reabsorption of glucose by SGLT1 would be suppressed by metformin treatment. Previous studies have shown that glucose absorption from the intestine is inhibited by buformin52, a biguanide closely related to metformin, in canines and by metformin in humans53. These findings may also be associated with the downregulation of SGLT1.
The current study has several limitations. First, in our animal studies, we used only male mice, and it remains unknown whether sex differences exist in the findings identified. Second, it has been reported that dietary content affects the expression of GLUT2 in the intestine40,54. Therefore, dietary content and the time elapsed since eating may influence intestinal glucose excretion. However, in this study, we only imposed a fasting condition of more than six hours and did not assess dietary intake prior to testing. Finally, we were unable to provide in-depth mechanistic insights into intestinal glucose excretion or its relationship to glucose homeostasis, both of which are crucial for understanding its physiological significance and assessing its potential as a novel drug target.
In conclusion, we have here uncovered a previously unrecognized and substantial glucose flux from the circulation to the intestine and have provided evidence that this flux may contribute to the symbiotic relation between the host and gut microbiota in mice and humans. Whereas new mechanisms for the pharmacological actions of metformin are regularly proposed, the excretion of glucose into the intestine is of special interest in that it’s discovery was triggered by clinical observations9 and it has been characterized largely in humans32. Further studies are warranted to understand the physiological relevance of glucose excretion into the intestine and its contribution to the glucose-lowering effect of metformin.
Responses