Metrology of metasurfaces: optical properties

Introduction
Progress in the conception of planar structured optical interfaces, also dubbed metasurfaces (MS), has been moving at a frantic pace for the last 10 years1,2,3,4,5,6, mainly driven by the perspectives of achieving wafer-level fabrication and integration with optoelectronic systems before dicing the wafer into final chips. As opposed to traditional 3D bulky optical devices, often denoted as refractive optics, metasurfaces are in essence planar devices and can thus be fabricated using tools and equipment traditionally found in semiconductor foundries. Currently the research in passive metasurface, i.e. devices designed with a fixed optical response via patterning of a passive dielectric or metallic film, still relies on electron beam lithography systems that can only insulate relatively small areas of polymeric resists. Yet, two other processes, namely nanoimprint lithography and deep-UV lithography, are today considered for the replication and manufacturing of metasurface at much larger scale7,8. This recent trend in scaling up the manufacturing of metasurface has already started, involving industrial players at different stages of the value chain, which would boost the transfer of this technology from the research laboratories to the market in the coming years9.
If many obstacles and challenges have to be overcome for these initiatives to be successful, including dealing with extensive databases for the conception of metasurface building blocks, the extremely large sizes of the layout files, the respect of stringent fabrication constraints over large areas, maybe the most critical issue remains achieving with fabricated sample the same optical performances expected from the design stage. This requirement has to be satisfied at very high yields, i.e. for every single device among the thousands produced on the same wafer. This is a routine challenge for the semiconductor industry, and several successive and parallel measurements are systematically realized during the manufacturing process to mitigate this issue. Tremendous research and developments aiming at the conception of dedicated tools, detailed methodologies, and specific measurement techniques have been proposed10,11, at every step of the process, to follow and further optimize the fabrication of the components. The analysis of wafers generally follows standards and procedures that have been imposed by national governments to guarantee both the quality and the reliability of the final devices. The name “metrology” is often used to describe the set of standard scientific and device performance measurements performed to ensure conformity of the final instrument. To industrialize and adapt the production to the case of metasurface optical elements, aiming at high yields and effective manufacturing processes, advanced metrology techniques have to be adapted to metasurface characterization. Dedicated metasurface metrology techniques would boost their performances, bringing the technology closer and closer to system integration and industrial applications.
In terms of manufacturing, most of the basic steps relevant to the wafer-scale manufacturing of metasurface are already well-known to the integrated circuits community for a long time, and comprehensive characterization techniques, ranging from the analysis of the metasurface wafer and structural parameters have already been implemented in foundries5,9,12. However, after successfully achieving metasurface fabrication, dedicated optical metrology techniques that can validate the optical properties of the components are still needed. Dedicated optical metrology techniques for metasurface characterization are not necessarily compatible with those used to validate electronic circuits. Some of these solutions, currently being developed by the research community and the industry, are further advancing the reliability and precision of these techniques. These efforts would improve the metasurface technology readiness level, helping access lower production costs and enabling minute optimization. Looking further down the production lines, metasurface integration in systems and complex devices would also require measurements that ensure conformity of the final product, according to the guaranteed specifications. As such, metrology procedures specific to each product are generally developed, not only to validate the device internally but also to convince customers by demonstrating the system’s performance. Metrology and validation tests are thus needed for completed systems as well. In this review, we discuss existing, and recently developed, metrology techniques to characterize the amplitude, phase, and polarization properties of metasurfaces. The first three sections present the metrology methods to separately assess each of these three physical quantities. Each section highlights the physical principles at the core of the measurements of the considered quantity. We first mainly focus on methods that have already been proven effective in the literature for metasurface characterization. In the last section, we share our perspectives and discuss our vision of innovation, both expected and needed in the area of optical metrology. Finally, as mean of completness, we present basic principles of metasurfaces in Box 1. Metasurface is an enabling technology that can provide innovative solutions for the next generation of metrology tools. We foresee that metasurface devices would revolutionize metrology techniques in general, providing single-shot wafer-level simultaneous assessment of multiple functionalities and performances, as well as achieving parallel measurements of multiple devices.

Metasurface amplitude characterization
In this section, we present a detailed discussion on the amplitude characterization techniques employed for metasurfaces, along with a description of the associated measurable quantities. The section is structured into two main parts. The first part addresses general amplitude measurement methodologies, focusing on quantities that are universally applicable to all metasurfaces, regardless of their intended application. The second part treats application-specific amplitude measurements, emphasizing parameters relevant to the operational functionality of the metasurface. Given the breadth of metasurface applications, a comprehensive discussion is beyond the scope of this work. Instead, we exemplify the measurement methods using two representative applications: metalenses and metadeflectors. These devices are selected due to their widespread use and significance in diverse optical systems, including those integrating light sources13 and detectors14.
Common amplitude measurements
Transmission/reflection efficiency
The most significant advantage of metasurfaces over conventional diffractive optical elements (DOEs) is certainly their improved diffraction efficiency, that is the amount of transmitted/reflected light directed into desired diffraction channel. To characterize this quantity, the community uses transmission/reflection efficiency, defined as the ratio between the power transmitted/reflected by the metasurface to the incident power impinging on the metasurface aperture S, i.e. the amount of light passing through a surface of a size equal to the metasurface aperture. Mathematically, the transmission/reflection efficiency η can be written as15
where Pout and Pin are the total power at the output and input of the metasurface, respectively (see Fig. 1a), and can be written as a function of the time-averaged Poynting vectors at the output Πavg(r) and at the input ({Pi }_{avg}^{0}({boldsymbol{r}})).
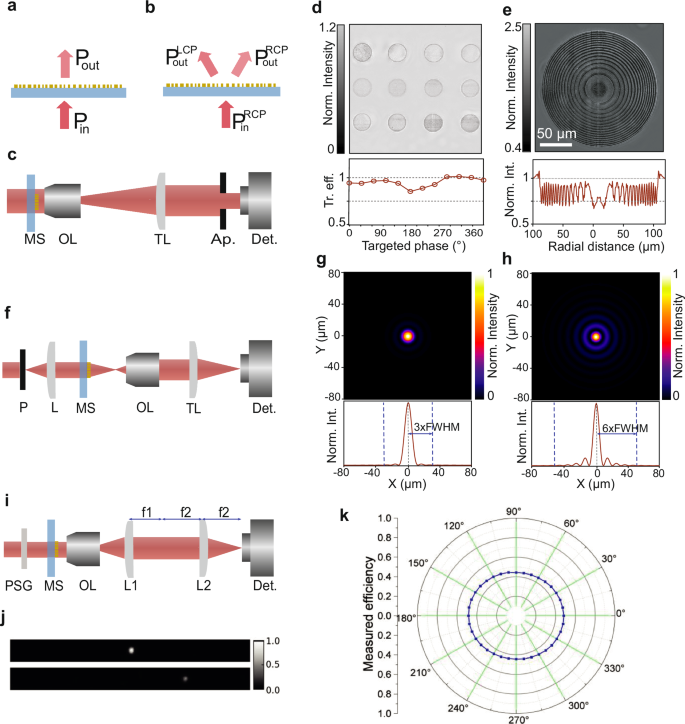
a, b Diagrams showing the incident and transmitted light for metasurface without polarization conversion and polarization converting metasurface (PBP MS), respectively. c Example of optical setup used for the characterization of the transmission efficiency of metasurface. d (top) Normalized transmission image of 12 circular metasurface arrays (30 μm in diameter) made of identical Gallium Nitride (GaN) nanopillars of 1 μm height. The diameter of the nanopillars is different for each array, gradually increasing from left to right and from top to bottom. The diameters are chosen to cover the 2π phase range with an interval of π/6 and (bottom) corresponding transmission efficiencies of the 12 arrays. e (top) Normalized transmission image of a metalens designed according to the conventional lens maker formulae, using the nanopillars previously characterized in (d) and (bottom) radially averaged profile of transmitted intensity of the metalens. (d, e) are adapted from ref. 18 with permission. f Example of the optical setup for PSF measurement of a metalens. g, h Simulated PSF for diffraction-limited and spherical aberrated lenses, respectively (the bottom curves show horizontal profiles of the PSF). i Example of Fourier plane imaging setup for characterization of the far field of a metadeflector. j Far-field profiles of the incident light intensity (top) and deflected light (bottom) captured at the Fourier plane. k Measured deflection efficiency for different polarization directions. (j, k) are dapted from ref. 27 with permission. OL stands for objective lens and TL for tube lens, Ap. for aperture, Det. for detector, P for Pinhole, L for lens, and PSG for polarization state generator.
Measuring the efficiency is quite straightforward when the metasurface size exceeds the optical probe beam diameter. Indeed, for large-area metasurfaces (larger than millimeter scale), a power meter is usually used to detect the power of the transmitted/reflected beam as well as the incident power. As simple power meters cannot provide spatially resolved information, the measured power corresponds to the spatially integrated signal across the entire beam size. When dealing with smaller area metasurfaces, i.e. of micrometer dimension, the optical probe beam is generally wider than the metasurface aperture. Proper characterization requires imaging the device and selecting the signal transmitting or reflecting from the metasurface apertured region only. The transmission/reflection efficiency has to be estimated by calculating the ratio between the power reaching the detector with and without the metasurface. However, in comparison with the large metasurface case, it is necessary to physically delimit the observation area using an aperture positioned at an intermediate magnified image plane, cf. Fig. 1c. It is also possible to do this measurement using a CCD by taking images of the aperture, with and without the metasurface, and running a numerical post-processing normalization step. Efficient metasurface design requires co-optimizing of both transmission/reflection efficiency and the phase response of each building block as a function of structural parameters to generate a so-called lookup table (LUT). The LUT is generally composed of elements with different phase levels presenting the highest transmission/reflection efficiency. To achieve an ideal metalens design, these LUT elements are spatially arranged to match the desired lens phase profile. The LUT element optical properties are generally obtained using time-consuming full-wave numerical simulations of a single building block with periodic boundary conditions, therefore neglecting or misrepresenting possible near-field interaction between different adjacent elements15,16,17. In addition, the design process does not usually consider the whole metasurface device with varying geometrical parameters, responsible for transmission/reflection efficiency reduction, and discrepancies to the simulated devices.
Besides classical intensity input/output power measurements, it is possible to further characterize the spatial variation of transmission and/or reflection of a component by imaging the aperture plane on a simple camera, as shown in Fig. 1d, e. These measurements present normalized intensity carried out on uniform meta-unit areas, as in Fig. 1d as well as a metalens fabricated using the calculated meta-units LUT, in Fig. 1e18. For the uniform areas, the normalized intensity, plotted in the bottom panel of Fig. 1d presents a variation around 10% maximum. However, one can see a non-uniform intensity distribution over the surface of the metalens in Fig. 1e, which is further confirmed after calculating the radially averaged profile shown in the bottom panel of Fig. 1e. The intensity variation across the metalens radius varies around 25% exceeding the maximum variation measured in the case of uniform meta-unit arrays.
Conversion efficiency
Efficiency of Pancharatnam–Berry phase (PBP) metasurfaces, presented in Box 1, depends mostly on the polarization conversion efficiency. The PBP is a geometric phase. Each building block acts as a half waveplate, with the difference that each element composing the PBP metasurface is subwavelength in size, and all elements are spatially distributed on the surface at subwavelength distances. The PBP occurs when converting from one circularly polarized handedness to the other. Two identical adjacent elements impose a different local phase delay on the converted polarization beam equal to twice the relative orientation angle between the two considered elements. Therefore, the conversion efficiency is defined as the ratio of the power of the light in the converted polarization channel (({P}_{{rm{out}}}^{{rm{LCP}}}) for example) divided by the total transmitted power (({P}_{{rm{out}}}^{{rm{LCP}}}+{P}_{{rm{out}}}^{{rm{RCP}}}))15,
A schematic representing the quantities of Eq. (2) is shown in Fig. 1b. Similarly to transmission/reflection efficiencies, these measurements can be realized using similar setups as the one depicted in Fig. 1c, at the difference that quarter waveplates, a polarizer, and an analyzer are added to also select the measured incident and transmitted polarization states.
The Transmission/reflection and conversion efficiencies are direct measurements, thus, their precision is mostly dependent on the alignment of the optical setup as well as the quality of the different optical components. In the case of small-area metasurfaces, the efficiency measurements require magnifying the components, which may introduce sources of errors due to the alignment, including the alignment precision of the aperture position to fit the numerical aperture of the metasurface, the detection tool (power meter, camera…), etc. To facilitate comparison between different results in the literature, the optical setup used for the measurements, as well as the characteristics of the optical components, should be systematically reported.
Specific amplitude measurements
Beside transmission, reflection, or conversion efficiencies, many other quantities can be measured to characterize metasurface devices according to their final functionality, including focusing, deflection, and for example the holographic image projection efficiencies.
Metalens properties
In the case of a metalens, which is a metasurface designed to function as a lens, two critical properties need to be characterized: the resolution and the signal-to-noise ratio (SNR). The resolution is usually defined as the full width at half maximum (FWHM) of the point spread function (PSF). The PSF is the intensity profile at the focal plane of the metalens when it is illuminated with a point source. In practice, a collimated beam is sent on a pinhole with a sufficiently small diameter (defined by the characteristics of the magnification system and the metalens, see ref. 19) to mimic a point source, as shown in Fig. 1f. Recent publications pointed out the limitations of using the FWHM of the PSF as a resolution metric since the aberrations influence more the sidelobes of the PSF rather than the diameter of the central lobe20,21. The suggested solution is to use the modulation transfer function (MTF) as it is related to the Fourier transform of the PSF which accounts for all the information contained in the PSF and not only the central lobe.
The SNR is generally characterized by measuring the focusing efficiency, which is determined as the fraction of the incident power focused at the focal plane of the metalens. The power at the focal plane is typically measured using a physical aperture, such as an iris with an adapted diameter. However, reported data in the literature used sometimes arbitrary radius ranging from 3 × to ≥18 × the full-width at half-maximum (FWHM) of the focal spot, and sometimes with no iris at all, as discussed herein22. Moreover, the flat lens community disagrees with the relevance of using focusing efficiency since another parameter exists already, which is the so-called diffraction efficiency. The latter is defined as the fraction of the incident light that goes to the design order. While some reported works confirm that these two parameters are different23, others claim that they are equivalent20. The difficulty lies in estimating correctly the fraction of light that goes in the desired order. For a diffraction-limited lens, this corresponds to the light contained in the area equal 3 × FWHM (see Fig. 1g). In the case of aberrated metalens, the light is spread on a larger area, which in principle imposes to adapt the collection area. A simulated PSF for a lens with spherical aberrations is shown in Fig. 1h illustrating the fact that a larger collection area is needed (6 x FWHM in this case). In conclusion, these measurements require specifying the collection area for the SNR measurements and performing a resolution measurement to separate the two effects.
It is worth noting that, besides aberrations, the stray light contained in the unwanted orders weakens the resolution due to contrast reduction at low spatial frequencies. In practice, it is very difficult to take into account this effect in MTF measurements since the PSF is often truncated due to the limited field of view of the magnifying system (to ensure high spatial sampling for the PSF)20,22. A way to take into account the stray light is to estimate the ratio of the focusing (or diffraction) efficiency to the overall transmission of the metalens20,24.
Deflection properties
Another application of metasurfaces is beam deflection. A metadeflector can deviate light to any desired angle. Its characterization encompasses usually the determination of the deflection angle as well as the deflection efficiency. The latter is defined as the ratio between the power in the desired order and the overall transmitted power in the other orders. Two methods can be used for the experimental characterization, namely the direct measurements and k-space measurements.
-
For direct measurements, a photodetector is fixed on a rotating stage and captures the light transmitted by the metadeflector at different angles,25,26. This measurement method requires precise optical alignment to avoid estimation errors of the deflection angle, that is to perfectly position the metadeflector at the rotation axis of the detector and to properly align the metasurface plane perfectly perpendicular to the normally incident beam direction (θi = 0 in the plane of incidence). In addition, a sufficiently large detection area at the detector plane is needed to catch the entire cross-section of the beam spot.
-
For k-space measurements, a Fourier space optical microscope is used. It consists of a conventional optical microscope scheme (objective lens + tube lens) for which an additional lens is used to re-image the Fourier space (or k-space) on a camera. The measurement setup as well as examples of the measurement results are shown in Fig. 1i–k27. In this configuration, the choice for the lenses is crucial, and in particular for the objective lens requiring a high numerical aperture to collect all the transmitted orders and avoid over-estimation of the deflection efficiency. The above-mentioned method can also be used for poly-chromatic measurements by replacing the camera with the entrance slit of a spectrometer. One can get the angular information dependence as a function of the wavelength28.
It is worth noting that the same methods are used to characterize meta-hologram projection efficiencies since the holograms are usually encoded in higher diffracted orders (different from the zero-order)29,30. The zero-order is generally avoided because the remaining unwanted light could interfere with and affect the performance of the metasurface. This issue is common for most metasurfaces, particularly for diffraction-related applications. To address this issue, considerable efforts have been made to reduce the zero-order light. Notably, studies such as ref. 31 and ref. 32 have proposed approaches to eliminate or minimize the zero-order at the design stage. Even with optimized design methods, the zero-order is not completely suppressed but reduced to 0.7% of the useful light31. However, it is crucial to recognize that zero-order light primarily originates from fabrication imperfections and dispersion. In addition to zero-order contribution, other sources of noise such as the scattered light from defects and imperfections can reduce the performances of the metasurface. Similar to metalenses, metrics related to both signal-to-noise ratio (SNR) and resolution are required to effectively characterize these devices. Existing metrics for classical optical components can be adapted to meet the specific needs of metasurfaces.
For diffraction-related metasurface applications, measurement parameters traditionally employed for classical gratings, which are well-established and routinely used in industry33, can be applied. Regarding SNR, key properties include diffraction efficiency (defined above) and stray light, which corresponds to the background light present between diffraction orders. For metadeflectors, the measurement procedure is very similar to classical gratings, where the intensity between diffraction orders is recorded and normalized relative to the desired order’s intensity34,35,36. In the case of meta-holograms, the background light intensity must be evaluated in regions intended to remain completely dark37.
Resolution can be assessed using two parameters: angular resolution and image quality. Angular resolution pertains to measuring the diffraction angle and any deviations from the design specifications. Image quality, primarily relevant to holography, concerns the intensity distribution within the projected image37. Notably, most metasurface-based holograms in the literature are proof-of-concept demonstrations, often lacking rigorous quantitative analysis with clearly defined parameters.
The optical properties outlined above pertain to the specific examples discussed in this section. Establishing universal optical metrics for all metasurfaces is inherently challenging due to their diversity. However, considering the growing maturity of metasurface technology and its potential for industrial adoption, it is essential to define and standardize parameters and measurement methods tailored to each metasurface application.
Metasurface phase characterization
A core application of metasurfaces is to engineer the wavefront of light relying on abrupt phase shifts introduced by the building blocks. Thus, being able to accurately characterize the effective phase shifts after fabrication is mandatory. However, the inherent subwavelength spacing between the LUT elements brings additional challenges yet to be tackled by the community.
Direct measurement of the spatial phase distribution is impossible with any photo-detector since it provides information on the intensity only. However, there exist several ways to extract phase information from intensity measurements. These methods can be divided into two categories: (i) interferometric methods, inferring the phase profile from interference patterns of several beams, and (ii) phase retrieval methods, reconstructing the phase profile based on the evolution of the spatial intensity distribution through beam propagation and diffraction.
Contrarily to other physical quantities, phase is a quantity defined relative to a reference and could be wrapped modulo 2π, creating ambiguity in the measurement. In the context of metasurfaces, the phase profile is wrapped due to the inherent design by the building blocks. Therefore, in the following, we are not dealing with the problematic of phase unwrapping algorithms38.
Intensity interferometry
Intensity interferometric methods consist of creating interferences with at least two beams to deduce the phase information of the light beams directly through the interference pattern. To illustrate the basic principle we consider the complex amplitudes, E1 and E2, of two coherent scalar electric fields propagating along the z − axis
and interfering on a photodetector. The interference pattern I(x, y) at the detector plane, resulting from the superposition of the two fields, can be written as
with Δφ(x, y) = φ2(x, y) − φ1(x, y) the phase difference between the two fields. Said differently, the interference pattern contains the relative phase information between the two beams. Assuming that the spatial modulation of amplitudes is slower than the spatial modulation of phase, i.e. Ai(x, y) ≈ Ai, we can deduce the phase difference Δφ between the two beams by a measure of intensity. Interferometric methods can be separated into two categories, (i) reference beam interferometry, consisting of using a well-known beam, i.e. a light beam with a known phase profile, to interfere with the one passing through or reflecting from the metasurface, and (ii) shearing wave interferometry, which instead relies on measuring the self-interference from a single beam transmitted (or reflected) by the metasurface.
Reference beam interferometry
The Michelson interferometer is certainly the simplest and the best-known apparatus using the reference beam interferometric method for quantifying the phase of a light beam. This technique, which requires using a light source with relatively large temporal coherence, is currently used in various applications39,40,41. Reference beam interferometry relies on splitting a coherent monochromatic beam into two coherent constituents, which are often reshaped to behave as plane waves. One beam is used as a reference, while the second probes the metasurface. The two beams are then recombined onto an optical sensor. A basic reference beam interferometer is shown in Fig. 2a. An example of using Michelson interferometry for metalens characterization is shown on the right panel of Fig. 2. Rewriting Eq. (4) by denoting the electric field of the light passing through the metasurface as A1 = t1A/2, and A2 = t2A/2 the electric field of the reference beam, we get
where t1 and t2 are the transmission coefficients of the light propagating in each arm, and φm(x, y) and φref(x, y) are, respectively, the phase profiles of the transmitted beam through the metasurface and the reference beam. Note that because the coefficient t1 is not always unitary, for example, due to the magnification and/or non-unitary transmission of the metasurface, the transmission t2 can be adjusted on the reference path to improve the contrast of the interference pattern42,43. Measuring the intrinsic phase difference between the two beam paths, that is in the absence of the metasurfaces, it is possible to recover by simple subtraction the exact metasurface phase profile φm(x, y). A calibration step is required to cancel any spatial variation in the reference phase term φref(x, y), as well as other aberrations. In addition, for Eq. (5) to be valid, the amplitude modulation introduced by the metasurface should vary slowly in comparison to the metasurface phase modulation.
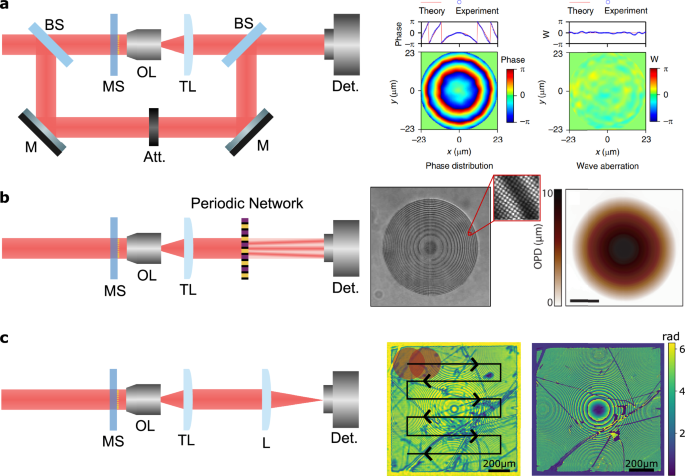
a Left side: schematic of a basic reference interferometry system with two beam splitters (BS), an objective lens (OL) and tube lens (TL) for the microscopic system, two mirrors (M), and an attenuator (Att) for the reference arm. Right side: Phase measurement of a metalens measured with reference interferometry and its aberrations. Adapted from ref. 42 with permission. b Left side: shearing interferometry or common path setup. Right side: Example of interferogram measured with QLSI and its associated optical path difference. Adapted from ref. 18 with permission. c Ptychographic system. Left side: schematic of the optical set-up for optical ptychography on a classical measurement. In the center: illustration of the scan beam illumination on the metasurface. Right side: Reconstructed phase of a metalens with ptychographic method. The device used for this demonstration has intentionally been scratched, adding additional complexities and irregularities on the metalens profile to test the performance of the reconstruction algorithm. Adapted from ref. 76 with permission. For optical components abbreviations, refer to Fig. 1.
Concerning precision, the spatial resolution of the phase measurement is mostly limited by the imaging system resolution. However, the precision of the phase measurement is instead limited by the accuracy of the intensity measurement. The visibility of the interferometric intensity pattern, also known as fringe contrast, follows a sinusoidal evolution as a function of the phase difference, which limits the phase resolution accuracy near maxima and minima. To address this issue, two main strategies have been developed in the literature. The first involves phase-shifting interferometry, which entails introducing a phase shift in the reference arm and performing multiple measurements. This spatially uniform phase shift adjusts the positions of intensity maxima and minima in the interferogram, enhancing the accuracy of phase reconstruction44. The second strategy involves using an off-axis interferometer. The interferogram contains a spatial frequency, related to the angle between the two axis beams and carrying the phase modulation information. By using Fourier transform and isolating this frequency, we can extract the phase with an inverse Fourier transform45,46. Moreover, phase resolution is extremely sensitive to noise and alignment coming from the mechanical system and air disturbance asymmetry between the two arms. However, it is possible to estimate these time-dependent fluctuations by employing multiple measurements and/or correction algorithms47. When using different wavelengths, realignment of the setup is required due to the well-known chromatic aberration in refractive optics and/or the need for complex corrective optics. Aside from the advantage of reaching high spatial resolution, this method enables relatively fast numerical computation of the phase. This is an advantage for real-time phase acquisition at a relatively low cost.
Shearing interferometry
Conversely to the previous characterization method, shearing interferometry does not use a reference beam. After passing through the metasurfaces, the light beam is replicated and interferes on a sensor to produce a multi-beam self-interference pattern. An example of shearing interferometry setup is shown in Fig. 2b. This concept was first proposed by Zernike48 and later developed by Nomarski49. Initially, it was used for qualitative measurements, to observe transparent biological samples. With advances in imaging techniques and the emergence of CCD sensors, shearing interferometry has been extended to quantitative measurements50.
Since the interfering beams are originating from the same wavefront, the measured phase in this case is relative. To illustrate the measurement methodology, we consider two beams, E1 and E2, laterally shifted by a spatial distance Δx,
Similarly to Eq. (4), we obtain
where ({I}_{x}^{0}(x,y)=A{(x-Delta x/2,y)}^{2}+A{(x+Delta x/2,y)}^{2}) and ({I}_{x}^{1}(x,y)=2A(x+Delta x/2,y)A(x-Delta x/2,y)). Equation (7) indicates that the quantity measured, i.e. the interfered intensity pattern, is related to the spatial derivative of the phase along the x-direction and not directly the phase (as it is the case for reference beam interferometry). A numerical integration is needed to retrieve the phase of the incoming beam. For the sake of clarity, we have considered here only shearing along one direction (x). To reconstruct the full wavefront, another derivative along the y-direction is required. It is obtained similarly by shifting the beam along the y-direction. To avoid intensity modulation, the replicas are often tilted by a small angle, which results in adding a periodic intensity modulation, i.e. a carrying spatial frequency that encodes the phase information. Full wavefront sensing with shearing interferometry requires measuring the intensity patterns of at least three self-interfering light beams51. This is called multiwave lateral shearing interferometry (MSLI). When four replicas are considered, the approach is referred to as quadriwave lateral shearing interferometry (QLSI)18,52,53, cf. Fig. 2b. The incident plane wave is diffracted into 4 orders, 2 along x and 2 along y. The interference between the 4 orders results in a 2-dimensional interference pattern called interferogram. Any tilt on the incoming wavefront, which can be decomposed as a tilt along x and a tilt along y, results in a proportional shift of the interference pattern along x and y. Extracting the local shift of the intensity maxima on the interferogram pattern along these two directions is used to recover the modulated wavefront of light transmitted across phase-modulating metasurfaces. An example of interferogram and the corresponding optical path difference (OPD) of a metalens is shown in Fig. 2b(right)18.
These devices fall into the family of wave-front sensors. Historically, the first demonstration of such instruments was called the Hartmann test, which soon used a simple 2D periodic grid of holes, the so-called Hartmann mask. One of the most known wavefront sensors is the Shack-Hartmann sensor (SHS). This technique incorporates an array of microlenses, positioned in front of a CCD at the microlens focal distance. SHS can be considered as a refined version of the Hartmann mask and naturally falls into the multi-wave lateral shearing interferometry classification54. In practice, SHS measurements are not analyzed using this formalism. Each lens samples a section of the incident wavefront and focuses it onto a spot on the camera sensor. Using the linear relationship between the displacement of the focal spot from the center of the microlens optical axis with the local tilt of the wavefront, it is possible to reconstruct the overall phase profile of the incident beam impinging on the microlens array.
The shearing interferometry method has several advantages compared to reference beam interferometry: (i) it is more compact, as the beam splitting apparatus can be positioned very close to the sensor and can be easily integrated on conventional microscopes, (ii) it is less sensitive to beam alignment and ambient noise, simply because all interfering beams are originating from the same wavefront, (iii) it is compatible with large bandwidth sources and hence avoids speckled noise, (iv) its dynamic range is much larger and is tunable because it primarily measures the wavefront slopes. Some drawbacks of this method related both to software and hardware should be mentioned. Shearing interferometry wavefront reconstruction uses an additional calculation of the derivative of the intensity pattern, and as such, any local measurement error could compromise the wavefront reconstruction capability. However, since the derivative information is redundant, local errors are partially compensated. In addition, shear plates or diffracting layers used in shearing interferometry require precise alignment and fabrication. Also, chromatic effects and natural light dispersion must be considered, at both the design and manufacturing stages of the diffracting plates or after the acquisitions using proper data processing and analysis.
Phase retrieval methods
Diffraction theory tells us that by knowing the field distribution of light, amplitude, and phase, at a given plane, it is possible to determine the field distribution in the far-field55. Conversely, simply measuring the intensity distribution at a given plane is not sufficient to recover the original wavefront because of the lost phase information. Measuring the intensity profile only creates ambiguity and forbids direct wavefront reconstruction. Said differently, two different wavefronts can have the same intensity pattern in the far-field. Phase retrieval methods exploits the fact that the initial optical information, carried out during propagation, produces different, but correlated, intensity patterns. Two of such relevant phase retrieval methods have successfully been used for the characterization of metasurfaces : (i) transport intensity equation, obtaining phase profile of the metasurface by analyzing the deformation of the intensity of the transmitted beam through its propagation; (ii) ptychography, extracting the phase profile of the metasurface by successive illuminations of sub-areas of its surface.
Transport of intensity equation
The transport of intensity equation (TIE) methods recover the phase profile by exploiting the deformation of the wavefront during propagation. It was first proposed by Teague56 as a simple way to determine the phase of defocused intensity images. Similarly to reference beam interferometry, this method is known in the community57,58 and is still improving59. Considering a monochromatic wave in freespace with intensity I and phase φ, in the paraxial approximation, it satisfies the so-called transport of intensity equation56
where ∇⊥ is the transverse Laplacian. In other words, the variation of the intensity along the z-direction, as indicated on the left-hand side of the equation, can be expressed in terms of variation of phase and intensity in the transverse plane on the right-hand side. Equation (8) is solved for the phase φ, where the intensity I and its derivative ∂I/∂z are known by acquiring intensity measurements at different planes z. At least two intensity measurements are necessary to estimate ∂I/∂z. Several TIE solvers have been developed to solve Eq. (8) using Greens’s function method56, multi-grid methods60,61, Zernike polynomial methods62 or fast Fourier transform solver(FFT-solver) methods63,64. For example, a common FFT-solver used for TIE comes from Paganin and Nugent64 and relies on coherent illumination and requires the absence of optical singularity.
The precision of the phase φ is directly affected by the estimation of the longitudinal derivative of the intensity. In fact, the noise level on the camera sensor can heavily affect both intensity measurements. Therefore to minimize the error on the phase determination, it is necessary to minimize the error on the derivative estimation. By using more intensity measurement at different planes z and/or adjusting the distance between those measurement planes, the accuracy of the estimated ∂I/∂z can be improved. For three measurements, an exact separation distance δz can be derived to obtain noise robust measurements following a dependence δz ∝ σ1/3 with σ the noise level65. Moreover, for n different measurements, the variance on the derivative varies in n−1/3, showing that larger set of measurements increases the precision of the phase measurements66.
Since this problem involves spatial derivative of the phase, boundary conditions are necessary at the edge of the measured intensity maps. Although these conditions are often not well-known, in the case of metasurfaces, which are typically fabricated in a finite area on a larger substrate, these conditions are trivial: the amplitude and phase of the field outside the metasurface can be considered as constant.
Typically, an imaging system is translated along the optical axis, acquiring intensity images in different planes, and effectively recreating a 3D image of the propagation. Alternatively, the object can be translated along the optical axis with a fixed imaging system. Designated optical systems have been proposed to acquire simultaneously multiple images at different planes, enabling TIE with single acquisition67,68, opening new opportunities for real-time phase imaging69.
In terms of equipment, TIE requires a simple imaging system and means to translate the camera or the object over short distances. The spatial resolution is limited by the camera resolution and rigorous alignment of the translation axis along the beam propagation axis is needed.
Ptychography
Ptychography retrieves the phase information from different far-field intensity patterns generated by local and sequential illumination of the sample. In this setup, the object and imaging planes are fixed, only the illumination is translated, generating a different set of far-field patterns for each of its positions, cf. Fig. 2c. Ptychography is a method for quantitative phase measurement that uses a conventional imaging system along with computational algorithms, dubbed ptychographic iterative engines (PIE)70,71. In contrast to direct methods like TIE, ptychography is an algorithmic iterative method. The method can be divided into 2 steps: (i) the far-field patterns acquisition followed by (ii) the phase reconstruction via a convergence algorithm.
In the first step, an aperture mask is placed in front of the surface to partially illuminate the metasurface, i.e. the aperture is smaller than the dimensions of the metasurface. The far-field intensity generated by the illuminated sub-area of the metasurface is recorded by a camera positioned at the metasurface Fourier plane. Noting g(r), the transmitted field by the whole metasurface, then the far-field intensity of the illuminated sub-area is the convolution product of ψ(r) by the transmittance t(r) of the aperture at position rj,
where ({mathcal{F}}) stands for the Fourier transform and k the coordinate of the reciprocal space. The operation is repeated several times at different positions rj to generate a large set of far-field intensity measurements Ij. As mentioned previously, phase retrieval methods rely on the strong correlation between different intensity measurements to extract phase profiles. Therefore, in the case of ptychography, correlation is achieved when there are significant overlaps between illuminating sub-areas, as indicated schematically in Fig. 2c. An overlap of 50% at least is required and a maximum phase accuracy is reached when the overlap is close to 85%72.
In the second step, the algorithmic part, the set of measurements Ij is fed to the PIE to extract the phase profile of the metasurface. Fundamentally, it is an optimization problem whose solution is found by minimization of a defined quantity. In alternating projection algorithms, or iterative Fourier-transform algorithm, this quantity is the distance between the measured intensities Ij and a computed one ({tilde{I}}_{n,j}) at each position rj and iteration n73. At each iteration, a set of constraints is applied to the computed complex field ({tilde{I}}_{n,j}) in order to correct the difference with the measurement. However, these methods does not guarantee convergence to a global minimum74 and the problem is said to be non-convex. Therefore, reformulation of the phase retrieval problem have been proposed in order to use convex optimization algorithm75.
Ptychography enables retrieving precise phase measurements, as shown in the right part of Fig. 2c, even when considering very damaged metasurface devices76. For the reconstruction of a high NA metasurface component, ptychography requires using a very precise imaging system composed of a Fourier lens and a precise translation stage, or precise beam scanning method, to properly crop the object plane. One way to optimize the measurement is to match the NA of the imaging system with the size and resolution of the intensity sensor used to detect the far-field profile. In addition, several algorithms can enhance the precision of the reconstructed wavefront, such as incorporating position correction77 or probe beam correction78. Since the intensities obtained for each illuminated sub-area have the resolution of the camera, each cropped wavefront reconstruction area will have the same resolution. As a result, the final resolution of the full object can exceed the camera resolution. The main limitation of ptychography is the computational time, with convergence time which could easily exceed several hours depending on the parameters of the measurement (resolution and size of the camera, size of the sample, step between different measurements…), making real-time measurements impossible, as opposed to TIE. Moreover, the amount of recorded data can quickly become substantial.
An alternative approach to lateral scanning is to employ iterative algorithms with multiple measurements along the optical axis79. This method begins with an initial estimate of the complex amplitude at the measurement plane. Multiple forward propagations are then computed over different distances. In each iteration, the simulated amplitude is replaced by the experimentally measured amplitude, taken as the square root of the measured intensity. Following this, a backward propagation is performed, and the resulting set of complex amplitudes is averaged to update the initial guess for the next iteration. This loop is repeated until convergence of the computed complex amplitude is achieved.
Metasurface polarization characterization
By appropriately engineering the geometries of the building blocks, metasurfaces have been developed to flexibly control light polarization, demonstrating a wide variety of concepts80,81 ranging from vectorial holography, polarization filtering to polarization-multiplexing functionalities. Polarization control is essential for many applications such as material inspection82, bioimaging83, optical communications84. Due to their integration and miniaturization capabilities, metasurfaces could substitute bulk and heavy conventional components. Consequently, to meet industrial requirements, polarization-engineering metasurfaces must be quantitatively compared with conventional components.
The state of polarization (SoP) of light is characterized by three quantities, the degree of polarization (DoP) that quantifies the amount of polarized light, the ellipticity χ, and the angle of polarization α. Therefore, a SoP can be represented as a 3D vector in the Poincaré sphere as represented in Fig. 3a. The four Stokes parameters, ({boldsymbol{S}}={[{S}_{0},{S}_{1},{S}_{2},{S}_{3}]}^{{mathsf{T}}}), are quantities determined by a set of intensity measurements that allow retrieving the SoP parameters via the relationships55
Traditionally, the four Stokes parameters are determined with six measurements of intensities associated with the six polarization states: four intensity measurements obtained by filtering the linear polarization at the angles (α, χ) = (0, 0), (π/4, 0), (π/2, 0), (3π/4, 0) and two measurements of the circular polarization (0, π/2) and (0, − π/2)55. It is possible to improve the resolution of the polarization by performing n intensity measurements ({boldsymbol{I}}={[{I}_{0},…,{I}_{n}]}^{{mathsf{T}}}) corresponding to n pre-defined polarization states85,86,
where W is the measurement matrix, with size n × 4, and Δ is the additive noise. Two types of noise can interfere with the precision of the measurement, additive noise Δ and Poisson noise, for which I is random and its components are random variables following a Poisson law87. In both cases, the estimated Stokes parameters are obtained by (hat{{boldsymbol{S}}}={W}^{+}{boldsymbol{I}}), where the superscript “+” denotes the pseudo-inverse. In practice, a minimal number of 4 different pre-defined states are necessary to obtain a complete polarimeter. A polarimeter is considered optimal, if, for a set of n measurement states, the variance in the estimated Stokes parameters is minimized85. This minimization requires defining a figure of merit of the polarimeter:
where EWV stands for “equally weighted variance”, Tr for trace, and σ2 the variance of the noise. It has been shown that to minimize the EWV, the measured polarization states should form polyhedra with its n vertices regularly positioned on the Poincaré sphere87,88, cf Fig. 3b. Other known figure of merits, such as the condition number of the measurement matrix W, have been showed to be equivalent to the EWV89. For an optimal polarimeter with 4 or more (except 5), the EWV is inversely proportional to the number of SoP n of the polarimeters, EWV ∝ 1/n90, meaning that the more SoP is used in the polarimeter, the more precise is the determination of the SoP of the analyzed light.
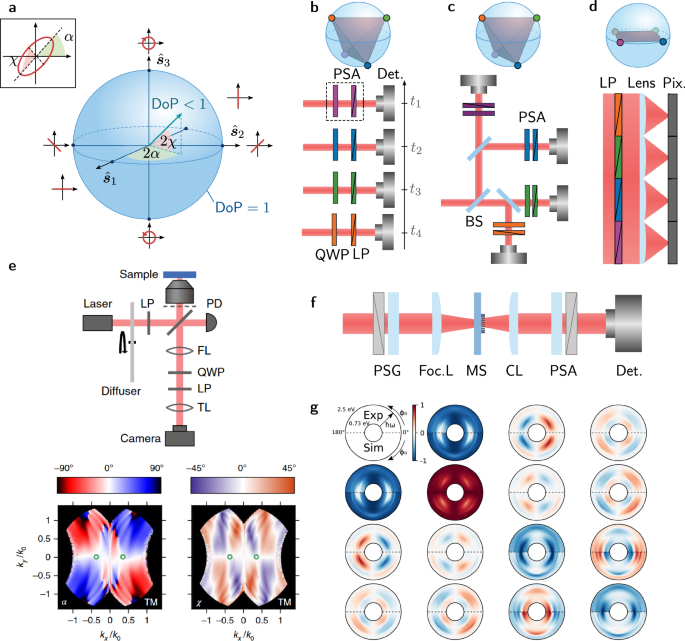
a Polarization representation using the Poincaré sphere and definition of the polarization ellipse parameters. b Schematic of division-of-time setup consisting of a single detector (Det.) and PSA but where measurements are done consecutively after adjusting the PSA to designated SoP. c Schematic of division-of-amplitude setup. A beam is splitted in four by beam-splitters (BS) and each beam is analyzed by a different PSA. d Schematic of division-of-wavefront setup in the case of a linear polarimetric camera. The wavefront is spatially divided and analyzed by linear polarizers (LP), then each division is focalized on a pixel. Each measured SoP is represented on the Poincaré sphere with color-coded associated with its respective PSA. e Angle-resolved polarimetric characterization setup and measurements of polarization SoP for a metasurface exhibiting a bound state in the continuum. Adapted from ref. 97 with permission. The BICs are represented by the green circles. f Schematic of a Mueller matrix characterization setup. g Spectroscopic ellipsometry measurements of the Mueller matrix elements of a gold nanoparticles metasurface. Adapted from ref. 114 with permission. QWP stands for quarter wave plate, LP for linear polarizer, PD for photodetector, BS for beamsplitter, FL for Fourier lens, TL for tube lens, CL collection lens, Foc. L focalization lens, PSG polarization state generator.
Polarimeters can be classified according to their measurement techniques and extensive information can be found in the literature91,92,93. The concept of division-of-time polarimetry has been proposed to describe the sequential acquisition of the intensity profile. The classical polarization state analyzer (PSA) consists of a waveplate and a linear polarizer to filter the four states of polarization necessary for the Stokes parameters94. Noting that rotating only one of the two above-mentioned PSA components does not satisfy the optimal polyhedra configuration, simply because the measured polarization would only span a circular trajectory on the Poincare sphere. Therefore, at least two polarizing components must be re-oriented95. Recently k-space polarimetry was proposed96 by encompassing the PSA between a Fourier lens and tube lens, cf Fig. 3e (top panel). This technique was notably used to image polarization vortex of bound states in the continuum97 with 0.5∘ angular resolution as shown in Fig. 3e (bottom panels). The vortices of polarization can be observed when the ellipticity and angle of polarization are simultaneously zeros. In the division-of-time polarimetry, consecutive sequences of intensity measurements In are taken, and increasing the number of measurements thus increases the precision of the SoP. This technique is widely used to characterize the SoP after a metasurface30,98,99,100, but it might not be suitable for applications such as imagery or industrial applications where high-speed measurement is required. Another issue associated with using a waveplate in the PSA is that it makes the characterization setup chromatic. The waveplate can be replaced with a linear grating polarizer101. The latter works by conserving the polarization on the 0th order whereas the ±1th orders are separated, in opposite propagating directions, based on circular polarization with opposite helicities. After analyzing the diffracted beams with a linear polarizer, this technique can retrieve the Stokes parameters at several wavelengths.
The second polarimetric method is called division-of-amplitude. It achieves simultaneous acquisition of the Stokes parameters by simply dividing the beam to characterize it into multiple beams, which are analyzed separately, cf. Fig. 3c. A typical example, developed by Azzam102,103,104, achieves four simultaneous measurements by splitting the beam using a beamsplitter and two Wollaston prisms. Each of the four light beams is analyzed after passing through four fixed linear polarizers. Division of amplitude polarimeters have also been integrated with ellipsometers to realize Mueller matrix determination105 with a single acquisition. Since no polarizing elements have to be rotated, this approach increases the acquisition speed but at the expense of the limited number of subdivisions of the amplitude.
The method, called division of wavefront polarimeters, is similar to the division-of-amplitude methods described above. It also works by splitting spatially the wavefront of the light to be analyzed and treated separately. The difference is that the splitting and measurements are realized several times across the wavefront, at multiple locations. A subclass of these polarimeters consists of dividing the overall wavefront with an array of lenses and analyzing each output with one or several photodetectors. This is referred to as division-of-aperture polarimeters106,107. When a subdivision of the wavefront is focused on a single pixel by a microlens, the method is referred to as the division-of-focal-plane method, cf. Fig. 3d. The advantage of this type of polarimeter is its compactness, using only a single photodetector, and the simultaneity of the acquisition. This class of polarimeters is particularly interesting in the context of metasurfaces as it allows polarimetric imaging, i.e. spatially-resolved polarimetry. However, due to the difficulty of compactly filtering a given state of circular polarization, polarimetric cameras are often referred to as “linear”, as they only allow the analysis of states corresponding to the equatorial disk of the Poincaré sphere. The wavefront subdivision is often realized in a Bayer scheme, mimicking the RGB pixels design for polarization filtering as well. To realize full Stokes imaging, the retarders must be integrated to the system. A single rotating retarder can be placed in front of the system, and then at least two acquisitions have to be made with two different retarder configurations to reconstruct full Stokes vectors108. A minimal EWV can be obtained with at least three acquisitions and a single rotating waveplate with retardance 125.26° in the presence of both additive white noise and Poisson noise109.
In the previous discussion, we considered measurements of the SoP of totally polarized light. For partially polarized light, the determination of the SoP relies on the formalism of the Mueller matrix M, a 4 × 4 matrix, which quantifies the polarization conversion of an optical device Sout = MSin92. To probe each element of the Mueller matrix, the instrument is composed of a polarization state generator (PSG) which sets the SoP of the light going through the sample, followed by a PSA. In110, both PSG and PSA comprehend a linear polarizer and two photo-elastic modulators. Using this setup, they determined k-space mapping of the Mueller matrix elements of nanostructured thin metal films111. Using Mueller matrix ellipsometry, complete properties of a plasmonic metasurface, i.e. phase shift, transmission, and polarization, were characterized112. In ref. 113, the 16 coefficients of the Mueller matrix elements of a polarization-splitting metasurface are measured using spectroscopic Mueller matrix ellipsometry, cf Fig. 3f, showing that over a thin spectral bandwidth, the different polarization engineered by the metasurface is relatively pure with a DoP superior to 0.95. Arrays of gold nanoparticles under oblique incidence were also investigated using Mueller matrix ellipsometry114. The advantage of Mueller matrix ellipsometry is the quantity of information gathered on the metasurfaces, which combined with additional modeling could be used to determine the properties of the metasurface in phase and transmission, and could be used as a metrological tool for the determination of the critical dimension of the meta-atoms.
For industrial applications, it is crucial to establish well-defined figures of merit to specify the performance criteria of metasurfaces and to determine their acceptable tolerances. For example, in the context of fiber optics, the polarization extinction ratio serves as key parameter, quantifying the ratio of power in the desired polarization to that in the orthogonal (cross) polarization. Our literature review indicates that polarization-dependent metasurfaces are often assessed qualitatively using a rotating polarization-state analyzer (PSA) on the output. However, precise quantitative comparisons between the intended state and experimentally measured polarization states are often notably different115. To date, polarization-dependent metasurfaces have predominantly been limited to proof-of-concept demonstrations, and explicit performance requirements for specific applications have yet to the rigorously determined.
Metasurfaces for metrology of optical quantities
With the development of metasurfaces, several intriguing propositions aiming at replacing and improving existing components have been demonstrated. In this section, we discuss the impact of metasurface technology on metrology of optical quantities, and how their integration, compactness, performance, and new functionalities will keep improving metrology instrumentation in the future. Given the expansive scope of metrology and the versatile integration of metasurfaces into various systems, such as those used for topography116 or displacement measurement117, this discussion is confined to the metrology of the optical physical quantities outlined earlier. Besides the multiple metasurface examples, mostly realized as laboratory proof-of-concept of standalone devices, we first consider hereafter several examples of metasurface integration in metrology systems.
In the domain of polarimetry, metasurfaces opened new design and conception opportunities for efficient and compact polarimeters118. Such metasurface-based polarimeters leverage the extensive metasurface optical engineering properties to separate light into different directions, each associated with a user-defined state of polarization6,80,93. This approach can thus achieve full SoP measurements with a single acquisition. These devices naturally belong to either the division of amplitude -by splitting the polarization in different orders- or to the division of wavefront categories. Replacing several optical and polarizing components with a single metasurface holds strong integration capabilities, including simultaneous analysis and spatial sorting of multiple SoPs. Moreover, the ease of fabrication of small-scale metasurfaces makes them particularly suitable in polarimetric cameras. In ref. 119, a full-Stokes metasurface-based polarimetric camera has been demonstrated, cf Fig. 4a. The polarimetric system consists of a division-of-amplitude setup, where the metasurface splits the incoming light into four elliptical SoPs in different diffraction orders, forming four different and separated images on a 2D sensor. The four elliptical SoPs are judiciously engineered to form a regular tetrahedral volume in the Poincaré sphere, and as such, this measurement enables Stokes camera imaging beyond the classical linear polarization analysis. A complete study on the accuracy of the polarimetric camera has been conducted showing accuracy in the DoP of 0.5% for linear polarization at three different wavelengths and 2.4% for circular polarization at a single wavelength120. Alternatively, a division-of-wavefront polarimeter has also been demonstrated by integrating a metasurface onto a CMOS imaging sensor121 as presented in Fig. 4b. This compact polarimeter can determine a Stokes vector with 2% accuracy and up to 4% within a field of view of 40°. Metasurfaces can be easily integrated into a microscopy setup to create one of the most compact full Mueller matrix optical microscopes122. This compact and efficient system provides exciting imaging application opportunities, notably for metasurface metrology to characterize potential spurious spatial polarization aberrations.
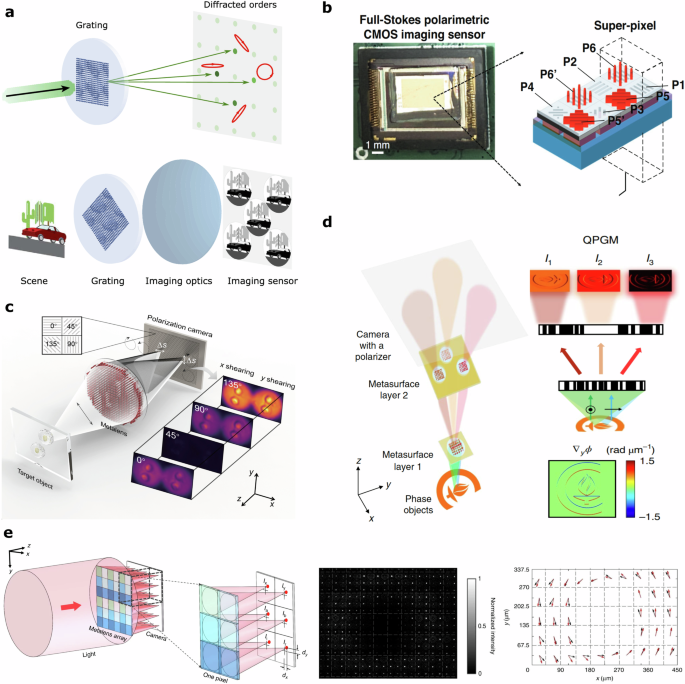
a Schematic of the working principle of a metasurface-based polarimetric camera. (Top panel) The metasurface acts as a polarization grating which diffracts incoming light onto four different diffraction orders with specific SoP. (Bottom panel) Associated with an imaging system, the metasurface forms four images (without 0th order) corresponding to each SoP. Adapted from ref. 129 with permission. b Metasurface-based polarimeter based on division-of-wavefront setup. The metasurface is formed by 8 sub-units in a Bayer-like scheme. Four units (P1, P2, P3, P4) analyze linear polarization with metallic vertical double-layered gratings (grey stripes). Four units (P5, P5’, P6, P6’) analyze circular polarization by adding a silicon metasurface quarter-wave plate (red grating) on top of a linear polarization. Adapted from ref. 121 with permission. c Working principle of the metalens-assisted single-shot complex amplitude imaging system. The schematic shows the captured x and y shearing interference patterns, for polarization channels oriented at 0°, 45°, 90°, and 135°. Adapted from ref. 125 with permission. d Schematic and operation principle of a metasurface-based QPGM. The system utilizes two metasurface layers: the first metasurface creates two sheared focuses for TE and TM polarizations, splitting the field in three directions toward three separate metasurface lenses in the second layer. Each compound, including a lens and a polarizer, generates a distinct DIC image with different phase offsets between the TE and TM polarizations. Adapted from ref. 123 with permission. e On the left panel, a scheme of the generalized Shack–Hartman beam profiler integrated with a metasurface array. Each pixel comprises six polarization-sensitive metalenses to capture phase gradients (blue graded) and polarization states. The middle panel shows an image of focal spots from the metalens array for the azimuthally polarized beam. The right panel shows measured local polarization profiles (black arrows), and the calculated ones (red arrows). The dashed gray lines highlight the individual pixels of the metalens array. Adapted from ref. 127 with permission.
In addition to polarimetry, the integration of metasurfaces into instrumentation for metrology promises to revolutionize phase characterization techniques by implementing state-of-the-art precision in highly compact devices. Metasurfaces multifunctionality, including polarization and space multiplexing, can generate intricate interference patterns, which would be used to retrieve object 2-dimensional phase profiles. To date, some of the most developed metasurfaces for quantitative phase characterization belong to the shearing interferometry category but we expect innovation in other areas in the coming years. For instance, a compact quantitative phase microscope with a total volume of 1 mm3, inspired by the classical differential interference contrast (DIC) microscopy, has been demonstrated123. It uses a bi-layer multifunctional dielectric metasurfaces to generate three DIC images, captured in a single shot with a classical CMOS sensor, cf. Fig. 4d. The first metasurface layer collimates light from two focal points for the TE and TM polarizations, both are separated in the y direction and it dispatches 3 Fourier plane image replicas towards the three metasurfaces on the second layer. The second metasurface layer is composed of 3 birefringent off-axis metalenses that each form a DIC image with different phase offsets between the two orthogonal polarizations. The three captured images are computed to retrieve the phase gradient in one direction. The demonstrated device is capable of measuring phase differences as small as 0.207 rad. Compared to classical DIC which captures only qualitative phase information, this device provides quantitative phase measurements. Follow-up demonstrations of metasurface-based quantitative phase microscopy used a similar working principle124,125. The example reported in124 uses also a bilayer of dielectric geometrical metasurfaces to split the light into two orthogonal circularly polarized lights, separated in spaces and then combined again to interfere with a CMOS polarization detector. This configuration allows to measure four interference images, one for each polarization channel of the camera, and has been used to retrieve the phase gradient in one dimension. In ref. 125, the authors reported a single-layer metasurface quantitative phase microscopy that can measure the phase gradients in two dimensions. The latter metasurface design is highly multifunctional, cf. Fig. 4c. It focuses the light in two different spatial regions, meanwhile splitting and slightly displacing each focal spot in two orthogonal circularly polarized light. The four interference patterns are then captured with a CMOS camera and used to retrieve the phase gradient images, with a resolution of the smallest detectable phase gradient of 42 mrad μm−1 and high relative phase accuracy of 0.0021λ. In ref. 126, the authors reported another use of metasurface with a classical optical microscope to perform phase contrast microscopy. In particular, they leveraged the angle-dependent transmission amplitude and phase-addressing properties of nonlocal metasurfaces to facilitate quantitative phase-contrast imaging. Metasurfaces have also been used in the classical Hartmann mask architecture, replacing microlens array with 6 polarizing metalenses to measure both phase and polarization measurements127. The implementation of polarizing metalenses allows retrieving the Stokes parameters as well as the phase gradients in two dimensions, see Fig. 4e. A Shack-Hartmann wavefront sensor made with 100 × 100 metalenses of diameters 12.95 μm achieving wavefront precision of 0.12λ128.
These last papers nicely illustrate the potential of metasurfaces for improving existing wavefront metrology devices. Looking forward, we believe that the freedom of observing and analyzing specific spatial areas of a sample, including their polarization, scattering, reflection, and spectral responses, associated with the possibility of multiplexing several of these optical metrology techniques on the same device, would enable massively parallel measurements of several quantities simultaneously. Multi-beams engineering and multiple observation areas are unique capabilities of metasurfaces to bring innovation in various metrology applications, for example for inspection and defect detection of semiconductor substrates, wafers, and electronic chips. The implementation and integration of large metasurfaces in complex imaging systems should drastically speed up and improve the current metrology devices, potentially revolutionizing their usage in semiconductor foundries in the coming years.
Conclusion
In this review, we have explored the different metrology techniques used for the characterization of the optical metasurfaces properties, including amplitude, phase and polarization properties. With the booming development of metasurfaces technology in the early 2010s, various metasurfaces’ proof-of-concepts have been deployed in several applications. Today, this technology is slowly starting to climb the slope of enlightenment of the Gartner hype cycle, and mainstream adoption of this technology requires metasurfaces fabrication at the industrial level. Associated with the broad market perspectives of metasurfaces in imaging, consumer electronics, and optical networks, dedicated characterization methods that would be adapted to assess many optical components at once are still needed. In addition, standardization of this technology to ensure consistency and reliability across different manufacturers, and compatibility with existing infrastructure and technologies is urgently needed. Beside having to choose the most relevant material for metasurface manufacturing, efforts to define standardized designs, fabrication methodologies, and establishment of standardized testing procedures would be needed in the coming years. Standardization of this technology would not only leverage the metrology tools and the facilities currently available, but it would also pose challenging questions. In particular, the ever-shrinking size of the features and limited space on patterned wafers are imposing constant pressure on the level of innovation on metrology solutions, with the objectives of improving the resolution and the sensitivity to chemical composition, while maintaining reasonable inspection rate and defect detection speed. As we are reaching the limit of current metrology tools, innovative optical metrology solutions, which would involve parallel and multifunctional optical measurements, are desired. Metasurface design flexibility and large area collection on the same optical device of hundreds of micron-scaled optical components with diverse functionalities are extremely desired assets of this technology, endowing metasurface with a considerable potential to disrupt the field of optical metrology. For this visionary future to become an industrial reality, efforts are needed to reduce straight light and to improve metasurface SNR for each of its detection channels. In addition, more quantitative information is needed to characterize the defect detectability with metasurface. It is noteworthy that metasurface technology could drastically improve metrology, its own diversification and evolution still rely on achieving optimal nanofabrication, which is still assessed using current metrology tools.


Responses