Microglia dysfunction, neurovascular inflammation and focal neuropathologies are linked to IL-1- and IL-6-related systemic inflammation in COVID-19

Main
Neurological impairments associated with COVID-19 markedly contribute to disease severity and outcome after severe acute respiratory syndrome coronavirus 2 (SARS-CoV-2) infection1. However, the mechanisms underlying neurological symptoms that are highly heterogeneous in appearance, duration and severity in individual patients are not well understood. Clinical observations show diverse pathologies in multiple brain areas, including focal hyperintensities, loss of vascular integrity, microcoagulations, gliosis, demyelination, neuronal and glial injury and cell death2,3,4,5,6,7. Of note, neurological changes such as reduced brain size and gray matter thickness may persist for months after the onset of SARS-CoV-2 infection8. In line with these neurological alterations, symptoms including mental health conditions such as anxiety, depression, cognitive dysfunction, ‘brain fog’, dysautonomia and neuroendocrine dysfunction associated with respiratory and cardiovascular complications after recovery from acute disease and, in long COVID, may be present in patients even after apparently mild infection2,9,10.
COVID-19 is also associated with broad inflammatory changes, which could contribute to disease pathophysiology via promoting procoagulant states, vascular dysfunction, hypoperfusion, edema, blood–brain barrier (BBB) injury or altered glial responses, among others4,10,11,12. As a hallmark of central pathologies, microglia, the main inflammatory cells in the central nervous system (CNS) parenchyma show morphological transformation and disease-associated inflammatory fingerprints in the brains of patients with COVID-19 (refs. 1,13,14,15,16,17,18). However, mechanistic links across SARS-CoV-2 infection, CNS inflammation and microglial phenotype changes are vaguely established at present19,20. Although microglia may respond to SARS-CoV-2 directly, and the virus may persist in the brain for months21,22, the extent of productive SARS-CoV-2 infection in the brain parenchyma and its links with neurovascular changes are controversial. It is also unclear how infection-associated inflammation could alter microglial phenotypes and how microglia may influence regionally heterogeneous neuropathologies across the brain.
COVID-19 is a multiorgan disease associated with systemic inflammation and shares several common risk factors with cerebrovascular diseases, where links between systemic inflammation and central vascular and microglial pathologies have been established23,24. Thus, we hypothesized that microglial dysfunction caused by virus exposure or associated inflammation may occur at sites of focal neuropathologies in the brain. To investigate this, we developed an autopsy platform allowing direct spatial correlation of focal neuropathological and microglial phenotype changes with central and systemic inflammation. We found microglial dysfunction and impaired intercellular communication at sites of SARS-CoV-2-associated vascular inflammation, which are strongly linked with an IL-1- or IL-6-related multiorgan proinflammatory response, characteristic virus-sensing pattern recognition receptor (PRR) signatures and diverse neuropathological changes across the brain.
Results
COVID-19 is associated with focal loss of microglial P2Y12R
Using an autopsy platform for correlative analysis of molecular anatomy, proteomic and transcriptomic data, we collected fixed and frozen mirror tissue blocks from several brain areas and peripheral organs of 11 postmortem COVID-19 cases (Extended Data Fig. 1). Brain tissues were also collected from 2 further COVID-19 cases and 23 controls without neurological disease for comparative studies (Supplementary Table 1). Logistic regression analysis revealed no differences in age, gender or clinical parameters between COVID-19 cases and controls, although the number of patients with COVID-19 on mechanical ventilation was higher. However, measurement of inflammatory mediators did not reveal any significant effects of ventilation in the cerebrospinal flluid (CSF) or the brain tissue within the COVID-19 group (Supplementary Table 1).
We found regionally heterogeneous microglial morphological changes in cases of COVID-19. In the olfactory bulb, Iba1+ microglia with abnormal morphology were associated with disintegrated neuronal cell bodies and nerve fibers (Fig. 1a), whereas amoeboid Iba1+ cells were found in the choroid plexus and cranial nerves (nos. IX and X assessed). Diverse morphological states ranging from enlarged microglial processes to complete loss of processes and cell cuffs were found in the medulla, hypothalamus and cerebral cortex (Fig. 1a, Extended Data Fig. 2a and Supplementary Table 2). Four brain areas were selected for unbiased morphometric analysis: the gyrus rectus, the temporal cortex, the hypothalamus and the dorsal medulla. The gyrus rectus was chosen because of the proximity of the olfactory bulb, to assess any possible impact of contact viral infection on microglial changes. We found marked changes in microglial cell volume, sphericity and number of branching nodes on microglial processes in COVID-19 compared with non-COVID cases (Fig. 1b–e) with central autonomic nuclei broadly affected (Extended Data Fig. 2b). Next, we tested microglial levels of the core purinergic receptor P2Y12R, a key regulator of microglial responses to infection and injury25. We observed downregulation of P2Y12R expression on microglia in focal lesions across COVID-19 brains, including the cerebral cortex, the thalamus and the hindbrain, most markedly in central autonomic medullary nuclei (Fig. 1f,g and Extended Data Fig. 2c). Quantification in the gyrus rectus and medulla showed significantly lower P2Y12R levels compared with controls (Fig. 1h) with profound reduction in the medulla (P < 0.0001). Of note, the 11 COVID-19 cases examined showed remarkable regional heterogeneities concerning microglial P2Y12R loss (Fig. 1i,j), which was not affected by mechanical ventilation (Supplementary Table 1). Although most microglia with low P2Y12R showed viable morphology, microglial degeneration was also broadly observed as confirmed by electron microscopy (Extended Data Fig. 2d). P2Y12R downregulation occurred proportionally with increased viral load as measured with quantitative (q)PCR across the brain (r = −0.41, P = 0.025). Of note, SARS-CoV-2 RNA levels strongly correlated with the loss of P2Y12R messenger RNA in the medulla (r = −0.87, P = 0.0025; Fig. 1k), suggesting that viral load may directly or indirectly influence microglial states. SARS-CoV-2 RNA was recovered from all brain areas and showed a positive correlation with interferon (IFN)α mRNA levels in both the medulla and the gyrus rectus (Fig. 1l and Extended Data Fig. 3a,b), indicating the development of an antiviral immune response with type I IFN signatures12. Remarkably, the gyrus rectus showed particularly high levels of both IFNα and IFNβ mRNAs, even compared with peripheral tissues (Extended Data Fig. 3c).

a, Fluorescent images showing microglial morphology changes (Iba1, yellow) associated with marked loss of neurons (MAP2, red) in a COVID-19 case compared with non-COVID in the olfactory bulb. Iba1 DAB labeling shows marked morphological transformation of microglia at multiple brain areas in COVID-19. b, Representative 3D surfaces and skeletons showing typical microglial morphologies. c–e, Automated morphology analysis revealing COVID-19-related changes in microglial phenotypes at different brain sites (two-tailed Mann–Whitney U-test: *P < 0.05, ***P < 0.001, ****P < 0.0001 control versus COVID-19). Changes in cell volume (c), number of branching nodes (d) and sphericity (e) are plotted. Each dot represents a single microglial cell (n = 273 or 181 (control or COVID-19, respectively) in the gyrus rectus (BA11); n = 216 or 175 in the temporal cortex (BA38), n = 97 or 64 in hypothalamus; n = 99 or 127 in the medulla from n = 5 COVID-19 cases and 7 controls). f–h, Confocal fluorescent images showing downregulation of microglial P2Y12R in the affected areas of the gyrus rectus (f) and the dorsal medulla (g) (yellow: Iba1, cyan: P2Y12), as revealed by integrated density measurement of P2Y12R labeling (h). ****P < 0.0001, COVID-19 versus control in both brain areas and ####P < 0.0001, COVID-19 gyrus rectus versus COVID-19 medulla, two-way ANOVA followed by Tukey’s post-hoc comparison (n = 2,011 microglia in the gyrus rectus, n = 1,650 microglia in the medulla from n = 4 COVID-19 cases; n = 1,898 microglia in the gyrus rectus; n = 1,550 microglia in the medulla from n = 3 controls). i,j, Spider charts display heterogeneity of microglial P2Y12R loss among 11 COVID-19 cases, showing an arbitrary heterogeneity score based on cell density values in the gyrus rectus (i) and the medulla (j). Blue dots represent normal, Iba1+P2Y12+ microglia and pink dots Iba1+P2Y12− microglia. k, Viral load in the dorsal medulla negatively correlating with P2Y12R mRNA levels (n = 9, where dots represent patients). l, Viral load positively correlating with IFNα mRNA levels in the dorsal medulla (n = 9, where dots represent patients). Correlation graphs show logged data from qPCR with P values and Pearson’s r correlation coefficient displayed. BA, Brodmann area. Scale bars, 50 µm (a widefield microscopy, g), 25 µm (a fluorescent images), 100 µm (f). In c, d, e and h, data are mean ± s.d.
Loss of microglial P2Y12R marks sites of vascular inflammation
We next studied whether focal accumulation of virus-infected cells or viral RNA in the brain tissue could explain regionally heterogeneous microglial phenotypes and P2Y12R loss. From the two antibodies tested in lung tissues to detect SARS-CoV-2 S1 protein and nucleocapsid (Extended Data Fig. 3d), the nucleocapsid (nc) antibody was selected for further studies. SARS-CoV-2 immunopositivity was observed in both parenchymal profiles and immune cells with microglia showing abnormal morphology in the olfactory bulb and cranial nerves (Extended Data Fig. 3e,i). In contrast, although SARS-CoV-2 nc-positive profiles were broadly observed in the brain intravascularly or associated with blood vessels, no evidence of widespread, productive infection in neurons, astrocytes or other parenchymal cells was found. In COVID-19 cases showing the highest viral RNA levels, the dorsal medulla including several autonomic nuclei around the fourth ventricle (for example, the dorsal vagal nucleus, the hypoglossal nucleus and the solitary nucleus) was particularly affected, and virally loaded cells were associated with blood vessels or found in the perivascular space, less frequently in the vicinity of neurons and other parenchymal cells (Fig. 2a,b and Extended Data Fig. 3,f(ii)). Additional analysis showed that CD31+ cells (marker expressed by pericytes and endothelial cells) contained SARS-CoV-2 nc (Fig. 2a(ii,iii)). Disintegration of perivascular structures and viral antigens beyond the vascular endothelium was observed particularly in blood vessels >15 µm (Fig. 2c). Immunoelectron microscopy showed that microglia establish physical interactions with the vascular endothelium at sites showing disintegrated basement membranes and an enlarged perivascular space (EPVS; Fig. 2d). An EPVS was present in 70% of larger (diameter 15–40 µm) vessels and was also observed in 30% of microvessels (7.5–10 µm; Fig. 2e).
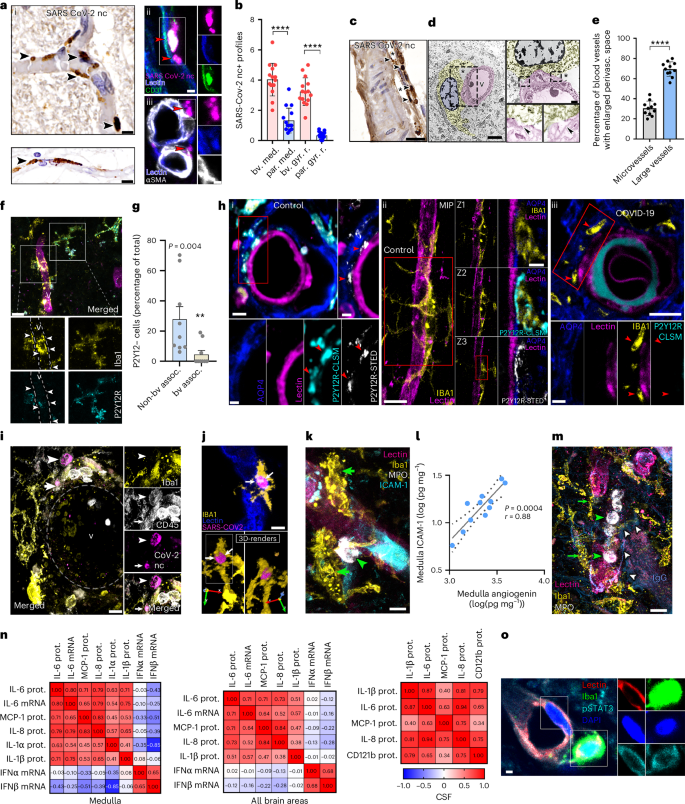
a, (i) SARS-CoV-2 nc staining reveals intra- and perivascular profiles (arrowheads) in the dorsal medulla, with both clogged (top left) and morphologically intact (bottom left) blood vessels containing immunopositive profiles (arrowheads). (ii) Blood vessel-associated cells (CD31, green, lectin, blue) showing SARS-CoV-2 nc immunopositivity (red arrowheads). (iii) Blood vessel-associated (lectin, blue) SARS-CoV-2 nc staining (red arrowheads) not colocalizing with αSMA+ (white) smooth muscle cells. b, SARS-CoV-2 profiles showing vascular or perivascular association (bv.) compared with parenchymal sites (par.) in the dorsal medulla (med.) and gyrus rectus (gyr. r.) (n = 15 ROIs from 3 COVID-19 cases). The two-tailed Mann–Whitney U-test was used: ****P < 0.0001 bv. med. versus par. med. and bv. gy. r. versus par. gy. r. c, Disintegration of perivascular structures (*) and the presence of viral antigens (arrowheads) observed beyond the vascular endothelium in larger blood vessels of the medulla. d, Immunoelectron microscopy revealing microglial cell body and processes (yellow) forming physical interactions with blood vessels (pink, arrowheads) and showing disintegrated basement membranes and EPVS (*). e, An EPVS apparent in large vessels compared with microvessels in the COVID-19 medulla. The graph shows the percentage of microvessels (diameter of 7.5–10 µm) and larger vessels (15–40 µm) with an EPVS in the dorsal medulla (n = 11 COVID-19 cases were measured). The two-tailed Mann–Whitney U-test was used: ****P < 0.0001. f, Microglia (Iba1, yellow) associated with inflamed blood vessels (v, lectin, magenta) showing P2Y12R downregulation (cyan, arrowheads) in the medulla. g, Graph showing comparison of microglia with low P2Y12R levels associated (assoc.) with blood vessels (bv) versus nonassociated cells (n = 9 ROIs from 3 representative COVID-19 cases). The two-tailed Mann–Whitney U-test was used: P = 0.004. h, STED microscopy revealing microglial P2Y12R enriched at both perivascular AQP4+ astrocyte endfeet and direct endothelial contact sites in the medulla of control cases (i and ii). However, microglial P2Y12R around inflamed blood vessels is lost in COVID-19 brains (iii, red arrowheads). i, Perivascular CD45+ immune cells (arrowheads) containing SARS-CoV-2 nc contacted and internalized by Iba+ microglia (arrows). v, blood vessel. j, The 3D rendering of perivascular (lectin, blue) microglia (Iba1, yellow) with an internalized, SARS-CoV-2 nc-positive (magenta) cell. k, Iba1+ microglia (yellow, green arrowheads) recruited to an ICAM-1+ blood vessel (cyan) with associated MPO+ leukocytes (white). l, Correlation between ICAM-1 and angiogenin measured by CBA in medullary tissue homogenates. The logged data with P values and Pearson’s r correlation coefficient are displayed (n = 11, where dots represent patients). m, Iba1+ microglia (yellow, green arrows) showing marked morphological transformation recruited to blood vessels (lectin, pink) with intraluminal MPO+ cells (white, green arrowheads). The presence of IgG (blue, white arrows) indicates plasma leakage into the parenchyma. n, Spearman’s correlation matrix showing inflammatory mediators in medullary homogenates (left), in all brain areas examined (gyrus rectus, temporal cortex, hypothalamus, medulla; middle) and the CSF (right). Spearman’s r correlation coefficient values are displayed. prot., protein. o, The pSTAT3 (cyan) in medullary endothelium (lectin, red) and perivascular microglia (Iba1, green). Scale bars, 10 µm (a(i),h(ii left panel),i,j,k,m), 5 µm (a(ii),(iii),d(left panel),f,h(iii upper panel)), 20 µm (c), 1 µm (d(upper right panel),h(i right and bottom panels),o), 2 µm (h(i upper left panel, ii right panels, iii bottom panels)). In b, e and g, the data are presented as mean ± s.d.
Importantly, we found that vessel-associated microglia have lower P2Y12R levels at the severely affected sites of the dorsal medulla (Fig. 2f,g). P2Y12R accumulates on microglial processes at specific vascular contact sites through which microglia protect against vascular injury, modulate vasodilatation and aid adaptation to hypoperfusion26,27. Stimulated emission depletion (STED) superresolution microscopy showed enriched microglial P2Y12R at both perivascular aquaporin-4-positive (AQP4+) astrocyte endfeet and direct endothelial contact sites in controls, whereas microglial P2Y12R around inflamed blood vessels was lost in the affected areas of the COVID-19 medulla (Fig. 2h). Loss of P2Y12R from vessel-associated microglia was also observed in the gyrus rectus (Extended Data Fig. 3g). Immunofluorescence revealed CD45+, viral nc-containing leukocytes approached by perivascular microglial processes or internalized by microglia (Fig. 2i,j). Some SARS-CoV-2 nc+ leukocytes expressed CD15, a marker for activated lymphocytes and monocytes (Extended Data Fig. 3h) and perivascular leukocytes without intracellular viral antigens were also observed in the vicinity of SARS-CoV-2–immunopositive cells (Extended Data Fig. 3i). Similar observations were made in the gyrus rectus and other cortical areas (Extended Data Fig. 3j), indicating that viral load-related loss of microglial P2Y12R primarily takes place at vascular compartments.
IL-1- and IL-6-related inflammation and microglial dysfunction at sites of vascular pathologies
Our observation that microglial dysfunction takes place at sites of vascular inflammation was further supported by increased expression of intercellular adhesion molecule 1 (ICAM-1), a vascular adhesion molecule mediating leukocyte adhesion and transmigration28, whereas medullary tissue homogenates contained higher ICAM-1 protein levels than other brain areas. Strong correlation between ICAM-1 and angiogenin (a marker of vascular inflammation and remodeling29) was also observed in the dorsal medulla. Moreover, we found leukocytes containing myeloperoxidase (MPO), azurophilic granules of neutrophils and monocytes around ICAM-1+ blood vessels (Fig. 2k,l and Extended Data Figs. 4a,b and 5a). MPO+ cells containing matrix metalloprotease-9 (MMP-9) and leakage of immunoglobulin G (IgG) into the brain parenchyma indicate that BBB injury was associated with marked morphological transformation of microglia in the medulla, hypothalamus and cortical areas (Fig. 2m and Extended Data Fig. 4a–d). Quantification of IgG extravasation revealed more severe BBB breakdown in the medulla compared with other brain areas (Extended Data Fig. 4e,f). Furthermore, we observed that medullary IgG levels showed positive correlation with MPO+ cell numbers (Extended Data Fig. 4g,h), in line with the known pathogenic role of leukocyte-derived MMP-9 in BBB injury30,31. Supporting this, we observed the loss of AQP4+ astrocyte endfeet both at areas showing an average severity of microglial or vascular pathologies and at the most affected sites across different COVID-19 cases (Extended Data Fig. 4i,j).
To understand the nature of the inflammatory response associated with microglial dysfunction, levels of multiple inflammatory mediators were screened by multiplex cytometric bead array (CBA) in parallel tissue blocks to those analyzed with high-resolution anatomy in the selected four brain areas and the CSF. We found that both isoforms of IL-1, a potent driver of vascular inflammation that promotes ICAM-1, MMP-9 and MPO expression32, were produced in COVID-19 brains. Microglial IL-1α was associated with MPO+ cells (Extended Data Fig. 4k) and IL-1α protein and mRNA levels were increased in the medulla compared with other brain areas with low levels measured in the CSF (Extended Data Fig. 5a,b). Some MPO+ cells were also positive for IL-1α (Extended Data Fig. 4k). Although IL-1β protein levels were recovered only from the dorsal medulla, IL-1β+ microglia and IL-1β mRNA were detectable at all brain sites and protein levels were elevated in the CSF, similar to CD121b (IL-1 receptor 2 (IL-1R2)) (Extended Data Figs. 4l and 5a,b).
We also found a strong positive correlation across macrophage chemotactic protein-1 (MCP-1), IL-6 and IL-8 levels in the CSF, dorsal medulla and all other brain areas examined, showing correlation with IL-1β mRNA or IL-1β protein in tissue homogenates and CSF, respectively (Fig. 2n). These proinflammatory cytokines are induced by IL-1 and mediate the recruitment of neutrophils, monocytes and macrophages31,32,33. Associations between IL-6 protein and mRNA levels indicated that IL-6 is produced by resident brain cells, whereas pSTAT3 immunostaining indicative of IL-6 signaling was observed in endothelial cells (ECs) and perivascular microglia (Fig. 2n,o). Type I IFN mRNA responses showed an inverse relationship with IL-1/IL-6/MCP-1/IL-8 with significant inverse correlation between IFNβ and IL-1α in the medulla (Fig. 2n). Thus, COVID-19 is associated with IL-1- or IL-6-related proinflammatory responses at sites of viral antigens, vascular inflammation, BBB injury and microglial dysfunction across the brain, particularly in central autonomic nuclei.
Brain viral load and inflammation associate with systemic inflammation
IL-6 has been identified as a key marker of COVID-19-related illness, neurological dysfunction and mortality34. In line with microglial P2Y12R loss, we observed microglial dislocation in the severely affected brain areas, particularly in the medulla. We quantified this based on a newly developed score of microglial distribution heterogeneity (MDH), which measures spatial heterogeneity of the cells within given fields of view (Extended Data Fig. 6a). MDH values were highest in the dorsal medulla compared with the ventral medulla, white matter tracts (lemniscus medialis, inferior olive and tractus pyramidalis) and the gyrus rectus (Fig. 3a,b and Extended Data Fig. 6b). Importantly, we found a strong positive correlation between IL-6 and MDH scores in the dorsal medulla and with CSF IL-6 or IL-1β levels (Fig. 3c). Furthermore, we found that systemic IL-6 levels, particularly in the spleen and the liver, showed a strong positive correlation with medullary IL-6 levels in individual patients (P = 0.00033, r = 0.93 and P = 0.005, r = 0.79, respectively), whereas lung IL-1β correlated with CSF IL-1β (P = 0.005, r = 0.87) levels (Fig. 3c), suggesting a role for IL-1- and IL-6-related systemic inflammation in COVID-19-related CNS pathologies.
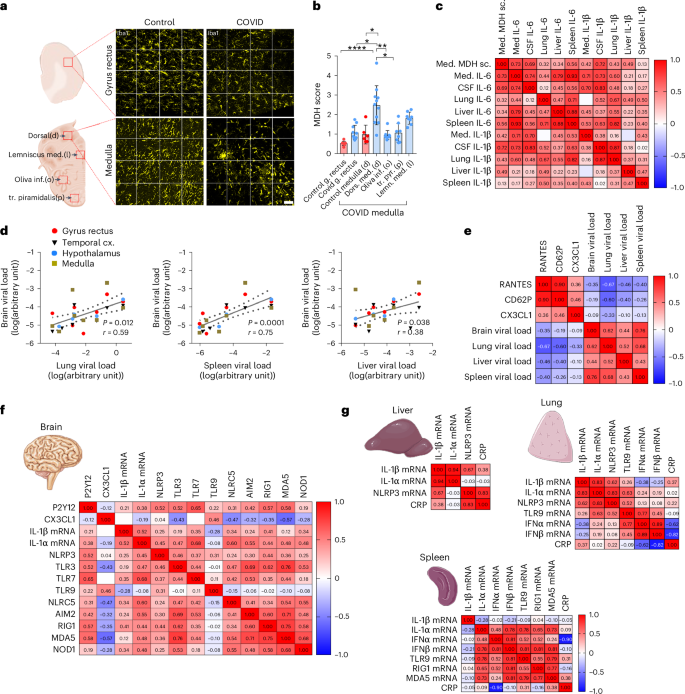
a, Representative images of Iba1+ microglia in the gyrus rectus and the dorsal medulla in control and COVID-19 brains for MDH scores shown in b. b, MDH scores in the dorsal medulla in COVID-19 cases significantly higher compared with those in control tissues, the gyrus rectus and the inferior olive and tractus pyramidalis in the ventral medulla. The Kruskal–Wallis test with Dunn’s multiple-comparison test was, and data were from n = 8–11 COVID-19 cases and n = 6–10 controls: dors.med.(d) versus control gyrus rectus P < 0.0001, dors.med.(d) versus COVID gyrus rectus P = 0.016; dors.med.(d) versus control med.(d) P = 0.015; dors.med.(d) versus inf.olive(o) P = 0.005; dors.med.(d) versus tr.pyr.(p) P = 0.019; dors.med.(d) versus lemn.med.(l) P > 0.999. Data are presented as mean ± s.d. (Please refer to Extended Data Fig. 6 for an explanation of the MDH score and the representative images of lemniscus medialis, inferior olive and tractus pyramidalis.) c, MDH in the medulla (med.) correlating positively with medullary IL-6 levels, CSF IL-6 and IL-1β levels and IL-6 levels in peripheral organs, particularly the spleen. Pearson’s correlation matrix with Pearson’s r correlation coefficient values are displayed. d, SARS-CoV-2 RNA levels measured by qPCR in peripheral organs showing positive correlation with SARS-CoV-2 RNA levels in the brain. Only cases where viral RNA could be detected in the brain were plotted. Spearman’s correlation analysis performed with P values and Spearman’s r are displayed (n = 11). e, Pearson’s correlation matrix with Pearson’s r correlation coefficient value displayed showing positive correlation across RANTES, CD62P and fractalkine levels in the brain tissue (medulla, hypothalamus, gyrus rectus and temporal cortex) (n = 6–10 from a total of 11 COVID-19 cases). Note the negative correlation with viral load in the peripheral organs. f, Pearson’s correlation matrix with Pearson’s r correlation coefficient values displayed showing positive correlation across P2Y12R mRNA, IL-1β mRNA and fractalkine protein levels and mRNA levels of several virus-sensing and inflammasome-forming PRRs. Data are from 11 COVID-19 cases. g, Spearman’s correlation matrix with Spearman’s r correlation coefficient displayed for inflammatory cytokines and relevant virus-sensing and inflammasome-forming PRRs in the lung, liver and spleen also correlated with blood CRP values. Data are from 11 COVID-19 cases. Scale bar, 50 µm.
As SARS-CoV-2 infection may persist in peripheral organs and the brain for months21, we next assessed possible interactions between multiorgan infection and central or systemic inflammatory states. Of note, viral RNA levels in the brain were comparable to those seen in the liver and the spleen, whereas levels in the lung were two to three orders of magnitude higher (Extended Data Fig. 3a). We found that the viral load in the spleen (P = 0.0001, r = 0.77), the lung (P = 0.0006, r = 0.62) and marginally in the liver (P = 0.038, r = 0.44) correlates with central SARS-CoV-2 mRNA levels (Fig. 3d). Although the viral load did not show strong associations with the IL-1/IL-6/MCP-1/IL-8 axis, we found that high viral mRNA levels in the lung and spleen predicted low regulated on activation normal T expressed and secreted (RANTES) (CCL5), CD62P (P-selectin) and CX3CL1 (fractalkine) levels in the brain (Fig. 3e), mediators that have been associated with COVID-19-related disease severity, vascular inflammation and platelet activation35,36,37. Importantly, CX3CL1, a key chemokine mediating microglia–neurovascular interactions via its receptor, CX3CR1, was reduced in the hindbrain compared with the cortex at both protein and mRNA levels (Extended Data Fig. 5a,b), suggesting that systemic inflammation might compromise microglial inflammatory responses via the CX3CR1–CX3CL1 axis38,39.
As IL-1-related inflammatory signatures in COVID-19 suggested a role for inflammasomes, which regulate IL-1β processing and release40, we assessed several PRRs that sense SARS-CoV-2 and/or cellular dysfunction to modulate central inflammatory actions. We found that the medulla showed elevated levels of RIG1, MDA5, TLR3, TLR7, NLRC5 and AIM2, whereas the hypothalamus showed increased MDA5 levels compared with the gyrus rectus and the temporal cortex, with no difference observed in NOD1 and toll-like receptor (TLR)9 levels (Extended Data Fig. 7). NLRC5, RIG1, MDA5 and NOD1 are cytosolic sensors for viral RNA, whereas RNA-sensing TLR3, TLR7 and TLR9 are expressed both intracellularly and on the cell membrane41. The PRRs AIM2, TLR3, TLR7, NLRC5, RIG1 and MDA5 showed a crosscorrelation in the brain tissue and were strongly associated with P2Y12R and IL-1 levels, whereas AIM2, TLR3, TLR9, NLRC5, RIG1 and MDA5 showed inverse correlation with CX3CR1 levels, suggesting the involvement of different, overlapping PRR pathways in modulating central inflammatory states (Fig. 3f). In line with this, the inflammasome-forming PRR NLRP3 showed correlation with IL-1α or IL-1β mRNA levels in the lung and with IL-1β in the liver, wherease TLR9 in the lung and TLR9/RIG1/MDA5 in the spleen were associated with the type I IFN response. In addition, blood C-reactive protein (CRP) levels were positively associated with NLRP3 in the liver and negatively with type I IFNs in the lung and the spleen (Fig. 3g), suggesting that the systemic antiviral immune response may link the activation of PRRs with IL-1-related proinflammatory states, potentially contributing to microglial dysfunction and vascular pathologies.
Microglial dysfunction is linked with disrupted cell–cell interactions
To further investigate how microglial dysfunction may contribute to inflammatory changes in COVID-19 brains, we performed single-nucleus mRNA sequencing (snRNA-seq) from medullary samples from COVID-19 and control patients. We projected a total of 16,260 nuclei and identified 9 different cell populations based on the most variable genes (Fig. 4a, Extended Data Fig. 8a,b and Supplementary Table 3). Differential gene expression analysis on the microglia or macrophage cell cluster between COVID-19 and control samples identified several functionally relevant candidates, including a reduction in P2Y12R and CX3CR1 expression, corresponding to the observations shown above (Fig. 4b,c). As previous microanatomical studies suggested changes of cellular interaction in COVID-19, we performed a cell–cell communication network analysis using CellChat42. Comparing the total number of interactions and the interaction strength across cell types between conditions, we found that COVID-19 resulted in an overall reduction of the cell–cell communication pathways across cell populations in the brain (Fig. 4d,e). Microglia or macrophage interaction with neurons, oligodendrocytes and oligodendrocyte progenitor cells (OPCs) was substantially reduced in COVID-19, but stronger interaction with T cells and astrocytes was detected, mainly through the osteopontin (OPN/SPP1)–CD44 axis (Fig. 4e,f and Extended Data Fig. 8c). A more detailed analysis of the microglia or macrophage cell cluster resulted in the identification of four distinct cell populations. Based on the expression of established marker genes43,44, we could identify clusters corresponding to homeostatic microglia, reactive microglia, perivascular macrophages (PVMs) and other undetermined myeloid-like cells (Fig. 4g). Notably, we observed that microglia or macrophage heterogeneity in COVID-19 samples was substantially compromised and only one out of the four subclusters corresponding to reactive microglia was identified in this condition. Moreover, reactive microglia in COVID-19 display a very distinct transcriptomic signature compared with controls (Fig. 4h and Extended Data Fig. 8d), characterized among others by the loss of P2RY12+ cells and a substantial increase in the number of CD163+ cells identified as PVMs in COVID-19 (Fig. 4i,j). In line with this, immunostaining of P2Y12R+CD163− microglia and CD163+ PVMs confirmed the loss of vessel-associated and parenchymal microglia and demonstrated an increase in PVMs in COVID-19 brains, both in average vascular or microglial pathology and in severe pathology (Fig. 4k,l). We also found negative correlation between medullary IgG levels and microglia numbers (P = 0.0234, r = −0.7767), whereas no such association was observed for PVMs.
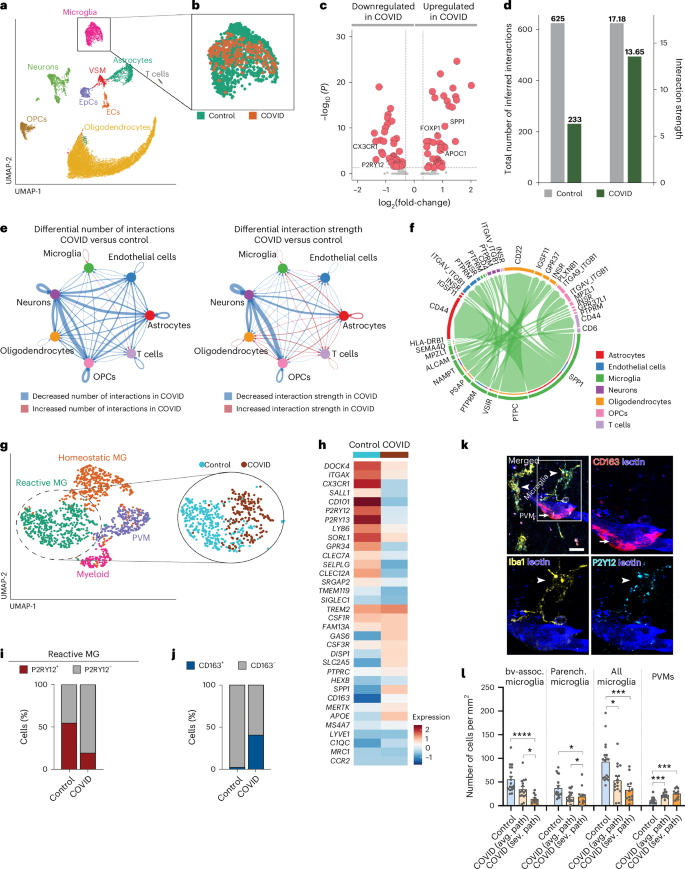
a, UMAP plot of a total of 16,260 nuclei from human brain dorsal medulla samples on snRNA-seq (10×). Nuclei are colored by identified cell populations. EpCs, endothelial progenitor cells; VSMs, vascular smooth muscle cells. b, UMAP plot of microglia or macrophages (1,345 nuclei), colored by condition. c, Volcano plot showing the up- and downregulated genes in microglia or macrophages between control and COVID-19 samples. The colored genes are P < 0.05 and fold-change > 1.25. d, Total number of interactions (left) and interaction strength (right) of the inferred cell–cell communication networks from control (gray) and COVID-19 (dark green) conditions. e, Differential number of interactions (left) and differential interaction strength (right) among cell populations in the cell–cell communication network between control and COVID-19 samples. Red- and blue-colored edges represent increased or decreased signaling, respectively, in COVID-19 compared with controls. f, All significant interactions (left to right (L-R) pairs) from microglia or macrophages compared with all other cell populations. g, UMAP plot of the microglia or macrophage subset (1,345 nuclei), colored by identified subclusters (left) and UMAP plot of reactive microglia (MG), colored by condition (right). h, Key differentially expressed genes in reactive MG between COVID-19 and control conditions. The colour scale represents the average scaled gene expression. i,j, Percentage of cells positive for P2RY12 (i) and CD163 (j) in reactive MG, split by condition (P < 0.001; χ2 test). k, CD163 immunostaining clearly discriminating PVMs (arrow) from Iba1+CD163− microglia (arrowheads) in COVID-19 medulla. Note that microglial P2Y12R is still detectable to confirm microglial identity despite downregulation in vessel-associated MG, whereas PVMs are P2Y12R−. l, Quantitative assessment of MG and PVM numbers in control and COVID-19 medullary samples at sites showing average vascular or microglial pathology (avg. path) and severe pathology (sev. path) (n = 18 ROIs from 5 control patients, n = 12 ROIs from 5 COVID-19 cases with average pathology and n = 16 ROIs from 4 COVID-19 cases with severe pathology). The Kruskal–Wallis test with Dunn’s multiple-comparison test was used: bv-assoc. microglia: control versus severe pathology P < 0.0001; average pathology versus severe pathology P = 0.038; parenchymal microglia: control versus average pathology P = 0.0273, control versus severe pathology P = 0.0123; all microglia: control versus average pathology P = 0.0193; control versus severe pathology P < 0.0001; PVMs: control versus average pathology P = 0.0008; control versus severe pathology P < 0.0001. Data are presented as mean ± s.d. Scale bar, 20 µm.
Microglial dysfunction is linked with metabolic failure and mitochondrial injury
To further elaborate on the potential impact of altered core microglial signatures in patients with COVID-19, we studied cell–cell communication associated with the CX3CR1–CX3CL1 network. We found that the signal between neurons (sender) and microglia (receiver) via the CX3CL1–CX3CR1 axis prevailed in control samples but was completely absent in COVID-19 samples (Fig. 5a). As microglial cell function is influenced by its metabolic state45, we further studied metabolic pathways in microglia and all other major cell populations identified by snRNA-seq between COVID-19 and control cases (Fig. 5b). It is interesting that, although diverse metabolic pathways were abundantly dysregulated in COVID-19, neurons and T cells were barely affected; in contrast microglia and other glial cells showed highly significant differences across multiple metabolic pathways. Specifically, metabolic differences in microglia of COVID-19 cases indicated toward changes in mitochondrial function (tricarboxylic acid cycle, electron transport chain and so on). Therefore, we focused on differential expression of (nuclear transcribed) mitochondrial proteins and identified a significant downregulation of many mitochondrial genes, which are known to code for a very diverse set of proteins encompassing the different protein complexes from the mitochondrial electron transport chain (Fig. 5c,d). These results potentially indicate mitochondrial failure in microglia caused by COVID-19. As for the metabolic dysregulation, this pronounced downregulation of mitochondrial genes was also observed in oligodendrocytes and astrocytes from COVID-19 conditions, but minimally in ECs, T cells and neurons, overall suggesting glial-specific mitochondrial impairment in COVID-19 (Fig. 5d). Histological analysis confirmed mitochondrial changes in COVID-19 microglia associated with inflamed blood vessels, including abnormal ultrastructure of mitochondrial membranes and BAX immunopositivity in a set of cells indicating induction of apoptotic cascades (Fig. 5e,f). To analyze early signs of mitochondrial damage, we utilized STED-superresolution imaging to test the possible efflux of cytochrome c (Cytc). Correlated confocal laser scanning microscopy (CLSM) and STED imaging confirmed the intraorganelle localization of Cytc in the case of healthy mitochondria, labeled by TOM20 (Fig. 5g). STED-superresolution microscopy showed a strict intramitochondrial localization of Cytc in microglia in the medulla from control patients (Fig. 5h); however, the efflux of Cytc from mitochondria was observed in COVID-19 cases (Fig. 5i,j). Immunoelectron microscopy using P2Y12R-immunogold labeling to identify microglia showed that microglial mitochondria in controls display normal ultrastructure (Fig. 5k). In contrast, microglial mitochondria sampled from COVID-19 tissues displayed several aberrations such as the presence of calcium-containing, electron-dense depositions (Fig. 5l), disruption of inner and outer mitochondrial membranes (Fig. 5m) and/or swollen or disappeared cristae (Fig. 5n). The number of mitochondrial abnormalities showed a strong increase in COVID-19 tissues (Fig. 5o), as was also confirmed by transmission electron tomography (Fig. 5p,q). Thus, mitochondrial failure could represent a cornerstone of microglial pathologies in COVID-19, possibly contributing to microglial dysfunction and cell loss.
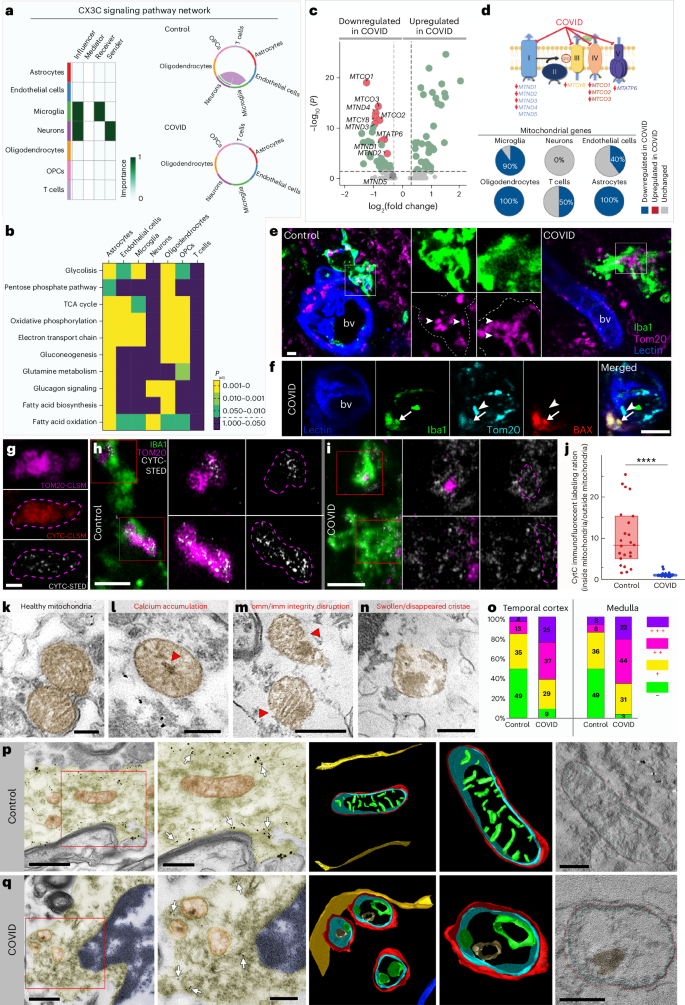
a, Dominant senders, receivers, mediators and influencers in the CX3C communication network (left). Right, significant interactions (L-R pairs) among all cell populations for the CX3C signaling network in control (top) and COVID-19 (bottom) samples. b, Padj values of the differential enrichment of metabolic signatures between control and COVID-19 samples per each cell type. c, Significantly downregulated mitochondrial genes (red, n = 9) in microglia from patients with COVID-19 compared with controls. The colored genes are P < 0.05 and fold-change > 1.25. d, Mitochondrial electron transport chain and identified downregulated mitochondrial genes in COVID-19 microglia per complex. Pie charts show the percentage of differentially expressed mitochondrial genes between control and COVID-19 conditions per cell population e, Microglial mitochondria (Tom20, magenta) in the medulla of patients with COVID-19 showing marked morphological changes compared with control brains (arrowheads). f, Morphologically normal mitochondria (arrowheads) lacking BAX as opposed to BAX+ microglial mitochondria in the medulla (arrows). g, Correlated CLSM/STED of Cytc in healthy mitochondria (TOM20). h, STED microscopy revealing the intramitochondrial localization of Cytc in microglia in the medulla from control patients. i, Efflux of Cytc from microglial mitochondria in the COVID-19 medulla. j, Cytc immunofluorescence labeling ratio (inside mito/outside mito) massively decreased in COVID-19 brains (n = 24 ROIs in 3 control, n = 21 ROIs from 2 COVID-19 cases), Mann–Whitney U two-tailed test was used: P < 0.0001. Data are presented as median ± interquartile range (IQR): control, 8.307 (median 5.0150–15.325 IQR, minimum 1.521, maximum 25.319); COVID: 1.091 (0.926–1.274, minimum 0.690, maximum 3.130). k–n, Immunoelectron microscopy showing microglial mitochondria with disrupted morphology in COVID-19 medulla. k, Mitochondria with healthy cristae structure. l, Mitochondrion with calcium-containing, electron-dense deposits (red arrowhead) in the matrix and associated structural damage. m, Mitochondrial image showing inner (imm) and outer membrane (omm) disruption (red arrowheads). n, Mitochondrion with swollen or disappeared cristae. o, Prevalence of mitochondrial abnormalities in control and COVID-19 temporal cortex and medullary samples. The percentage of mitochondria with no (−), one (+), two (++) or three (+++) types of abnormalities (n = 3 control, n = 2 COVID-19 cases, representative of the average condition of each group). p,q, Transmission electron micrograph (TEM) images (left two panels in each row) showing P2Y12R-immunogold-labeled microglia, with mitochondria chosen for electron tomography. The colored 3D model (left) shows mitochondrial morphology in control (p) and COVID-19 (q) medullary samples. The rightmost panels show single virtual sections from electron tomographic volumes. Arrows point to P2Y12R or Iba1 immunogold labeling, which was used to confirm microglial cellular identity. Healthy outer mitochondrial membrane (OMM, red), inner boundary membrane (IBM, blue) and cristae (green) structure can be seen on the 3D models from control tissue, whereas disappearance or swelling of cristae together with a rough OMM and calcium-containing, electron-dense deposits (brown) are apparent on models from COVID-19 tissue. The microglial cell membrane is yellow and nuclear membrane blue on 3D renderings. Virtual sections that are 0.49 nm thick are displayed on the rightmost panels. Scale bars, 5 μm (e), 10 μm (f), 0.5 μm (g), 2 μm (h,i), 100 nm (k–n), 1 μm (p,q(left panels)), 500 nm (p,q(second from left panels)), 200 nm (p,q(right panels)).
Microglial dysfunction parallels synapse loss and myelin injury
To correlate microglial dysfunction with neuropathological changes, we performed detailed anatomical analysis. Severely affected sites of the dorsal medulla overlapped with key central autonomic centers around the fourth ventricle, including the dorsal vagal nucleus, hypoglossal nucleus, solitary nucleus, vestibular nuclei and, more laterally or ventrally, areas of the inferior cerebellar peduncule, raphe nucleus, nucleus ambiguous, ventral respiratory nuclei, medial lemniscus, pyramidal tract and the olivary nuclei with large regional heterogeneities in given patients. In line with increased numbers of microglial CD68+ phagolysosomes at sites of severe neuropathologies, we found increased engulfment of glutamatergic synapses (vGluT1/Homer immunopositive profiles) in COVID-19 medulla compared with controls (Fig. 6a–c), by microglia expressing both low and high P2Y12R levels. However, STED-superresolution microscopy showed loss of P2Y12R from vascular-associated microglia and microglial processes contacting synapses and neuronal cell bodies (Fig. 6d,e), suggesting impaired microglia–neuron interactions46. Tissue pathology at microglia–synapse contacts was also confirmed at the ultrastructural level (Fig. 6f). To quantify synapse loss, we turned to a sensitive postembedding approach47 that had been optimized in our laboratory for human postmortem tissues (Fig. 6g). We performed analysis in the medulla, gyrus rectus and temporal cortex tissue sites showing ‘average’ microglial pathology or ‘severe pathology’ based on microglial P2Y12R loss and MDH scores (for technical reasons, hypothalamic samples were not suitable for this high-resolution analysis). Postembedding immunolabelling of vGluT1+ and synapsin 1+ profiles showed synapse loss in both average and severe COVID-19 pathology in all brain areas examined (Fig. 6h,i). Microglial engulfment of neuronal cell bodies was more severe in the medulla compared with the gyrus rectus in given COVID-19 cases (Fig. 6j,k). We also observed frequent associations of microglia with disintegrated myelin sheath and myelin engulfment, as confirmed by electron and confocal microscopy (Fig. 6l). As the integrity of myelin is strongly influenced by the expression of myelin basic protein (MBP) and cyclic 2′,3′-nucleotide 3′-phophodiesterase48, we applied quantitative postembedding immunohistochemistry and STED nanoscopy to visualize these proteins (Fig.6m,n). We found marked changes in myelin sheaths in COVID-19 brains (Fig. 6m), including dilatation, curling and loss of myelin compactness (uncompactation) of the myelin sheath48. Quantitative assessment revealed a significantly decreased percentage of axonal profiles with healthy myelin sheath in all investigated brain areas in COVID-19 compared with controls, proportionally with the severity of microglial or vascular pathologies (Fig. 6n). Thus, vascular-driven microglial dysfunction and associated inflammatory changes mark sites of severe neuropathologies in COVID-19.
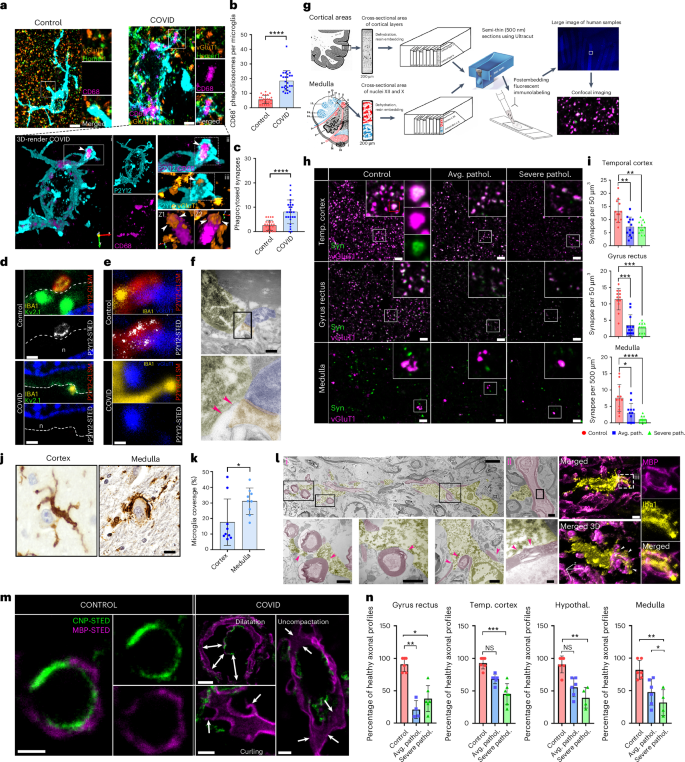
a, Images showing P2Y12+ (cyan) CD68− microglia (pink) contacting vGluT1 (blue)–Homer1 (orange) synapses in a non-COVID-19 brain (top), whereas, in COVID-19 brains, P2Y12, CD68+ microglia internalize vGluT1+ or Homer1+ synaptic profiles (arrowheads on bottom). b,c, Significant increase in microglial CD68+ phagolysosome numbers (b) and increased synaptic phagocytosis (c) by microglia in COVID-19 cerebral cortex (n = 25 ROIs from 3 control, n = 26 ROIs from 4 COVID-19 cases). The two-tailed Mann–Whitney U-test was used: b, ****P < 0.0001 and c, ****P < 0.0001. d, STED microscopy showing microglial P2Y12Rs enriched at Kv2.1+ neuronal somatic contact site (somatic junction) in the gyrus rectus of non-COVID-19 cases (top), whereas in COVID-19 brains P2Y12R expression is downregulated at somatic junctions (bottom, n is neuron). e, Microglial P2Y12R+ process contact at vGluT1+ synapses in control brains (top) whereas in COVID-19 brains P2Y12Rs are lost at these synaptic contacts in severely affected areas of the gyrus rectus. f, Transmission electron microsope (TEM) image showing the Iba1+ microglial process contacting a synapse in a COVID-19 brain. The pink arrowheads show tissue loss around the contact site. g, Schematics of tissue preparation for postembedding immunolabeling. h, Confocal fluorescent panels showing postembedding immunolabeling of vGluT1 (pink) and synapsin+ (green) synapses for quantitative assessment. Note the loss of synapses in both average and severe COVID-19 pathology compared with control brains. i, Significant synapse loss in COVID-19 temporal cortex, gyrus rectus and medulla compared with the same brain areas in non-COVID cases (control n = 3, COVID-19 average pathology n = 3; severe pathology n = 3; 4 ROIs per condition). The Kruskal–Wallis test with Dunn’s multiple-comparison test was used: temporal cortex: control versus average pathology P = 0.0043, control versus severe pathology P = 0.0028; gyrus rectus: control versus average pathology P = 0.0002, control versus severe pathology P = 0.0002; medulla: control versus average pathology P = 0.0271, control versus severe pathology P < 0.0001. j, Iba1 DAB immunoperoxidase labeling with Cresyl Violet counterstain showing microglial engulfment of degenerating neuronal cell bodies in the cerebral cortex and medulla of COVID-19 cases. k, Average microglial somatic coverage of degenerating neuronal cell bodies significantly increased in the medulla compared with the gyrus rectus in the same COVID-19 cases. Samples from the gyrus rectus (n = 9) and medulla (n = 9) were selected from the same COVID-19 cases. Dots represents ROIs. * P < 0.05. l, TEM (left) and CLSM images (right) showing frequent associations of microglia with disintegrated myelin sheath, whereas myelin engulfment by microglia also observed in COVID-19 medulla samples. Pink (TEM panel) and white (confocal 3D panel) arrowheads show sites of microglia–myelin interactions and phagocytosis. m, STED images showing healthy axonal profiles in a control patient’s medulla, using immunolabeling for MBP (magenta) and CNP (green). In COVID-19 patients’ samples, three forms of myelin defects could be observed: dilatation, curling and decompaction of the myelin sheath. n, Percentage of healthy axonal profiles are significantly decreased in the brain of patients with COVID-19 (n = 3 control, n = 3 COVID-19 cases with representative severity of myelin pathology in each group). Kruskal–Wallis test with Dunn’s multiple-comparison test was used: gyrus rectus: control versus severe pathology (Severe pathol.) P = 0.0003; temporal cortex: control versus average pathology (Avg. pathol.) P = 0.0033, control versus severe pathology P = 0.0229; hypothalamus: control versus average pathology P = 0.0413, control versus severe pathology P = 0.005; medulla: control versus average pathology P = 0.0413, control versus severe pathology P = 0.005. NS, not significant. Scale bars, 5 µm (a,f,h,j), 500 nm (d,e,m(control)), 3 µm (l(i)), 1 µm (l(ii),m(curling and decompaction)), 250 nm (l(iii)), 2 µm (m(dilatation). In b, c, i, k and n, data are presented as mean ± s.d.
Protein biomarkers link microglial dysfunction, inflammation and neurological states
To further study disease mechanisms linking microglial dysfunction with inflammation and focal neuropathologies in COVID-19, we performed proteomic analysis of the CSF and medulla tissue homogenates using the Olink platform. We found a significant increase in several CSF inflammatory biomarkers and markers of neuronal injury, glial activity and neurodegenerative changes, whereas more than two-thirds of proteins with altered expression were downregulated in the medulla. In particular, proteins regulating core microglial signatures (CX3CL1, CSF1, CD200/CD200R1 and CD40) were increased in the CSF and decreased in the medulla, confirming our previous observations suggesting marked, region-specific microglial dysfunction in COVID-19 (Fig. 7a and Extended Data Fig. 9a). Proteomics confirmed increased IL-6, CXCL1 and IL-1α in the COVID-19 CSF, in line with markedly higher levels of several biomarkers of inflammation and cellular injury (for example, EN-RAGE, SCARA5, IL-18, CXCL6, GZMA, CLEC1B, Caspase-8 and Siglec-1) compared with non-COVID cases. Downregulated IL-1α levels in the medulla, alongside lower levels of several immune-modulatory proteins (for example, vascular endothelial growth factor A (VEGFA), transforming growth factor (TGF)-α, kynureninase (KYNU), CLEC1B, IL-33 and TWEAK) indicated dysregulation of proinflammatory responses in severe COVID-19 cases. We found changes in several proteases and metabolic enzymes in COVID-19 CSF (MMP-1, MMP-10, uPA, CTSC, CTSS, NMNAT1, ADA, CPA2, HAGH, NTRK2 and GZMA) or medulla (CTSC, NMNAT1, HAGH, CD38, N-CDase, ADAM22 and ADAM23) samples, supporting the profound cellular and metabolic changes revealed by snRNA-seq studies (Fig. 4). We identified major shifts in protein biomarkers for neurological disease highly expressed in astrocytes (MANF, PLNXB1, PRTG, GCP5 and DDR1), oligodendrocytes (PLNXB3, TNFRSF21 and SIRT2), ECs (SCARF2) or components of the extracellular matrix (SMOC2). Several CSF proteins involved in the formation or stability of synapses were increased (NTRK2, JAM-B, TN-R, TNFRSF9, AXIN1, EFNA4 and PD-L1), with vWC2 decreased. Remarkably, key proteins in the regulation of synapse assembly/function/plasticity or axon growth were upregulated (EPHB6, CNTN5, ROBO2, CADM3, JAM-B and TNFRSF12a) or markedly decreased (TNFRSF21, sFRP-3, IL-33, EDA2R, MDGA1, RGMB, THY1 and DNER) in the medulla. Protein changes observed in the COVID-19 medulla also showed a large overlap with changes in the temporal cortex compared with controls. In particular, we detected higher levels of CTSC, NMNAT1, MAPT and CADM3 in both brain sites, whereas, similar to the medulla, several biomarkers of synaptic dysfunction, neurodegeneration and core microglial proteins or regulators (IL-33, HAGH, EDA2R, RGMB, PLNXB1, DNER, PLNXB3, TNFRSF21, ADAM22, ADAM23, CSF1 and CX3CL1) were decreased in the temporal cortex (Extended Data Fig. 9b). ST1A1 was identified as the top downregulated protein in both the medulla and the cortex, which has been previously linked with the severity of Neuro-COVID based on CSF data49. Although several protein biomarkers altered in our COVID-19 study have been linked with cognitive impairment and early onset Alzheimer’s disease50,51, COVID-19-related protein changes were also apparent compared with CSF samples of patients with severe Alzheimer’s disease (Braak 4–6; Extended Data Fig. 10).
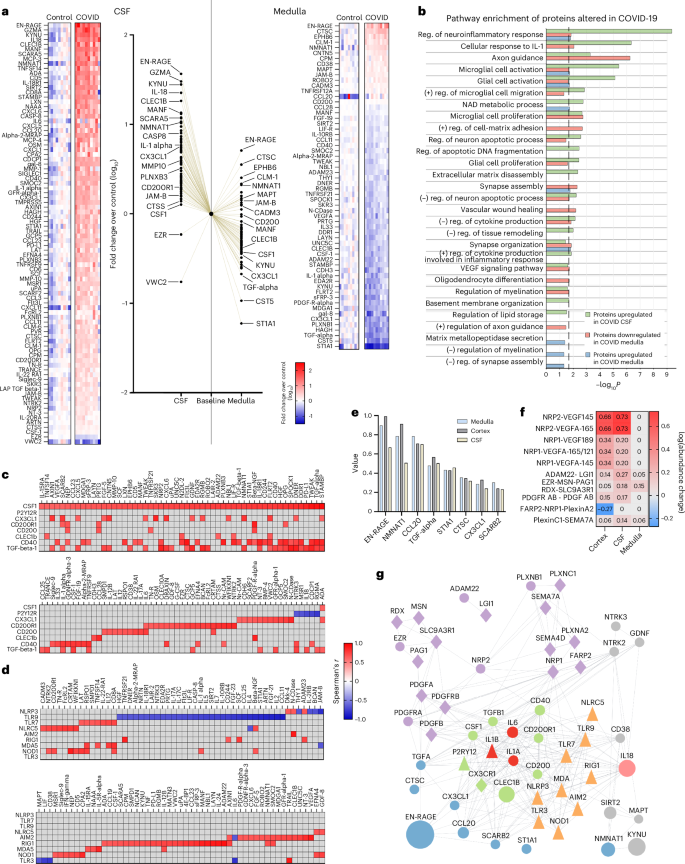
a, Proteomic analysis using the Olink platform showing significantly altered proteins in COVID-19 CSF samples (left) and medullary homogenates (right) compared with non-COVID-19 cases. Middle, comparison of upregulation and downregulation of proteins in the CSF versus the medulla normalized to control baseline values with selected proteins displayed. The data are expressed as log10(average fold-change) over control (Mann–Whitney U-test on logged data with FDR correction; data from 11 COVID-19 cases and 9 controls). b, Main molecular pathways affected in COVID-19 cases based on functional enrichment analysis. reg., regulation. c, Spearman’s multiple correlation analysis showing significant associations between proteins regulating core microglial pathways and markers of inflammatory or neurological states. Data are from 11 COVID-19 cases and 9 controls. Spearman’s r is displayed on the heatmaps. d, Spearman’s multiple correlation analysis showing significant associations between NLRs or TLRs and markers of inflammatory or neurological states. Data are from 11 COVID-19 cases and 9 controls. Spearman’s r is displayed on the heatmaps. Correlations based on protein changes from Olink proteomics are shown except for P2Y12R (c) and NLRs or TLRs (d) where mRNA levels measured by qPCR were used in the absence of appropriate protein assays available. e, Most influential proteins showing the SHAP contribution values of the best-performing machine learning models predicting differences between COVID-19 (n = 11 cases) and non-COVID-19 (n = 8–9 samples from 9 controls) samples, aggregated across tissue types. f, Heatmap showing the log(abundance) of the most changed complexes, predicted by the Cytocast platform (Methods). g, STRING87 protein–protein interaction network of perturbed protein complexes (purple), best COVID-19 predictor proteins (blue), microglial proteins (green), key interleukins identified (red) with IL-18 (pink) additionally revealed by Olink proteomics and PRRs (orange). Other significantly changed proteins are added with gray background. Circles represent proteins measured with Olink proteomics, the size indicating the relative fold-change across all tissues COVID versus control (CSF, medulla, cortex); the triangle is measured by another approach in the present study and the diamond interacting proteins that are not measured.
Source data
In line with CBA and RNA-seq data, pathway analysis of Olink proteomics revealed COVID-19-related changes in microglial activation, cellular response to IL-1, regulation of cell–matrix adhesion, tissue remodeling, vascular wound healing (specifically VEGF signaling), regulation of oligodendrocyte differentiation and migration as well as changes in axon guidance, synapse organization or assembly, neuronal apoptosis and diverse metabolic changes (including NAD metabolic process) in both CSF and medullary datasets, whereas changes in protein levels in the medulla suggested altered MMP secretion and negative regulation of myelination and synapse assembly (Fig. 7b). The proteins regulating core microglial signatures showed strong associations with biomarkers of neuronal injury, synapse assembly, metabolism and cellular responses as identified above (Fig. 7c). Remarkably, a largely overlapping set of proteins showing association with microglial states also correlated with TLR or Nod-like receptor (NLR) expression levels in the medulla (Fig. 7d).
To gain further insight into the key protein signatures of COVID-19, a machine learning algorithm was trained to distinguish COVID-19 and non-COVID-19 patient samples from the medulla, CSF and temporal cortex based on the Olink proteomics data. The algorithm identified eight proteins (EN-RAGE, NMNAT1, CCL20, TGFα, ST1A1, CTSC, CX3CL1 and SCARB2), which gave the best classification accuracy (97.5%) throughout the CNS (Fig. 7e). We also ran proteome-wide simulations of protein complex formation to identify which protein complexes were significantly perturbed in brain samples of patients with COVID-19. The identified platelet-derived growth factor (PDGF), VEGF and plexin complexes strongly interact with a dense network of core microglial proteins, proinflammatory mediators (IL-1α, IL-1β, IL-6 and IL-18) and PRRs as well as the best predictors of COVID-19 (Fig. 7f,g). In particular, the nuclear NAD+ biosynthetic enzyme (NMNAT1) and the key immunomodulator TGFα were identified as potential new regulators of COVID-19-related inflammatory and neurodegenerative changes, based on their correlations identified and known interactions with other proteins. Collectively, COVID-19-related protein fingerprints suggest that major inflammatory changes, microglial dysfunction and altered metabolic states contribute to severe neuropathologies across the brain.
Discussion
The mechanisms through which central and systemic effects of SARS-CoV-2 infection contribute to diverse neurological abnormalities in functionally and anatomically distinct sites of the CNS have remained enigmatic to date. By using an autopsy platform optimized for multimodal characterization of inflammatory states in COVID-19 cases, we showed that viral load and the associated proinflammatory response in peripheral organs were strongly linked with central viral load and inflammation, characterized by IL-1- and IL-6-related vascular pathologies and specific virus-sensing PRR fingerprints in different brain areas. Dysfunction of microglia characterized by their morphological transformation, spatial dislocation, loss of P2Y12R, impaired CX3CR1–CX3CL1 communication, mitochondrial failure and cell death occurs at sites of viral antigen-associated vascular inflammation, marking areas of synapse and myelin injury (Fig. 8). These pathologies are more severe in the hindbrain than in the cerebral cortex, particularly in the dorsal medulla, where key autonomic centers are localized.
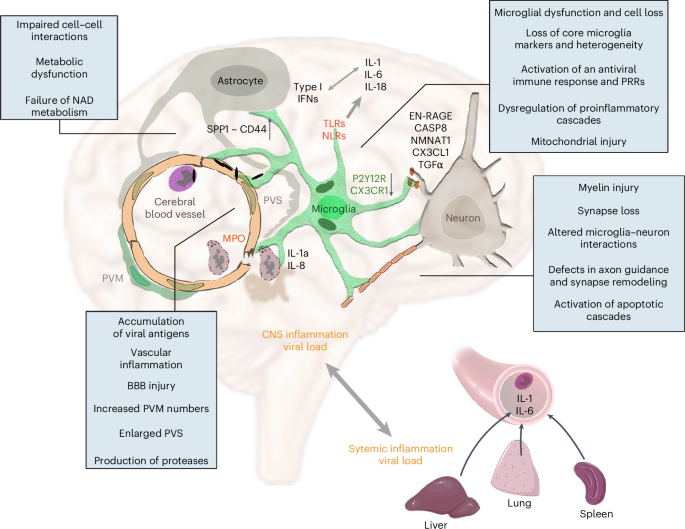
We showed that accumulation of viral antigens in intravascular immune cells and perivascular structures is associated with profound vascular inflammation, EPVS, impaired BBB function, increased PVM numbers, focal loss of microglial P2Y12R and CX3CR1–CX3CL1 axis defects at sites of severe neuropathologies that include disintegration of myelin and loss of synaptic proteins. Assessment of inflammatory changes by different, complementary approaches reveal the activation of PRRs (NLRs and TLRs), the development of an IL-1- and IL-6-related proinflammatory response in line with increased production of IL-18 and an antiviral type I IFN response with partially distinct characteristics in the CSF and the brain tissue. SnRNA-seq, proteomics and molecular anatomy data show markedly impaired cell–cell interactions and metabolic failure in the neurovascular unit, loss of core microglial gene signatures, microglial mitochondrial failure and cell death. Among these, we identified changes in the NAD biosynthetic pathway and the possible regulatory role of TGFα among other potentially contributing pathways, including altered SPP1–CD44 interactions or initiation of apoptotic cascades (via Caspase 8, EN-RAGE or other pathways). Of note, central viral load and inflammatory changes show strong association with those revealed in peripheral organs, including an IL-1- and IL-6-related proinflammatory response and production of downstream cytokines and chemokines, suggesting marked impact of systemic inflammatory mechanisms on central inflammation and related neuropathologies.
The mechanisms whereby SARS-CoV-2 drives neurovascular inflammation and microglial changes are not well understood. Although 10 of the 11 systematically examined cases were unvaccinated, allowing us to reliably characterize central inflammatory states, it is generally difficult to control for the broad effects of critical illness and intensive care of the CNS. Thus, comparisons were made between COVID-19 and non-COVID cases and among different brain areas and peripheral organs within the COVID-19 cohort for key readouts. Beyond the olfactory bulb and cranial nerves containing high SARS-CoV-2 nc levels, viral proteins in the brain were mostly localized to blood vessels and not found inside neurons. This argues against a primarily neurotropic spread of SARS-CoV-2, in line with most neuropathological findings52. Instead, viral antigens in vascular structures and intra- or perivascular immune cells were found near microglial processes or internalized by microglia. Although microglia may not directly restrict SARS-CoV-2 replication53, they are equipped with an arsenal of PRRs that recognize viral antigens inducing inflammatory signaling and cell death to clear infected cells41,54. Microglial phenotypes are strongly modulated by central and systemic inflammation55. To our surprise, despite the heterogeneous clinical background of COVID-19 cases involved in the present study, similar IL-1- and IL-6-related inflammatory fingerprints were identified in each brain area studied, with strong links to CSF patterns and systemic inflammatory states in given patients. In line with this, systemic viral load was associated with brain viral load, whereas MPO+ cells containing viral antigens were observed at sites of vascular inflammation and BBB injury. Increased PVM numbers at these sites may be induced by systemic inflammation or compensate for microglial cell death. Thus, although chronic inflammatory comorbidities promote the risk of poor clinical outcome in COVID-19 cases56, SARS-CoV-2 infection markedly reshapes proinflammatory fingerprints across the body. Supporting our findings, circulating IL-6, IL-8 and MCP-1 levels are strongly associated with disease severity in patients with COVID-19 (refs. 57,58), whereas high viral load and low CCL5 (RANTES) levels were associated with intensive care unit admission or death35. Our data also suggest that the associations between circulating and CSF IL-6 levels in patients with COVID-19 are not explained by inflammatory mediators reaching the CSF from the systemic circulation59, but rather by a brain–body-wide induction of similar proinflammatory signatures as promoted by multiorgan SARS-CoV-2 infection and related vascular pathologies.
Exposure to viral antigens, viral load-related type I IFN signatures and the development of an IL-1-related proinflammatory response suggested the involvement of PRRs, including inflammasome-forming NLRs that regulate IL-1β production40. Cytosolic virus sensors NOD1, RIG1, MDA5, TLR3, TLR7, TLR9 and NLRC5 recognize SARS-CoV-2 infection. Among these, RIG1 and MDA5 are key drivers of antiviral type I IFN responses, whereas production of IL-1β could be induced by activation of TLR3, -7 and -9, and the inflammasomes NLRP3 and AIM2, as supported by observations in monocytes or macrophages on exposure to SARS-CoV-2 or viral antigens22,41,60,61. Characteristic PRR fingerprints in COVID-19 brains, particularly increased PRRs in the medulla that are associated with microglial states, might suggest insufficient coping with infection, similar to the lung, where endothelial TLR3 insufficiency in mice contributes to vascular remodeling by SARS-CoV-2 (ref. 62).
Microglia emerge as key gatekeepers against central neurotropic virus infection, including coronaviruses through P2Y12R63,64. Absence of microglia or microglial P2Y12R leads to neuronal hyperactivity and impairs hypoperfusion, vascular injury, neuronal death and neurological outcome in experimental models of acute brain injury or neuronal hyperexcitability25,26,27,58,65,66,67. Therefore, focal loss of P2Y12R at key vascular and neuronal contact sites is expected to augment neurovascular pathologies in COVID-19 brains. Correspondingly, meta-analysis of EEG findings has revealed a high proportion of abnormal background activity in patients with COVID-19 (96%), with epileptiform discharges present in 20% of cases68. Long-term microstructure and cerebral blood flow changes have also been observed in patients recovered from COVID-19, which correlated with CRP and IL-6 levels even in the absence of neurological manifestations69. We also observed metabolic failure and mitochondrial injury in microglia linked with marked impairments of the CX3CR1–CX3CL1 axis in COVID-19, which is strongly associated with modulation of IL-1 production, microglia–neurovascular communication and synapse and neuron loss in different neuropathologies38,70,71,72. Metabolic pathways were abundantly dysregulated in microglia, astrocytes and ECs, whereas neurons and T cells were barely affected. Thus, impaired microglial interaction with neurons, oligodendrocytes and OPCs, in part via failures in core microglial regulator proteins (P2Y12R and CX3CR1), could precede the excessive synapse or myelin loss observed at multiple sites across the brain. Supporting this, SARS-CoV-2 promotes microglial synapse elimination in human brain organoids, whereas functional microglia appear to be important to attenuate demyelination in neurotropic coronavirus infection in mice73,74.
Proteomic analysis further strengthened the links across inflammation, changes in microglial states and diverse neurovascular pathologies in COVID-19. Although the relatively low number of cases involved in our study could represent a limitation, simultaneous, multimodal assessment of CSF, medulla and cortical tissues provided fundamental mechanistic insight, which also confirmed earlier findings. For example, links of central viral load, microglial P2Y12R loss and type I IFNs in our study, showing inverse correlation with proinflammatory mediator levels, is supported by previous proteomic and transcriptomic studies showing the emergence of a potent type I IFN response in the brain of acute COVID-19 cases, which resolves in the late disease phase75. Type I IFNs are known to attenuate IL-1 production76, which may explain in our study their interference with IL-1α levels and downstream cytokines in given COVID-19 cases presenting different stages or efficacy of type I IFN antiviral responses. We also found increased levels of OPG and TRANCE (RANKL) in the CSF, supporting the dysregulation of the OPG or RANK signaling pathway that correlated with the severity of Neuro-COVID in a study using matched blood and CSF samples, and confirmed previously reported increases in CD200R1 and EZR levels in the CSF49. Remarkably, increases of disease biomarkers in the CSF paralleled the downregulation of proteins regulating core microglial signatures in the medulla, alongside metabolic deficit, altered protease levels, gliovascular pathologies, synapse integrity, myelination and NLRs or TLRs, suggesting the involvement of microglial dysfunction in damage to neuronal networks.
Unbiased machine learning revealed the involvement of TGFα- and NMNAT1-related pathways in COVID-19-associated inflammation and neuropathologies, whereas proteome-wide simulations of protein complex formation suggested the involvement of VEGF and plexin complexes. Remarkably, microglial TGFα has been shown to act as a key modulator of astrocyte neurotoxicity through mechanisms that involve VEGF and tryptophan metabolism via the aryl hydrocarbon receptor in inflammatory demyelination77. In line with this, we observed a marked reduction of related enzymes, KYNU and CD38 in the COVID-19 medulla, which correlated with levels of virus-sensing NLRs and IL-6 (Fig. 7). NMNAT1 levels also showed strong associations with the core microglial modulators CSF1/CX3CL1 and AIM2/RIG1 (cellular damage sensors for DNA and RNA, respectively). Although the KYNU metabolic pathway is the key NAD+ biosynthetic pathway78, disturbed function of the NAD+ biosynthetic enzyme (NMNAT1) leads to axon degeneration, neuronal injury and loss of plasticity in different circuits, in line with DNA damage and immune cell activation12,41,79,80. Thus, the contribution of microglial dysfunction and mitochondrial failure associated with NAD metabolic processes to neuronal injury may be important to study in COVID-19-related acute and chronic neuropathologies.
We suggest that deficient gliovascular communication caused by vessel-associated SARS-CoV-2 antigens, vascular inflammation and microglial dysfunction contributes to the development of focal neuropathologies across the brain in COVID-19, which is modulated by systemic viral load and inflammatory states. Such inflammatory ‘hot spots’ might render given brain areas alongside body-wide effects of tissue hypoxia, multiorgan failure and systemic inflammation particularly fragile, augmenting focal microcapillary coagulation, perfusion deficits and neurovascular injury. In turn, affected medullary and hypothalamic sites could contribute to impaired neuroendocrine and autonomic nervous system function, neuropathies or cardiovascular or respiratory abnormalities as parts of a vicious cycle, whereas inflammation at other, functionally distinct areas, such as the thalamus or the cerebral cortex, may contribute to sleep disturbances or cognitive deficits. As seen after acute insults or in neurological disorders81,82, microglial dysfunction is likely to have long-lasting effects in patients who recover after SARS-CoV-2 infection. Supporting this, in patients with long COVID syndromes, a 18-kDa translocator protein (TSPO) positron emission tomography signal indicative of microglial reactivity has been strongly associated with depressive symptoms and cognitive dysfunction83. Furthermore, a recent study using dynamic contrast-enhanced magnetic resonance imaging revealed BBB disruption in patients with long COVID-associated cognitive impairment and sustained systemic inflammation84. Although the functional role of IL-1 in central COVID-19-related neuropathologies remains unclear, improved clinical outcomes alongside reduced IL-6 and CRP levels after early treatment of patients with COVID-19 with the IL-1R1 antagonist anakinra85,86 suggest that this regimen might also be considered to alleviate symptoms in Neuro-COVID. Collectively, the involvement of microglial dysfunction and related inflammatory changes in COVID-19 argues for the development of therapeutic tools targeting the underlying mechanisms to alleviate acute and long COVID neuropathologies.
Methods
Ethical statement
Human brain samples were collected in accordance with the Ethical Rules for Using Human Tissues for Medical Research in Hungary (protocol no. HM 34/1999) and the Code of Ethics of the World Medical Association (Declaration of Helsinki). All procedures were approved by the Regional Committee of Science and Research Ethics of Scientific Council of Health (ETT TUKEB IV/5187-2/2020/EKU, ETT TUKEB 31443/2011/EKU, renewed: ETT TUKEB 15032/2019/EKU).
Patients and postmortem tissue collection
In the present study, autopsies were conducted on 13 deceased individuals with COVID-19 and 23 non-COVID-19 cases confirmed by PCR (Supplementary Table 1). Autopsies took place at the National Korányi Institute of Pulmonology (11 COVID-19 cases) and Szent Borbála Hospital (2 COVID-19 and 7 non-COVID-19 cases), as well as through the Human Brain Tissue Bank, Semmelweis University, Budapest, Hungary and the Netherlands Brain Bank (16 non-COVID cases), with samples from 7 further cases with Alzheimer’s disease (Netherlands Brain Bank) under ethical licenses ETT TUKEB IV/5178-2/2020/EKU and ETT TUKEB 31443/2011/EKU, renewed: ETT TUKEB 15032/2019/EKU and MTA V2020-1. For 11 COVID-19 cases, full-body autopsies involved the collection of mirror tissue blocks, comprising both frozen and fixed tissues from the lung, liver and spleen, and various brain regions (olfactory bulb, cranial nerves and several cortical and subcortical areas). Uncontaminated CSF was also collected via an optimized protocol by puncturing the corpus callosum and directly withdrawing fluid from the lateral ventricles88. After extraction, all tissue specimens were split into two: one for immediate freezing for molecular analysis and the other fixed in Zamboni I and II fixatives. This facilitated the identification of specific areas for molecular studies through the micropunch technique89 and subsequent assays, including cytometric bead array, qPCR, proteomics and snRNA-seq (Extended Data Fig. 1). Two COVID-19 brains and nine non-COVID-19 brains underwent perfusion with 4% paraformaldehyde. Control individuals displayed no psychiatric or neurological disorders, with death unrelated to brain injury. All but one patient with COVID-19 were unvaccinated (Supplementary Table 1). Detailed clinical records were evaluated to assess COVID-19 symptom progression before death.
Tissue processing and immunohistochemistry
COVID-19 lung and brain tissues were formalin-fixed and paraffin-embedded (FFPE). FFPE sections (4–6 µm thick) were incubated at 45 °C for 2 h, deparaffinized with xylene and hydrated in alcohol solutions. Peroxidase activity was blocked with 1% H2O2 for 15 min at room temperature. Antigen retrieval was performed using citrate buffer, pH 6, at 90 °C for 20 min, followed by cooling. Sections were treated with 1% human serum albumin (HSA; Sigma-Aldrich). Overnight incubation was performed at 4 °C with anti-rabbit SARS-CoV-2 or anti-guinea-pig Iba1 antibodies. Negative controls were prepared similarly. Biotinylated secondary antibodies (Supplementary Table 4) were applied for 4 h at room temperature, followed by avidin-biotinylated horseradish peroxidase complex (Elite ABC, 1:300, Vector Laboratories) for 3 h. The immunoperoxidase reaction used DAB chromogen. Sections were counterstained with hematoxylin, dehydrated, cleared and coverslipped. Images were taken with a Nikon Ni-E C2+ microscope using ×20 and ×60 objectives (Nikon Instruments Europe B.V.).
Immunofluorescent labeling and confocal laser scanning microscopy
From immersion-fixed or perfusion-fixed tissue blocks, 50-µm-thick sections were cut with a vibratome (Leica, cat. no. VT1200S). Before immunostaining, the sections were washed in 0.1 M phosphate buffer (PB) and 1% sodium borohydride (Sigma-Aldrich) for 5 min. Then sections were washed again in 0.1 M PB and Tris-buffered saline (TBS). This was followed by blocking for 1 h in 1% HSA and 0.1% Triton X-100 dissolved in TBS. After this, slices were incubated in mixtures of primary antibodies for 48 h at 4 °C and washed in TBS, then incubated in mixtures of secondary antibodies diluted in TBS at 4 °C overnight. Secondary incubation was followed by TBS washes, then sections were mounted on glass slides and coverslipped with Aqua-Poly/Mount (Polysciences). Immunofluorescence was analyzed using a Nikon Eclipse Ti-E inverted microscope, with a CFI Plan Apochromat VC ×60 oil immersion objective (numerical aperture (NA) 1.4) and an A1R laser confocal system. We used 405-, 488-, 561- and 647-nm lasers (CVI Melles Griot) and scanning was done in line serial mode, with a pixel size of 50 × 50 nm2. Image stacks were taken with NIS-Elements AR. For primary and secondary antibodies used in the present study, please see Supplementary Table 4.
Automated morphological analysis of microglial cells
Sections (100 µm thick) from the gyrus rectus, temporal cortex, hypothalamus and medulla were cut using a vibratome and immunostained with guinea-pig anti-Iba1 chicken anti-Iba1 antibodies and DAPI. Imaging was conducted in 0.1 M PB with a Nikon Eclipse Ti-E inverted microscope, utilizing a CFI Plan Apochromat VC ×60 water immersion objective (NA 1.2) and an A1R laser confocal system. For three-dimensional (3D) morphological analysis of microglial cells, the MATLAB-based Microglia Morphology Quantification Tool was employed (https://github.com/isdneuroimaging/mmqt)90.
EPVS analysis
EPVS analysis was performed as earlier91,92 with some modifications adapted to our tissues. The 5-µm-thick medullary tissue sections were deparaffinized and stained with hematoxylin and eosin following the standard histology protocol. Stained sections were scanned with a slide scanner (3D HISTECH Pannoramic MIDI II slide scanner, 3D Histech Ltd). Images were converted to 8-bit grayscale inverse pictures and thresholded to exclude the background (ImageJ software). To control for potential shrinkage and any artifacts due to tissue processing, we compared EPVS in the dorsal medulla with the least affected part of the medulla (inferior olive) within each COVID-19 case. EPVS was defined as the distance between the blood vessel wall and the brain parenchyma >10 µm in the case of larger (15–40 µm diameter) vessels and >7 µm for smaller (7.5–10 µm diameter) vessels. The percentage of blood vessels with EPVS was plotted in each category.
MDH score
MDH was measured on maximum intensity projection images of 50-µm-thick sections, captured at 0.6 µm px−1 resolution with a Nikon A1R confocal system. The imaged area was divided into 16 equal territories (regions of interest (ROIs)) and Iba1-expressing cells were counted in each of these ROIs. The heterogeneity (MDH) score was calculated for each image by dividing the range of measured cell counts per ROI (maximum number of cells per ROI − minimum number of cells per ROI) by the average number of cells per ROI. In this way a heterogeneity score of 0 meant completely homogeneous distribution and larger scores meant larger irregularities in distribution.
Pre-embedding immunoelectron microscopy and analysis
The 0.1 M PB and 0.05 M TBS used for the experiments contained 0.05% sodium azide. Samples were processed until primary incubation as described for immunofluorescent labeling above. After repeated washes in TBS, the sections were incubated in blocking solution (Gel-BS) containing 0.2% cold water fish skin gelatine and 0.5% HSA in TBS for 1 h. Next, sections were incubated in gold-conjugated or biotinylated secondary antibodies (Supplementary Table 4) diluted in Gel-BS overnight. After extensive washes in TBS and PB, the sections were treated with 2% glutaraldehyde in PB for 15 min, after which the sections were washed with PB and phosphate-buffered saline. This was followed by incubation in avidin-biotinylated horseradish peroxidase complex (Vector Laboratories, Elite ABC; 1:300) diluted in TBS for 3 h at room temperature. The immunoperoxidase reaction was developed using DAB as chromogen. To enlarge immunogold particles, sections were incubated in silver enhancement solution (SE-EM; Aurion) for 40–60 min at room temperature. The sections were then treated with 0.5% OsO4 in 0.1 M PB at room temperature, dehydrated in ascending alcohol series and acetonitrile and embedded in Durcupan (ACM, Fluka). During dehydration, the sections were treated with 1% uranyl acetate in 70% ethanol for 20 min. For electron microscopic analysis, tissue samples were glued on to Durcupan blocks. Consecutive 70-nm-thick sections were cut using an ultramicrotome (Leica EM UC6) and picked up on Formvar-coated single-slot grids. Ultrathin sections were examined in a Hitachi 7100 electron microscope equipped with a Veleta CCD camera (Olympus Soft Imaging Solutions). To study mitochondrial degeneration, we systematically checked the following criteria: (1) presence of calcium-containing, electron-dense depositions; (2) possible disruption of mitochondrial inner and outer membranes; and (3) swollen or disappeared cristae. Mitochondrial damage severity was scored as follows: mitochondria with no abnormalities (−), and with one (+), two (++) or all three (+++) types of aberrations present.
Electron tomography
Before electron tomography, 100-nm-thick sections on single-slot copper grids were photographed with a Hitachi H-7100 electron microscope and a Veleta CCD camera. Sections were examined at lower magnification and P2Y12R+ microglial cells were selected. After this, grids were put on drops of 10% HSA in TBS for 10 min, dipped in distilled water (DW), put on drops of 10-nm gold-conjugated Protein-A (Cytodiagnostics, cat. no. AC-10-05) in DW (1:3) and washed in DW. Electron tomography was performed using a Thermo Fisher Scientific (FEI/Tecnai) T12 BioTwin electron microscope equipped with a computer-controlled precision stage (CompuStage, FEI) and a Xarosa 20MP bottom-mounted CCD camera (Emsis GmbH). Acquisition was controlled via SerialEM93. ROIs were pre-illuminated for 4–6 min to prevent further shrinkage. Tilt series were collected at 2° incremental steps between −60° and +60° at 120-kV acceleration voltage and ×23,000 magnification with −1.6-µm to −2-µm objective lens defocus. Reconstruction was performed using the IMOD software package94. Isotropic voxel size was 0.41 nm in the reconstructed volumes.
Postembedding immunofluorescent labeling and quantitative analysis
The technique described in ref. 47 was used with slight modifications: 200-µm-thick brain slices were washed in 0.1 M PB and 0.1 M maleate buffer (MB, pH 6.0). Then the slices were treated with 1% uranyl acetate diluted in 0.1 M MB for 40 min in the dark. This was followed by several washes in 0.1 M PB, and slices were dehydrated in ascending alcohol series, acetonitrile and finally embedded in Durcupan (Fluca). Each block contained sections of all patients (four control, four COVID-19). Ultrathin sections were cut using a Leica UC7 ultramicrotome at 500-nm thickness, collected on to Superfrost Ultra plus slides and baked on a hotplate at 80 °C for 30 min, then in an oven at 80 °C overnight. Sections were encircled with silicon polymer (Body Double standard kit, Smooth-On, Inc.) to retain incubating solutions on the slides. The resin was etched with saturated Na ethanolate for 7 min at room temperature. Then, sections were rinsed 3× with absolute ethanol, followed by 70% ethanol and DW. Retrieval of the proteins was carried out in 0.02 M Tris base, pH 9.0, containing 0.5% sodium dodecylsulfate at 80 °C for 80 min. After washes in TBS containing 0.1% Triton X-100 (TBST, pH 7.6), sections were blocked in TBST containing 6% BlottoA (Santa Cruz Biotechnology), 10% normal goat serum (Vector Laboratories) and 1% bovine serum albumin (Sigma-Aldrich) for 1 h, then incubated in the primary antibodies diluted in blocking solution, at room temperature overnight with gentle agitation. After washes in TBST the secondary antibodies were applied in TBST containing 25% of blocking solution for 3 h. After washes in TBST, the slides were rinsed in DW and then the sections were mounted in Slowfade Diamond (Invitrogen) and coverslipped. Immunofluorescence was analyzed as described for confocal laser scanning microscopy (CLSM) above.
STED-superresolution imaging and analysis
The 50-µm-thick free-floating brain sections were washed in PB and TBS. This was followed by blocking for 1 h in 1% HSA and 0.03–0.1% Triton X-100 dissolved in TBS. After this, sections were incubated in mixtures of primary antibodies overnight at room temperature. After incubation, sections were washed in TBS and incubated overnight at 4 °C in the mixture of secondary antibodies, all diluted in TBS. For CLSM channels, Alexa dye-conjugated antibodies were used and, for the STED channel, we used Abberior Star 635P- or Abberior Star 580-conjugated antibodies. Secondary antibody incubation was followed by washes in TBS and PB and sections were mounted in Slowfade Diamond (Invitrogen) and coverslipped. Immunofluorescence was analyzed using an Abberior Instruments Facility Line STED Microscope system built on an Olympus IX83 fully motorized inverted microscope base (Olympus), equipped with a ZDC-830 TrueFocus Z-drift compensator system, an IX3-SSU ultrasonic stage, a QUADScan Beam Scanner scanning head, APD detectors and an UPLXAPO60XO ×60 oil immersion objective (NA 1.42). We used 405-, 488-, 561- and 640-nm solid state lasers for imaging and a 775-nm solid state laser for STED depletion. Image acquisition was performed using the Imspector data acqusition software (v.16.3.14278-w2129-win64). For the analysis of Cytc labeling, the outlines of mitochondria were established automatically with the help of Tom20-CLSM labeling and Cytc-STED labeling density was measured within this area, and around this delineation, in a 1-µm-wide area. Finally, the ratio of immunofluorescent signal was established (inside mitochondria:outside mitochondria). During the analysis of MBP and CNP dual-STED immunolabelings we were able to identify three forms of myelin defects: dilatation, curling and decompaction of the myelin sheath. We quantified the percentages of axonal profiles with no, one or multiple defects, and compared the percentages of healthy axonal profiles.
Cytometric bead array
CBA measurements were performed on frozen brain tissue homogenates (gyrus rectus, temporal cortex, medulla, hypothalamus), lung, liver, spleen tissue homogenates and CSF samples. Tissue samples were homogenized in Triton X-100 and protease inhibitor-containing (Calbiochem, cat. no. 539131, 1:100) TBS, pH 7.4, and centrifuged at 17,000g for 20 min at 4 °C. The protein level was quantified for every sample using BCA Protein Assay Kit (Thermo Fisher Scientific, cat. no. 23225). Cytokine levels in brain homogenates were normalized for total protein concentrations and expressed as picogram per milliliter values in the CSF. Concentrations of cytokines were measured by BD CBA flex sets (BD Biosciences) according to the manufacturer’s guidelines. Measurements were performed using a BD FACSVerse flow cytometer and analyzed by FCAP Array v.3 software (BD Biosciences).
Sample homogenization and qPCR
Tissue samples (100 mg) were homogenized in 1 ml of TRIzol (Thermo Fisher Scientific) using a Beadbug 3 micotube homogenizer (Benchmark Scientific). Samples were mixed with 3- to 4-mm stainless steel beads for 120–180 s at 300 rpm, then centrifuged for 10 s to remove undissolved particles. The supernatant was stored at −80 °C until further use. Total RNA was isolated from the homogenized tissue using TRIzol, following the manufacturer’s guidelines. RNA concentration was measured with a NanoDrop ND1000 spectrophotometer (Promega Biosciences) and integrity was evaluated using an Agilent 2100 Bioanalyzer, assessing the RNA integrity number and the 28S or 18S ribosomal RNA ratio. Samples were stored at −80 °C in nuclease-free water. Viral load in various tissue samples was quantified95 using a TaqManTM 2019nCoV Assay Kit v.1 (Thermo Fisher Scientific). For real-ime (RT)–PCR and quantitative RT–PCR (RT–qPCR), RNA was treated with DNase and RNase inhibitor (Ambion) before reverse transcription using SuperScript II first-stand reverse transcriptase and oligo(dT) primers (Thermo Fisher Scientific). Gene expression was quantified using a QuantStudio12K flex qPCR instrument (Applied Biosystems), with a program consisting of a 10-min denaturation at 95 °C followed by 40 cycles of two-stage PCR (95 °C for 12 s and 60 °C for 1 min). Taqman Gene Expression Assays and Taqman Gene Expression Master Mix (Applied Biosystems) were used and the comparative Ct method was applied to calculate relative gene expression normalized to the ACTB gene (Supplementary Table 5).
SnRNA-seq
Single-nuclei suspensions were prepared from 11–13 mg of flash-frozen human brain medullary samples using the Chromium Nuclei Isolation Kit with RNase Inhibitor (10x Genomics, cat. no. PN-1000494). These suspensions were then submitted to a microscopic inspection of integrity and further processed according to manufacturer’s (10x Genomics) protocols at a concentration of 4,000–8,000 nuclei µl−1. Single-nuclei mRNA libraries were prepared using 10x Chromium Next GEM Single Cell 3’ v.3.1 solution. Quality control of all complementary DNA samples was performed with a Bioanalyzer 2100 (Agilent Technologies) and libraries were quantified with the Qubit dsDNA HS kit (Thermo Fisher Scientific). Libraries were sequenced on an Illumina -NextSeq-2000, aiming for 25,000 reads per nuclei.
SnRNA-seq data processing and analysis
Cell Ranger software (10x) was used to process raw data, align reads to the human hs38 reference genome and summarize unique molecular identifier (UMI) counts. Filtered gene-barcode matrices containing only barcodes with UMI counts that passed the threshold for nuclei detection were used for further analysis. Filtered UMI count matrices were processed using R and the R package Seurat. As quality control steps, the following nuclei were filtered out for further analysis: (1) nuclei with a number of detected genes <200 or >4,000 and (2) nuclei with >3% of counts that belonged to mitochondrial genes. A total of 11,822 nuclei for controls and 4,438 nuclei for COVID-19 cases were included in the analysis. Raw gene counts in high-quality singlets were log(normalized) and submitted to the identification of high variable genes by MeanVarPlot method. Data were scaled and regressed against the number of UMIs and mitochondrial RNA content per cell. Data were subjected to principal component analysis and unsupervised clustering by the Louvain clustering method. Clusters were visualized using Uniform Manifold Approximation and Projection (UMAP) representations. Clusters were manually annotated using the top upregulated genes for each cluster and the expression of key previously described markers. Differentially expressed genes between conditions were calculated using the FindMarkers function and heatmaps were created using the DoHeatMap function, both from Seurat. Volcano plots were generated using EnhancedVolcano in R (Bioconductor EnhancedVolcano v.1.6.0). Cell-to-cell communication network analysis was performed using R toolkit CellChat. In brief, probable interactions at the cell-to-cell level were calculated via the computeCommunProb function using the 10% truncated mean method to compute average gene expression (parameter trim = 0.1). Communication probabilities were then calculated by invoking the computeCommunProbPathway function. Ligand–receptor interaction probabilities were visualized via netVisual functions. Measures in weighted-directed networks, including out-degree, in-degree, flow betweeness and information centrality, were used to respectively identify dominant senders, receivers, mediators and influencers for the intercellular communications, followed by the netAnalysis_signalingRole_network for visualization. CellChat objects were compared via compareInteractions function. A gene signature enrichment analysis using the ‘AUCell’ method96 was also applied to identify cells with active metabolic signatures. In brief, gene signatures representing different metabolic pathways were manually annotated based on datasets from gene ontology (GO) and Kyoto Encyclopedia of Genes and Genomes pathway resources. Mouse gene IDs were converted to human gene IDs using the g:Convert function from g:Profiler97. The area under the curve (AUC) was then calculated to determine the proportion of genes from each metabolic gene signature that was highly expressed in each nucleus. Statistical differences of the resulting AUC values between nuclei from control and COVID-19 samples were calculated using Student’s t-test with the Benjamini–Hochberg correction.
Correlation and network analysis
Protein, qPCR and complete blood count measurements were z-score normalized. Pearson’s correlation in all possible combinations was calculated and P values were calculated and corrected using the Benjamini–Hochberg method. Cystoscape was used to visualize P < 0.001 connections.
Proteomic analysis
CSF (n = 11 COVID-19, 9 control and 7 AD cases) and brain samples (n = 11 COVID-19 and 9 control cases) were stored at −80 °C and shipped on dry ice to Olink Proteomics AB (Uppsala, Sweden) for analysis. Protein concentrations were measured using a proximity extension assay98, a high-throughput immunoassay utilizing paired oligonucleotide, antibody-labeled probes. Samples were randomly distributed across the plate and all protein analyses were performed by board-certified laboratory technicians blinded to the clinical information. Target 96 Neurology and Target 96 Inflammation assays were used that ensured the analysis of 182 proteins (due to 2 overlaps in the selected assays). One COVID-19 CSF sample was excluded from the statistical analysis as the result of quality control issues reported by Olink Proteomics AB. Normalized Protein eXpression (NPX, Olink’s arbitrary unit) levels were compared across groups and two-sample Student’s t-tests were done on log10 values. Functional enrichment analysis was done using R (v.4.3.1) with the gprofiler2 package99 and a false recovery rate (FDR) correction on the GO:BP database, without a customized background set.
Machine learning for proteomics and perturbed protein complex identification
Proteomics data from the medulla, CSF and temporal cortex were combined for machine learning analysis (sample size = 58, features = 184). A binary logistic regression100 classifier, using tenfold crossvalidation, was applied to predict the presence of COVID-19. Each fold partitioned data into a 90% training set and a 10% test set, with unique test sets across folds. Forward Sequential Feature Selection was used to reduce features by selecting top-performing ones from the training set, up to a ten-feature limit. Binary accuracy scores were calculated and averaged across folds to assess performance for feature counts from 1 to 10. SHAP101 values identified proteins contributing the most to predictions. Using the Olink dataset, changes in 182 protein abundances in the medulla, CSF and cortex were calculated relative to the baseline brain proteomics dataset102. We ran quantitative simulations of protein complex formation103 through the Cytocast platform, as described earlier104, to identifiy which protein complexes had major changes in their abundances in three tissue types. The top altered complexes were incorporated into the String network as shown in Fig. 7g.
Statistics and reproducibility
All data shown in column and line graphs represent the mean ± s.d., unless stated otherwise in the figure. Individual data points have been represented by dots. Significance levels are indicated as: *P < 0.05, **P < 0.01, ***P < 0.001 and ****P < 0.0001. Sample sizes, statistical methods and repeatability are mentioned in the respective figure legends. Raw data and detailed statistical analysis are summarized in Supplementary Table 2. No statistical methods were used to predetermine sample sizes, but our sample sizes are similar to those reported previously for clinical data84. Data collection and analysis were performed blinded to the conditions of the experiments. No data points were excluded from analysis concerning the measurements performed on the samples included in the study. Statistical analysis was performed using GraphPad Prism 7 software (GraphPad Software, Inc.) and in R (v.4.3). Normality of datasets was determined using the Shapiro–Wilk test. In the case of two independent groups of data, an unpaired Student’s t-test or Mann–Whitney U-test, for multiple comparisons a one-way analysis of variance (ANOVA) with Tukey’s post-hoc test or Kruskal–Wallis test with Dunn’s multiple-comparison test was used for normally distributed and nonparametric data, respectively. FDR correction was applied when comparing single-nuclei sequencing data and Olink data between COVID-19 cases and controls. The correlation matrix was based on Pearson’s correlation test for parametric and Spearman’s correlation for nonparametric datasets on logged data. A contingency table was analyzed using the χ2 test.
Reporting summary
Further information on research design is available in the Nature Portfolio Reporting Summary linked to this article.

Responses