miRNA profiling of hiPSC-derived neurons from monozygotic twins discordant for schizophrenia

Introduction
Schizophrenia is a complex developmental disorder with a strong genetic component. Large genome-wide association studies (GWAS) have identified 287 genomic loci for schizophrenia including 106 identified protein-coding genes1. In addition, multiple miRNA-coding genes have been found in these genomic regions2,3. In general, the schizophrenia risk genes are more likely to be regulated by miRNAs compared to other genes3 suggesting that miRNAs contribute to the altered neurobiology of schizophrenia.
Human induced pluripotent stem cell (hiPSC) -derived brain cells provide a patient-specific model to investigate the development of psychiatric disorders. While transcriptomic profiling is typically conducted as a standard procedure to characterize the patient-derived brain cells, separate miRNA sequencing is less frequently performed4,5. Individual miRNAs have the potential to alter the expression of large groups of genes causing distortions in major developmental processes5. To gain insights into the regulatory role of miRNAs in altered gene expression in schizophrenia, we performed miRNA sequencing of hiPSC-derived neurons from monozygotic twins discordant for schizophrenia and unrelated controls (CTR). We compared the miRNA expression to differentially expressed genes (DEGs) reported for the same cells in our earlier work6. We identified dysregulation of pathways with relevance for schizophrenia and association to altered expression of miRNAs.
Results
DEmiRNAs identified in neurons of patients with schizophrenia
We performed miRNA profiling for neurons derived from five monozygotic twin pairs discordant for schizophrenia and six unrelated controls (CTR). The clinical characteristics of the patients, including their medication history and assessment of positive and negative symptom severity are described in our previous publication6 and summarized in Supplementary Table 1. In order to investigate factors related to the risk for developing schizophrenia, we compared the twins to the CTR and to illuminate factors related to the clinical manifestation of schizophrenia, we compared the affected twins (AT) to the unaffected twins (UT). The neurons were differentiated using a neurosphere-based protocol, and total RNA was harvested from the neurons after one week of maturation as previously described6,7 (Fig. 1a). The cells have been fully characterized in our earlier publication6.

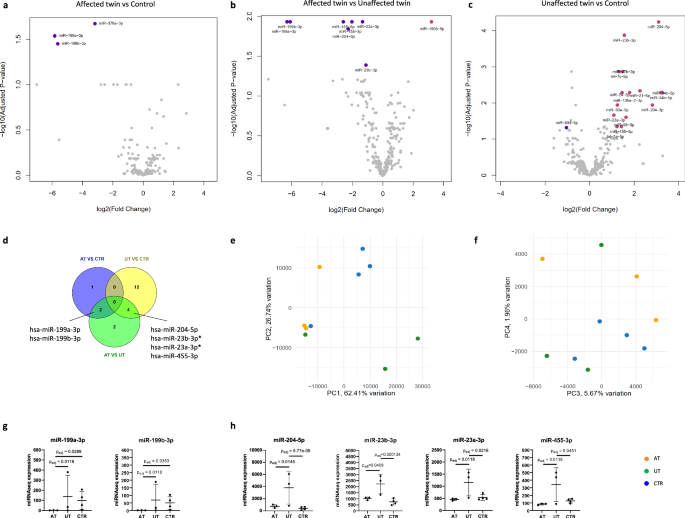
a hiPSC-derived neurons were differentiated from five monozygotic twin pairs discordant for schizophrenia and six controls. RNA sequencing (Tiihonen et al. 2019) and miRNA sequencing were conducted for one-week-old neurons. The role of DEmiRNAs in transcriptomic regulation was investigated in miRNA target prediction analysis. The DEmiRNA was compared to reference data sets. b Volcano plot showing DEmiRNAs found between the AT and CTR (Benjamini-Hochberg adjusted p < 0.05, absolute log2 fold change >1). c DEmiRNAs and their predicted target DEGs. d Pathway analysis for the target DEGs. e–h Correlation analysis between DEmiRNAs and their predicted target DEGs. e Moderate but significant inverse correlation was found between miR-199a-5p and COMT expression. f Strong and highly significant inverse correlation was observed between miR-199a-3p and KCTD16 expression. g Moderate inverse correlation was found between miR-376b-3p and CACNA2D1 expression. h Moderate inverse correlation was observed between miR-383-5p and GRIN2B expression. (For the analysis of correlation, n = 16 cell lines (5 AT, 5 UT, and 6 CTR), Spearman correlation analysis was used for the statistical comparisons, p-values were adjusted using the Benjamini–Hochberg procedure).
The DEmiRNA analysis was first performed to compare the AT to the CTR. As a result, the analysis revealed differential expression of 21 miRNAs in schizophrenia, out of which 13 were upregulated in the AT (Fig. 1b; Supplementary Table 2; absolute log2 fold change >1 and Benjamini–Hochberg adjusted p < 0.05). The top three DEmiRNAs all belonged in the miR-199 family and were downregulated in the AT (miR-199a-3p, miR-199b-3p, miR-199a-5p). We continued to explore whether any of the DEmiRNAs had an association to schizophrenia by comparing them to miRNAs identified in GWAS2,3. However, none of the DEmiRNAs were found among the schizophrenia-risk miRNAs. To study the reproducibility of our results, we also compared our data to 407 DEmiRNAs identified in hiPSC-derived neurons and NPCs from patients with childhood-onset schizophrenia (Benjamini–Hochberg adjusted p < 0.05)5. As a result, we found three DEmiRNAs: miR-378c, miR-376a-3p, and miR-1197, that were shared between the two data sets. This result provides further support for the role of these three miRNAs in schizophrenia.
We continued the DEmiRNA analyses by comparing the AT to their UT. We found no DEmiRNAs between the twins, suggesting that these cell lines represented similar gene expression profiles and a corresponding risk for developing schizophrenia (Supplementary Table 2). We also performed DEmiRNA analysis for the UT and CTR to study whether the alterations related to schizophrenia were also characteristic of the UT. Interestingly, we found no significant DEmiRNAs between the UT and CTR (Supplementary Table 2). Further investigation of the DEmiRNA expression levels in the AT, UT, and CTR revealed an overall weaker dysregulation of the DEmiRNAs in the UT compared to the AT (Supplementary Fig. 1A). This result suggests that both the AT and UT neurons reflected schizophrenia-related alterations in their miRNA profiles whereas the clinical diagnosis of schizophrenia was related to a stronger dysregulation. To investigate the miRNA expression differences between the groups in a broader context, we conducted principal component analysis (PCA). While none of the PCs fully separated the diagnostic groups, PC1 separated most of the AT from the CTR (46.25% of variation) and PC3 separated most of the UT from the CTR (14.5% of variation, Supplementary Fig. 1B). This result supported the idea that the AT differed from the CTR more than the UT.
DEmiRNAs in schizophrenia are associated with the regulation of neuronal function
Following the DEmiRNA analysis, we continued to investigate the functional significance of the DEmiRNAs. Given that miRNAs are known to target and silence specific mRNAs corresponding partially to their own sequence, we performed miRNA target prediction analysis using ingenuity pathway analysis (IPA) software. In the target prediction analysis, DEmiRNAs are paired with mRNAs based on predicted interactions from reference databases. We have previously published DEG data for the neurons used in this study and utilized these data for the pairing6. DEmiRNA-DEG pairs that showed inverse expression patterns were selected for the analysis. Altogether 21 DEmiRNAs and 232 DEGs found between the AT and CTR were analyzed. As a result, predicted interactions were found between 17 DEmiRNAs and 42 DEGs (Fig. 1c; Supplementary Table 3). We then studied the enrichment of these DEGs in specific signaling pathways by performing a pathway analysis for the target DEGs. Among the top dysregulated pathways were l-DOPA degradation and glutamate receptor signaling, both of which are closely associated with schizophrenia (Fig. 1d; Supplementary Table 4).
One of the top three DEmiRNAs, miR-199a-5p, was found to target five DEGs. Among these targets was catechol-O-methyltransferase (COMT) which participates in the degradation of dopamine and is located in the 22q11.2 region (Fig. 1c). We investigated whether the expression levels of these molecules showed strong inverse correlation in support of the predicted interaction and found a moderate but significant negative correlation between miR-199a-5p and COMT expression (r = −0.6251, p = 0.0115, Fig. 1e). In addition to COMT, miR-199a-5p was predicted to target POTEF and PPARGC1A with high confidence (Fig. 1c). PPARGC1A functions as a regulator of mitochondrial biogenesis and its upregulation has been associated with increased energy demand8. The top DEmiRNA, miR-199a-3p, was predicted to target the potassium channel subunit KCTD16 (Fig. 1c). This interaction involved a shared seed region with miR-199b-3p (CAGUAGU, Supplementary Table 3). After analyzing the correlation between miR-199a-3p and KCTD16 expression, we found a strong and highly significant negative correlation between the molecules (r = −0.8441, p < 0.0001, Fig. 1f). This result indicates that miR-199a/b-3p may participate in the regulation of potassium channel function in schizophrenia.
Several predicted interactions were also identified between miR-376 family DEmiRNAs and the DEGs. From these DEmiRNAs, the greatest number of interactions were found for miR-376b-3p that targeted five DEGs. Among these DEGs were glutamate transporter SLC6A15 and a calcium channel subunit CACNA2D1 that regulates neuronal function. A moderate inverse correlation was found between the miR-376b-3p and CACNA2D1 expression in support of a potential interaction between these molecules (r = −0.3763, p = 0.2540, Fig. 1g). Several of the dysregulated pathways in the AT contained the NMDA receptor subunit GRIN2B that was targeted by miR-383-5p. The expression levels of these molecules also showed moderate inverse correlation (r = −0.4176, p = 0.1089, Fig. 1h). Overall, the miRNA target prediction analysis revealed potential interactions between the DEmiRNAs and genes related broadly to neuronal function.
Copy number variants affecting miRNAs
After performing DEmiRNA profiling for the affected and unaffected neurons, we wanted to further investigate the genetic underpinnings of the differential expression of the miRNAs. To this end, we used our previously published copy number variant (CNV) data from the AT and UT fibroblasts to identify CNVs harboring genes coding for miRNAs6. As a result, we found several CNVs from each donor with implications for miRNA expression (Supplementary Table 5). The only CNV affecting a DEmiRNA (miR-383) was found in one of the UT but not in any of the AT. Hence, CNVs in genes coding for miRNAs did not underlie the differential expression of the DEmiRNAs identified in the AT neurons. Interestingly, three of the patients with treatment-resistant schizophrenia (TRS) and their co-twins displayed CNVs in the 22q11.2 region with a strong genetic association with schizophrenia. In case of all the TRS twins, the CNVs in this region were inherited amplifications of miR-650 and miR-5571. In addition, six miRNAs in the 15q11.1-2 region were affected by CNVs in all the TRS twins. These miRNAs were not affected by CNVs in the non-TRS patients and their co-twins. In line with our previous results6, these findings suggest that patients with TRS and non-TRS may represent different disease etiologies that stem from complex genetic factors.
Analysis of DEmiRNAs in patients with TRS
Considering the heterogeneity of our patient cohort in terms of medication history and treatment response, we decided to separately analyze DEmiRNAs for three of the patients with TRS, their UT and four CTR. First, we conducted DEmiRNA analysis for the AT and CTR and found three DEmiRNAs in the comparison (Fig. 2a; Supplementary Table 6; absolute log2 fold change >1 and Benjamini–Hochberg adjusted p < 0.05). These DEmiRNAs were all shared with the comparison conducted for all five patient lines and included the top two DEmiRNAs identified in the initial comparison: miR-199a-3p and miR-199b-3p. To study miRNAs with a role in the clinical manifestation of TRS, we continued to perform DEmiRNA analysis for the AT and UT. Surprisingly, we identified eight significant DEmiRNAs between the twins (Fig. 2b; Supplementary Table 6). Seven of these DEmiRNAs were downregulated in the AT compared to the UT and included the miR-199a/b-3p miRNAs also found between the AT and CTR (Fig. 2d, g). To investigate the association of these DEmiRNAs with schizophrenia, we compared them to the GWAS miRNAs2,3 and the Topol et al. reference data5. While none of the DEmiRNAs were found in the schizophrenia GWAS loci3 or among the CNV miRNAs (Supplementary Table 5), three of the DEmiRNAs were shared with the Topol et al. data set: miR-455-5p, miR-23a-3p and miR-23b-3p.
a–c Volcano plots showing DEmiRNAs between the AT, UT, and CTR (absolute log2 fold change >1 and Benjamini–Hochberg adjusted p < 0.05). d Venn diagram showing shared DEmiRNAs between the comparisons. Two DEmiRNAs were downregulated in the AT compared to both UT and CTR. Four DEmiRNAs were upregulated in the UT compared to both AT and CTR. Two of these DEmiRNAs were shared with the Topol et al. DEmiRNAs (marked with *). e, f PCA for the miRNA expression. PC2 separated the UT from AT and CTR whereas PC4 separated the AT from the CTR. g DEmiRNAs that were downregulated in the AT compared to UT and CTR. h DEmiRNAs that were upregulated in the UT compared to AT and CTR. (n = 10 cells lines (3 AT, 3 UT, and 4 CTR), p-values were adjusted using the Benjamini–Hochberg procedure).
After identifying several DEmiRNAs between the twins, we wanted to further explore whether the UT also displayed characteristic differences to the CTR. To this end, we conducted DEmiRNA analysis for the UT and CTR. Notably, we found 16 DEmiRNAs between the groups (Fig. 2c; Supplementary Table 6). Four of the DEmiRNAs were significantly overexpressed in the UT compared to both AT and CTR (Fig. 2d, h). In addition, all the DEmiRNAs showed overall higher expression levels in the UT compared to the AT and CTR (Supplementary Fig. 2). We hypothesized that this result could reflect the expression of compensating features in the UT neurons to overcome schizophrenia. Similar compensation has been previously reported for hiPSC-derived neurons from unaffected individuals with high genetic risk for developing schizophrenia9,10. To study whether the DEmiRNAs found in the UT had significance for schizophrenia, we compared them to the schizophrenia risk miRNAs2,3 and the Topol et al. DEmiRNAs5. While none of the DEmiRNA were found among the risk miRNAs or in the CNV miRNAs, four of the DEmiRNAs were shared with the Topol et al. reference data: miR-23b-3p, miR-27b-3p, miR-23a-3p, and miR-455-3p. In support of our hypothesis of the compensating features, all of the shared DEmiRNAs between our data and the reference data displayed inverse expression patterns.
To further study whether the UT neurons formed a phenotypically distinct group in terms of miRNA expression, we conducted PCA. As a result, the UT were separated from both AT and CTR by PC2 that explained 26.74% of the variation (Fig. 2e). In turn, PC4, corresponding to 1.96% of the variation, separated the AT from the CTR (Fig. 2f). This result suggests that the UT displayed characteristic miRNA expression patterns that distinguished them from both AT and CTR. Notably, the differences between the UT and CTR were greater than the differences between the AT and CTR.
DEmiRNAs in the UT target genes associated with cAMP signaling and synaptogenesis
Following the DEmiRNA analysis, we wanted to investigate the functional role of the DEmiRNAs in TRS by performing miRNA target prediction analysis. We first conducted the analysis for the three DEmiRNAs identified between the AT and CTR and 306 DEGs found between these lines in our previous publication6. As a result, we detected seven target DEGs for two of the DEmiRNAs (Fig. 3a; Supplementary Table 7). Given that the AT with TRS had overlapping DEmiRNAs with the five AT, the target DEGs also contained shared genes including KCTD16. We then performed miRNA target prediction analysis for the eight DEmiRNAs found between the AT and UT by pairing them with 41 DEGs identified between the twins in our previous publication6. As a result, only one of the miRNAs: miR-1908-5p, was predicted to interact with five target DEGs (Fig. 3b; Supplementary Table 7). Among these DEGs were SLC17A7 (vesicular glutamate transporter 1), NFIC and TBX1 that is located in the 22q11.2 region. These interactions were all identified as high-confidence interactions, and the expression of these target molecules was strongly and significantly negatively correlated with miR-1908-5p expression (Fig. 3c). In conclusion, miR-1980-5p was identified as a potential dysregulator of genes related to the clinical manifestation of TRS.
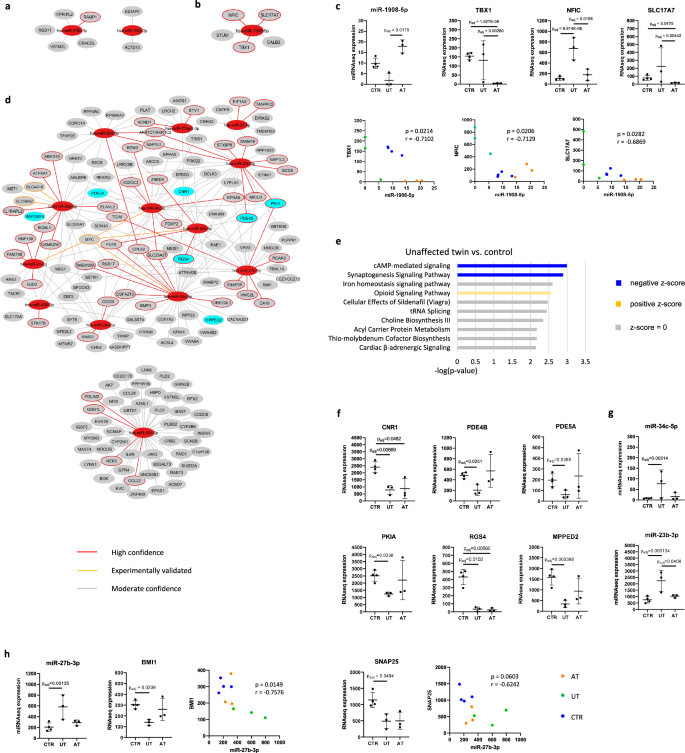
a DEmiRNA target prediction analysis comparing AT and CTR. b DEmiRNA target prediction analysis comparing AT and UT. c The expression of miR-1908 and its’ target molecules showed a strong and significant negative correlation. d DEmiRNA target prediction analysis comparing UT and CTR. e Pathway analysis for the target DEGs found in DEmiRNA target prediction analysis between UT and CTR. f The expression of genes in the cAMP-mediated signaling pathway including inhibitors of cAMP/PKA signaling. g miR-34c-5p and miR-23b-3p were predicted to target genes in the cAMP-mediated signaling pathway. h miR-27b-3p was predicted to target BMI1 and SNAP25. miR-27b-3p expression was strongly and significantly inversely correlated with BMI1 expression and strongly inversely correlated with SNAP25 expression. (n = 10 cells lines (3 AT, 3 UT, and 4 CTR), Spearman correlation analysis was used for the statistical comparisons, p-values were adjusted using the Benjamini–Hochberg procedure).
Finally, we investigated the miRNA-DEG interactions between the UT and CTR by pairing 16 DEmiRNAs identified between these groups with 1043 DEGs found in our previous publication6. As a result, we identified 243 target DEGs for 13 DEmiRNAs (Fig. 3d; Supplementary Table 7). Due to the large number of target DEGs, we proceeded to perform a pathway analysis for the DEG targets to explore biological processes regulated by the DEmiRNAs. Notably, the pathway analysis revealed cAMP-mediated signaling as the top-downregulated pathway in the UT (Fig. 3e; Supplementary Table 8). The pathway consisted of seven genes including inhibitors of cAMP/PKA signaling (PDE4B, PDE5A, PKIA) indicating increased cAMP/PKA activity in the UT neurons (Fig. 3f). We scrutinized further whether specific miRNAs were targeting the genes in the cAMP-mediated signaling pathway and discovered that miR-23b-3p formed high-confidence interactions with two cAMP signaling inhibitors: PDE4B and PKIA. This miRNA was also associated with schizophrenia in the Topol et al. reference data, providing further support for its role in schizophrenia. In addition, one of the DEmiRNAs: miR-34c-5p, was predicted to target 5/7 of the genes in the cAMP-mediated signaling pathway (Fig. 3d). While the correlation between miR-34c-5p and its’ target molecules was overall weak (Supplementary Fig. 3A), the correlation between miR-23b-3p and PDE4B and PKIA was moderate in support of the predicted interaction (rPDE4B = −0.5394, rPKIA = −0.5273; Supplementary Fig. 3B).
We also observed that miR-504-5p formed a separate network targeting 47 DEGs (Fig. 3d). Among these genes were phospholipases D1 and D2 important for cell growth and differentiation11 and IL-6 receptor with implications for inflammation. In addition, miR-504-5p was predicted to target PPP1R1B, also known as cAMP-regulated neuronal phosphoprotein (DARPP-32), which functions as a downstream molecule of dopamine D1 receptors. Increased levels of DARPP-32 are linked to elevated D1/cAMP/PKA activity and neuronal excitability12. The correlation between miR-504-5p and PPP1R1B expression was found to be moderate (r = −0.4666; Supplementary Fig. 3C). Overall, this result provided further support for increased cAMP signaling activity in the UT neurons.
Finally, we noticed that miR-27b-3p formed a high-confidence interaction with SNAP25 that was found in the synaptogenesis pathway downregulated in the UT. Among the interactions of miR-27b-3p was also a transcriptional repressor BMI1 (Fig. 3d). miR-27b has been shown to induce upregulation of 2/3 of all presynaptic proteins by targeting BMI1 and a few other transcriptional repressors13. According to the same study, miR-27b also positively impacts the expression of a large number of voltage-gated potassium channels13. miR-27b-3p was also found among the DEmiRNAs detected in the Topol et al. reference data in support of its association with schizophrenia. After analyzing the correlation of miR-27b-3p expression with the expression of its target molecules, we found a strong and significant correlation between miR-27b-3p and BMI1 (r = 0.7576, p = 0.0149) and a strong and nearly significant correlation between miR-27-3p and SNAP25 (Fig. 3h; r = 0.6242, p = 0.0603). Hence, miR-27b-3p was found as a potential regulator of increased synaptic function in the UT.
The role of cAMP signaling and synaptogenesis in neuronal function
After identifying characteristic miRNA and gene expression alterations in the UT neurons with implications for neuronal function, we wanted to further investigate differences in the electrophysiological activity of these cells. Increased synaptogenesis and cAMP signaling are both essentially linked to increased neuronal excitability suggesting that the UT neurons could display elevated activity14,15. In support of this hypothesis, we have found higher NMDA receptor-mediated activity in UT neuron-astrocyte co-cultures compared to AT co-cultures in our previous publication16. Furthermore, a recent study using neurons derived from monozygotic twins discordant for schizophrenia showed that the UT neurons displayed higher activity on MEA compared to AT and CTR neurons9.
To investigate differences in neuronal function, we prepared co-cultures of NGN2-induced neurons and rat astrocytes and performed electrophysiological measurements using microelectrode array (MEA) (Fig. 4a). These cultures are known to produce synchronous network level activity by four weeks of maturation. Full characterization of these cultures has been reported in our previous publication16. After six weeks of maturation, the UT neurons started to exhibit, on average, higher activity than the AT and CTR neurons, in line with our hypothesis. However, the difference in mean firing rate (MFR) was highly variable within the groups (Fig. 4b). Interestingly, we noticed a lack of plateau in the network burst frequency (NBF) in the AT cultures, whereas the network burst duration (NBD) was highly variable between the AT cell lines (Fig. 4c, d).
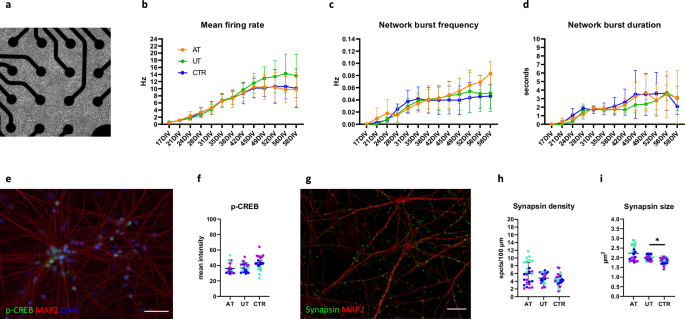
a Co-cultures plated on MEA. b Mean firing rate measured across eight weeks of maturation. The UT lines displayed, on average, a higher mean firing rate than the AT and CTR from six weeks onward. c Network burst frequency measured across eight weeks of maturation. d Network burst duration measured across eight weeks of maturation. d, f The AT, UT, and CTR neurons displayed similar p-CREB expression levels at eight weeks of maturation (scale bar = 50 μm). g, h The AT, UT, and CTR neurons displayed similar densities of synapsin puncta after eight weeks of maturation. i The average size of the synapsin puncta was significantly elevated (p = 0.0326) in the UT compared to the CTR neurons (scale bar = 20 μm). (n = 3 AT, 3 UT, and 3 CTR). For b, c, data were collected from three independent experiments. For f–b, data were collected from one experiment. The statistical comparisons were performed with t-test or Mann–Whitney U test. Normal distribution of the data was verified with Shapiro–Wilk test. The colors of the data points represent results from different cell lines.
To study cAMP/PKA signaling activity in the cultures, we quantified p-CREB expression in the neurons at eight weeks of maturation. We found no differences in the p-CREB expression between the groups suggesting that the differences in neuronal function were not caused by altered cAMP signaling activity (Fig. 4e, f). In order to study presynaptic protein expression in the cultures, we quantified the density of a synaptic vesicle protein, synapsin, in the eight-week-old cultures. However, we found no differences between the groups (Fig. 4g, h). Instead, we found a significant increase in the size of the synapsin puncta in the UT neurons compared to the CTR neurons indicating increased activity of individual synapses in the UT cultures (p = 0.0326, Fig. 4i). Although the presynaptic puncta size was also elevated in the AT neurons, this difference did not reach significance due to variation between the AT lines (Fig. 4i). In summary, a trend toward higher neuronal activity was observed in the UT neurons in support of our hypothesis. This difference could not be attributed to elevated cAMP singnaling activity but was accompanied by increased synapsin puncta size.
Discussion
In this study, we performed miRNA profiling for hiPSC-derived neurons derived from monozygotic twins discordant for schizophrenia. In the initial analysis, we investigated cells from five twin pairs with heterogenous backgrounds in terms of medication and found 21 DEmiRNAs between the AT and CTR. Through miRNA target prediction analysis, we identified dysregulated signaling pathways related broadly to neuronal function in schizophrenia. We found a predicted interaction between miR-199a-5p and COMT that participates in the degradation of dopamine. In addition, two other miRNAs in the same family: miR-199a-3p and miR-199b-3p, were found to target a potassium channel subunit KCTD16. Although differential expression of miR-199 family miRNAs has been previously observed in schizophrenia17, their role in the regulation of brain function has not been elaborated17. Instead, these miRNAs have been consistently shown to modulate cellular responses to glucose in the context of diabetes18,19,20. While upregulation of these miRNAs has been linked to increased glucose concentrations18, miR-199-5p knockout has been shown to reduce cellular glucose tolerance20. Hence, the differential expression of miR-199 family miRNAs may reflect impaired glucose metabolism in the affected neurons.
In order to study genetic factors underlying the differential miRNA expression in the AT, we used our previously published CNV data of the AT and UT cells to identify CNVs in genes coding for miRNAs6. We found several CNVs that were shared between the patients with TRS but were not found in the patients with non-TRS. This result is in line with our earlier studies showing characteristic transcriptomic and functional alterations in hiPSC-derived brain cells from patients with TRS6,16,21. To investigate miRNA expression patterns in TRS, we conducted a separate DEmiRNA analysis for three of the AT with TRS, their UT, and four CTR. Surprisingly, we identified several DEmiRNAs in the UT that were upregulated compared to both AT and CTR. In addition, several of the DEmiRNAs that were upregulated in the UT have been previously found downregulated in schizophrenia5. These results could reflect the presence of compensatory features in the UT neurons to overcome schizophrenia. Such compensatory features have been previously found in neurons derived from unaffected individuals with a high genetic risk for developing schizophrenia, although the genetic basis of these features has not been elaborated9,10. In support of the reproducibility of the findings, we have observed greater differences between the UT and CTR cells compared to the AT and CTR cells also in our previous publications focusing on the transcriptomic characterization of hiPSC-derived neurons and astrocytes from these donors6,21.
In our study cohort, two out of five twin pairs had a family history of schizophrenia indicating that these individuals carried a genetic risk for the disorder6. Given that monozygotic twins differ on average by 5.2 early developmental mutations22, differential accumulation de novo mutations between the twins could have predisposed one of the twins to a higher risk for developing schizophrenia. In turn, it has been shown that an increasing burden of harmful mutations in an organism tends to promote the emergence of mutations with beneficial effects23. Hence, an increasing genetic risk for schizophrenia may co-develop with an increasing attempt to compensate for the risk. In addition to mutations, epigenetic factors may underlie the differences observed between the twins. It is known that small RNAs function as epigenetic molecules that are capable of transmitting traits across generations24. Whether similar transmission occurs during hiPSC reprogramming has not been verified. Nevertheless, epigenetic transmission of environmental trauma, an adaptation mechanism, or the effect of medication through small RNAs could explain the differences observed between the monozygotic twins that represent the same genetic background.
Among the upregulated miRNAs in the UT were miR-34 family miRNAs that regulate cAMP/PKA signaling25. Importantly, cAMP/PKA signaling functions at the crossroads between the NMDA receptor and dopamine signaling, both of which are thought to be affected in schizophrenia12. In addition, miR-34b/c has been identified among the most upregulated miRNAs during the differentiation of midbrain dopaminergic neurons. Impressively, upregulation of miR34b/c was found to increase dopaminergic differentiation by 60%26. In addition, miR-23b-3p was identified as a potential regulator of cAMP signaling activity. Both miR-23b-3p and miR-34c-5p targeted PDE4B, which is an essential regulator of neuronal excitability15 and has been previously associated with anxiety27 and depression28. Finally, miR-27b-3p was found to target a transcriptional repressor BMI1 that regulates the expression of presynaptic proteins and voltage-gated potassium channels13. All in all, the UT displayed broad gene expression alterations with relevance for schizophrenia and implications for increased neuronal function.
In line with our hypothesis, a recent study using hiPSC-derived neurons from monozygotic twins discordant for schizophrenia showed increased activity of the UT neurons compared to the AT and CTR neurons9. In addition, we have previously shown that hiPSC-derived neuron-astrocyte co-cultures from the UT display elevated activity compared to co-cultures from the AT16. After performing electrophysiological recordings of our neurons co-cultured with rat astrocytes, we found a trend toward elevated activity in the UT cultures. However, this elevation could not be attributed to elevated cAMP signaling activity. Given that the overexpression of PDE4B and DARPP-32 are particularly linked to D1 receptor-mediated increase in cAMP signaling, elevated neuronal activity could be better observed in deep-layer cortical neurons that receive D1 receptor-mediated dopaminergic input12. The lack of differences in neuronal activity between the AT and CTR suggests that other factors than intrinsic excitability of the excitatory neurons predispose the AT cells to neuronal malfunction. Indeed, we have shown in our earlier study that hiPSC-derived astrocytes from the AT attenuate the activity of neurons in co-cultures16. In addition, other studies have shown that reduced neuronal activity in schizophrenia may be associated with increased inhibition29.
After investigating the expression of presynaptic puncta in the cultures, we found a significant increase in the presynaptic puncta size in the UT neurons compared to the CTR neurons indicating increased strength of individual synapses. Given that a similar, non-significant increase was observed in the AT neurons, this phenomenon could also be a pathological feature related to the risk of developing schizophrenia. Overall, our results add to the evidence suggesting that unaffected individuals with a high genetic risk for developing schizophrenia may possess protective features against the disorder. Identification of the origin and mechanisms of these features could inspire the development of new treatments for schizophrenia.
Materials and methods
hiPSC lines
hiPSC lines from five monozygotic twin pairs discordant for schizophrenia and six unrelated controls were used in this study (Supplementary Table 1). More detailed information of the clinical characteristics of the patients is available in our previous publication6. This project has been approved by the Ethics Committee of the Helsinki University Hospital District. Skin biopsy-derived fibroblasts were collected from patients after obtaining informed consent. The expansion, reprogramming, and karyotyping of the cells have been described previously6. The hiPSCs were maintained in Essential 8 medium (E8, A15169-01, Gibco)) and passaged weekly with 0.5 mM EDTA.
Differentiation of neurospheres
Neurospheres were differentiated as previously described6,7. The neural induction was performed by culturing hiPSCs in neural differentiation medium containing 1:1 DMEM/F12 (21331-020, Gibco) and Neurobasal medium (NBM (21103-049, Gibco)), supplemented with 1% B27 without vitamin A (12587001, Gibco), 0.5% N2 supplement (15410294, Gibco), 2 mM GlutaMAX (35050-038, Gibco), 50 IU/ml penicillin, 50 μg/ml streptomycin (15140122, Thermo Fisher Scientific), 10 μM SB431542 (S4317, Sigma) and 200 nM LDN193189 (SML0559, Sigma). After 10 days of induction, neural progenitor cells arranged in rosettes were picked and transferred to ultra-low attachment plates. The cells were cultured in neural sphere medium containing 1:1 DMEM/F12/NBM, 1% N2 supplement, 2 mM GlutaMAX, 50 IU/ml penicillin, 50 μg/ml streptomycin and 25 ng/ml bFGF (100-18B, Peprotech). The spheres were manually cut every week until 5 weeks of differentiation. The cells were then plated for maturation on Polyornithine (Sigma, P3655)/Matrigel (1:100, Corning) coated plates at 50,000 cells/cm2 density. The neurons were maintained for one week before harvesting.
Differentiation of NGN2 neurons
The NGN2-induced neurons were differentiated as previously described16,30. The hiPSCs were infected with 2 lentiviruses: Tet-O-NGN2-PURO and FudeltaGW-rtTA (>109 IFU/ml, Alstem), using MOI = 10. The differentiation was started by adding 2 μg/ml Doxycycline hyclate (2431450, Biogems) in Essential 8 medium. On day 1, N2 medium (DMEM/F-12, 1:100 GlutaMAX, 1:100 N2 supplement and 1:67 20% Glucose) was prepared and supplemented with 10 μM SB431542, 100 nM LDN193189, 2 μM XAV939 (2848932, Biogems) and 2 mg/ml Doxycycline. On day 2, the medium was changed to N2 medium supplemented with 1:2 of the day 1 supplement as well as 5 μg/ml puromycin (100552, MP Biomedicals) to select for infected cells. On day 3, the cells were fed the same media as on day 1. The final plating of the neurons was conducted on day 4. To this end, the cells were then detached with Accutase (11599686, Gibco) for 5 min and centrifuged at 300 rcf for 4 min. Neurons were plated 1:1 with rat astrocytes on plates coated with 50 μg/ml Poly-l-ornithine and Matrigel using 60,000 neurons/cm2 for immunocytochemistry (ICC) and 60,000 neurons/well for microelectrode array (MEA). Neurons were cultured in Neural maturation medium (NBM, 1:100 GlutaMAX, 1:200 MEM NEAA (11140-035, Gibco), 1:67 20% Glucose, 1:50 B27 without vitamin A) supplemented with 10 ng/ml BDNF (450-02, PeproTech), 10 ng/ml GDNF (450-10, PeproTech) and 10 ng/ml CNTF (450-13, PeproTech) from day 4 onward. On day 7, proliferating cells were eliminated from the cultures using 10 μM FUDR (4659, Tocris). During neuronal maturation, ½ of the medium was changed three times a week.
Rat astrocytes
Rat cortices were extracted from Wistar rat embryos at E17–1831. The purified cortical cells were plated on T75 flasks with 20 ml DMEM High Glucose (ECB7501L, Euro Clone) supplemented with 10% fetal bovine serum (10500-064, Gibco), 1% l-Glutamine (BE17-605E, BioWhittaker) and 1% Penicillin/Streptomycin (DE17-602E, BioWhittaker). After 7–8 days, contaminating microglia and oligodendrocytes were removed from the cultures by shaking the flask at 240 rpm for 6 h32. The cells were split using Trypsin (0.05%)–EDTA and the media was changed once every 2 weeks. The rat astrocytes were plated with hiPSC-derived neurons 1:1 using 60,000 astrocytes/cm2 for ICC and 60,000 astrocytes/well for MEA.
Small RNA library construction and sequencing
Total RNA was extracted using a mirVana RNA extraction kit (Thermo Fisher Scientific), and the quality and quantity of the small RNA extractions were assessed using the Agilent Bioanalyser 2100 with a small RNA assay Chip and RNA Nano 6000 assay Chip (Agilent Technologies, Mulgrave, VIC, Australia). Small RNA library preparation was conducted using the Ion Total RNA-Seq kit v2 (Life Technologies). After small RNA enrichment, ligation of adapters containing a unique index barcode was performed (Ion Xpress™ RNA-Seq Barcode 1–16 Kit, Life Technologies) to allow pooling of libraries during sequencing. The libraries were constructed according to the manufacturer’s instructions. First, the RNA samples were reverse-transcribed to cDNA using adapter-specific primers. Secondly, the cDNA fragments were size selected from 94 to 200 nt (the length of the small RNA insert including the 3′ and 5′ adapters) using a Magnetic Bead Purification Module (Life Technologies). Finally, PCR amplification was performed, followed by a library clean-up step using nucleic acid beads (Life Technologies). The quality and quantity of the libraries were verified using Agilent 2100 Bioanalyser and DNA 1000 assay kit (Agilent Technologies). The libraries were pooled equally and amplified clonally onto Ion Sphere™ Particles (ISPs) by Ion 540™ Kit-Chef and loaded in the Ion Chef™ Instrument (Life Technologies). ISPs loaded with libraries were sequenced in the Ion Torrent Ion S5™ Sequencing System using Ion 540 chips (Life Technologies). The read alignment was performed using TMAP on the Torrent Suite Server and the reads were mapped to miRBase v. 20. The mapped reads were normalized to reads per million, and miRNAs with a minimum of 30 normalized read counts across all samples were used for ANOVA analysis.
Analysis of differentially expressed miRNAs
Differential expression analysis of the miRNAs was conducted using the DESeq2 sRNAde tool of the sRNA toolbox33. miRNAs with a Benjamini-Hochberg adjusted p-value < 0.05 and log2fold change >1 were considered differentially expressed. Normalized expression values from DEseq2 were used for the statistical analysis and graphs. The Volcano plots and PCA plots were generated using RStudio. The visualization of the DEGs and DEmiRNAs with Venn diagrams was done with Venny 2.134. The visualization of the DEmiRNA-DEG network was done with Cytoscape 3.10.235. miRNA target prediction and pathway analyses were performed using Ingenuity Pathway Analysis software (IPA; QIAGEN). For miRNA target prediction, DEmiRNA and DEG datasets were paired using a TargetScan algorithm that predicts high confidence, moderate confidence, and experimentally observed interactions between miRNAs and mRNAs. The prediction was made using data from four databases: TarBase, miRecords, Ingenuity Knowledge Base and Ingenuity Expert Findings. Finally, we performed expression pairing to the identified miRNA-DEG pairs and selected pairs with inverse expression patterns for further investigation. The selected target DEGs were finally subjected to IPA core analysis using cutoff values of log2 fold change >1 and Benjamini-Hochberg adjusted p < 0.05.
Immunocytochemistry
For ICC staining, the cells were fixed with 4% paraformaldehyde for 20 min and washed twice with PBS. The cells were permeabilized with 0.25% Triton X-100 in PBS for 1 h. Unspecific binding sites were blocked using 5% normal goat serum (NGS) for 1 h. Primary antibodies against MAP2 (chicken, 1:500, Ab 92434, Abcam), Synapsin Oyster 650 (mouse, 1:500, 106011C5, Synaptic Systems) and phospho-CREB (rabbit, 1:500, CST-9198S, Cell Signaling Technologies) were used. The primary antibody mixture was prepared in 5% NGS and incubated overnight at +4°C on a shaker. The cells were washed 3× with PBS. Secondary antibodies including Goat anti-chicken Alexa Fluor 568 (A11041) and Goat anti-rabbit Alexa Fluor 488 (A11008) were used. The secondary antibodies were diluted 1:400 in PBS and incubated for 2 h with the cells. Finally, the cells were washed 2× with PBS and 1× with DAPI (1:2000, Sigma) for 10 min. The samples were mounted using Fluoromount-G (Thermo Fisher Scientific).
Imaging and image analysis
For the analysis of p-CREB expression and synaptic density, 2D images were taken with an EVOS M5000 fluorescence microscope. The analysis was conducted with ImageJ (NIH). First, neurons stained with MAP2 were segmented using the default threshold option, after which the p-CREB intensity in the segmented areas was measured using the Measure function. For the analysis of the synapses, the images were filtered using the Subtract background function to enhance spot-like structures. The default threshold option was used to segment the synapsin spots. The neurites were then segmented using the default threshold option. The neurites were used as a mask to select the synapsin spots that co-localized with the neurites using the Image calculator function. The neurite length was measured using the Skeletonize and Analyze particles functions, and the number of synapsin spots was measured using the Analyze particles function.
Microelectrode array
The electrophysiological activity was recorded from neuron-astrocyte co-cultures with Maestro Edge MEA system using AxIS Navigator software and 24-well CytoView plates containing 16 electrodes (Axion Biosystems). The recordings were performed at 37 °C in a 5% CO2 atmosphere. To start the measurements, the samples were placed in the MEA system, and the temperature and CO2 were allowed to stabilize for 10 min. Before the recording was started, the spike threshold was set to 5× the standard deviation of the estimated noise in the AxIS Navigator software. The baseline activity was then measured for 10 min. The burst detection was conducted using the Neural Metric Tool (Axion Biosystems). The minimum number of spikes per burst was set to 5 and the maximum inter-spike interval within a burst was set to 100 ms. The NB detection was conducted with the Envelope algorithm using a threshold factor 2 and a minimum inter-burst interval 100 ms. The minimum number of electrodes in NB was set to 50% and a burst inclusion value was set to 50%.
Statistical analysis
The statistical analysis was conducted with GraphPad Prism 9. For the analysis of correlation, Spearman’s correlation analysis was used. For the analysis of MEA data and ICC characterization, paired t-test or Mann–Whitney U test was used. The normal distribution of the data was verified with the Shapiro–Wilk test. The error bars in the graphs represent mean and standard deviation.

Responses