Mobilizing power quality and reliability measurements for electricity equity and justice in Africa
Main
Electricity vulnerability and inequity pose critical challenges in sub-Saharan Africa (SSA), where nearly 600 million people lack access to reliable electricity services1. Policy measures to close SSA’s electricity access gaps have traditionally targeted rural areas to reduce energy poverty, while ignoring the rapidly ageing urban grid networks with widespread power quality and reliability (PQR) issues. PQR issues in urban SSA have been compounded by a surge in migration, as an estimated 238 million people now live in informal urban settlements2. With 60% of SSA’s population projected to live in urban megacities like Accra, Nairobi and Lagos by 2030, a failure to quantify and address PQR issues in urban SSA may increase energy poverty and put the region further behind in meeting its developmental targets for eradicating poverty, industrialization and decarbonization.
Given the urgency, we ask: how can researchers and practitioners quantify PQR inequities in urban SSA? How can PQR data enable policymakers to identify households, neighbourhoods and locales where PQR inequities are probable and design policy mechanisms for allocating sustainable electricity infrastructures to these spaces?
Numerous scientific models have emerged in the energy field to address questions on electricity vulnerability and to quantify PQR inequities within the African context. For example, there is extensive literature on energy poverty, which has developed to interrogate the nature and scale of poverty in SSA, all of which have led to the design of composite indices to measure energy poverty3,4. From an engineering perspective, globally established PQR metrics from the field of power systems, such as the system average interruption duration index (SAIDI), system average interruption frequency index (SAIFI) and voltage level/quality events, have been leveraged to assess PQR in Africa5,6. Normatively, energy justice (EJ) theories (distributive, recognitional and procedural justice) and capability theory (CA) have become prominent frameworks for articulating and answering questions about the impacts of electricity inequity on well-being7. Combined, EJ and CA have spurred several multidimensional electricity vulnerability methodologies focused on how geographical disparities in energy systems intersect with socio-economic and built formation inequities to reify domestic energy vulnerability in urban areas8,9.
Beyond scientific articulations of energy inequities, global metrics such as the Multi-Tier Framework under the Energy Sector Management Assistance Program of the World Bank have been developed as benchmarks for quantifying the types of and growth in access to modern energy services10. These models have been instrumental in unpacking the multidimensional nature of energy poverty and in teasing out the overlaps between poor reliability and socio-economic outcomes on the continent. Although these vulnerability methodologies and metrics are, indeed, valuable, they remain limited for several reasons.
First, composite indices such as the Multi-Tier Framework or those generated in the energy poverty and engineering domain often rely on recall-based surveys and proxies such as changes in electricity generation. Yet, such data sources are unreliable, as both surveys and generation proxies fail to granularly capture the nature, scale and variation in the quality of supply. For example, many PQR impacts are not directly perceived by customers and are, therefore, impossible to capture in recall-based surveys. Also, energy generation is a crude proxy for PQR because it does not directly correspond to energy delivered or capture the quality of energy delivered at customer points-of-connection. Despite their shortcomings and largely because of the scarcity of real-world data that accurately capture consumer experiences, most power system analyses in SSA continue to rely on these proxies to simulate potential patterns of poor PQR or rely on grid data from regions such as the United States and Europe, where the challenges faced by power grids differ markedly from those encountered in SSA.
Second, although EJ and capability studies connect electricity deprivations as pathways by which energy poverty cycles and urban inequities are perpetuated, like the above composite indices, they lack precise, real-time spatial and temporal measurements, which are necessary for comprehending the nature and scale of PQR inequities. Ultimately, the lack of granular, real-time PQR data from current approaches not only obscures inequities experienced by different households and neighbourhoods in urban spaces but also limits concrete proposals on how to redress these inequities.
To answer our research questions and address the existing gaps in the literature, we posit that direct PQR measurements are the missing piece to critical normative theories (such as EJ, CA and multidimensional energy poverty theories) that problematize electricity inequities. Our study makes the following research, policy and practice contributions. First, we propose a heuristic that combines direct measurements with EJ, CA and multidimensional energy poverty theories to identify electricity inequity. Second, we illustrate this heuristic by leveraging a large-scale longitudinal ground-truth PQR dataset from an electrical grid in a low- or middle-income region, namely Accra, Ghana. This dataset not only captures critical patterns of outages and voltage quality across various timescales but also addresses a core industry and policy challenge, as the lack of real-time visibility across low-voltage networks has long inhibited the ability of utilities and regulators to efficiently operate and improve electricity systems, rendering them as black boxes vulnerable to failure with a high societal cost.
We found significant PQR disparities within and across districts in Accra. We make pivotal theory-to-practice leaps by revealing the different scales of PQR injustice, its intersections with socio-economic realities and its impacts on domestic capabilities. By combining PQR measurements with EJ, CA and multidimensional energy poverty theories, we were able to quantify the complex scale of inequities in current energy systems and proffer policy tools that address these inequities and support an equitable energy transition.
A multidisciplinary heuristic for quantifying PQR inequities
Recent advances in remote-sensing technologies and machine-learning algorithms have begun to transform how we can gather, analyse and visualize PQR data11, thus creating a potential to quantify both the precise scale and scope of PQR inequities. Leveraging this sensing approach, we propose a heuristic that uses direct measurements of SAIDI, SAIFI and voltage magnitude to identify electricity inequity. Specifically, we posit that direct PQR measurements facilitate three fundamental connections with the EJ, CA and multidimensional poverty literature (Fig. 1).

The linkages depicted between the concepts do not suggest causality. Instead, pathways 1 and 2 represent the potential impacts of poor PQR on electricity justice and domestic capabilities. Pathway 3 suggests that multidimensional poverty may influence the severity of certain demographics’ proclivity to poor PQR, and pathways 3a and 3b show the probable domino effects of these on both justice and capabilities.
First, PQR measurements could strengthen EJ tenets (distributive, recognition and procedural justice) by providing methodological and representational insights into the distributive and spatial dimensions of PQR inequities (for example, by providing an understanding of place-specific inequities by identifying which neighbourhoods lose or gain). Measuring PQR enables the recognition of the opportunities and costs associated with electricity infrastructure by making tangible what it entails to be left behind in terms of access to quality electricity and by unmasking the social costs of poor PQR12. It also offers procedural insights into how institutional and operational processes and structures around electricity service provision that contribute to observed PQR disparities may be contested or reimagined.
Second, PQR measurements could support the CA approach by providing a direct quantification of PQR impacts on functions (for example, activities such as cooking) and capabilities (functions an individual has the freedom to choose from, such as appliance usage) to undertake domestic activities. These data allow us to disentangle the temporal impacts (daily and seasonal patterns) of PQR on everyday energy use in the home13. We could also assess how past and present electricity infrastructure inequalities, if left unaddressed, may deter household participation in proposed energy-transition futures (for example, capacity to adopt electric cooking).
Third, PQR measurements are vital for assessing the role of multidimensional poverty in increasing electricity inequities. Measures of multidimensional poverty consider the many intersecting deprivations that poor people experience and offer clear priorities for addressing poverty that are beyond monetary deprivation. The global multidimensional poverty index (MPI) constructs deprivation profiles for households from ten indicators spanning education, standard of living and health. Unlike other indices, such as the wealth index, the MPI is a more robust analysis of poverty, as it shows who is poor, where they live and what deprivations debar people from attaining the well-being they deserve14. Correlating PQR inequities with multidimensional poverty allows us to consider income poverty alongside other forms of deprivations (such as poor housing, informality, poor nutrition, lack of education, distortions in electricity market infrastructure allocation and prices) that overlap to perpetuate electricity inequity. For example, it is estimated that 80% of those who lack access to electricity in SSA live in informal settlements and that these individuals or households spend more than 30% of their income on energy services2.
As an illustration, we apply our framework to our case study context of Accra, Ghana. This demonstrates how our framework could lead to deeper insights into electricity inequity, and more importantly, it provides a praxis towards equitable urban electricity futures.
Applying our framework to a real-world context
Our case context is Accra, Ghana. Accra is a microcosm of the urbanization disparities prevalent in SSA. According to the Accra Metropolitan Area (AMA), nearly one-third of Accra residents live in one of 265 informal settlements. This group also represents a high proportion of those who experience multidimensional poverty2. In Accra, the main supplier of electricity is the Electricity Company of Ghana (ECG). The ECG’s grid network is organized into eight regions, which are further divided into districts. We explored 5 years of PQR data collected by nLine as part of the Millennium Challenge Corporation’s (MCC’s) power compact with Ghana. To delimit our data analysis, we used 1 year’s worth of data (219 million 2-min data points in 2023) collected from 14 ECG districts (with 413 ‘sites’). In nLine’s sensing methodology, a site is defined as a unit of visibility and could be a single distribution transformer, a low-voltage feeder or a community. Below, we first describe the distributive dimensions of PQR inequities across the 14 districts. Second, we show how multidimensional poverty intersects with PQR to impact households’ electricity vulnerabilities. Third, we explain how the observed PQR inequities may impact domestic capabilities.
The distributive dimensions of PQR inequities in Accra
Our analysis of PQR metrics reveals significant PQR disparities across districts where nLine sensors were deployed. Korle-Bu and Roman Ridge experienced the shortest average duration and frequency of outages, whereas Nsawam, Ablekuma, Bortianor and Mampong faced the longest and most frequent outages. The 2023 district-level SAIDI and SAIFI are shown in Table 1.
To further understand PQR disparities in Accra, we also assessed whether sites within a district (which would have the same grid maintenance team) had PQR disparities. Dansoman exhibited notably poorer voltage quality, averaging 3 h of undervoltage per day, which is 2 to 6 times higher than other districts (Supplementary Fig. 3). Hence, we decided to focus on this district for our intradistrict illustration. We compared the grid experience of the 49 sites (distribution transformers) in Dansoman district using the hour-of-week voltage profiles for every site (Fig. 2).
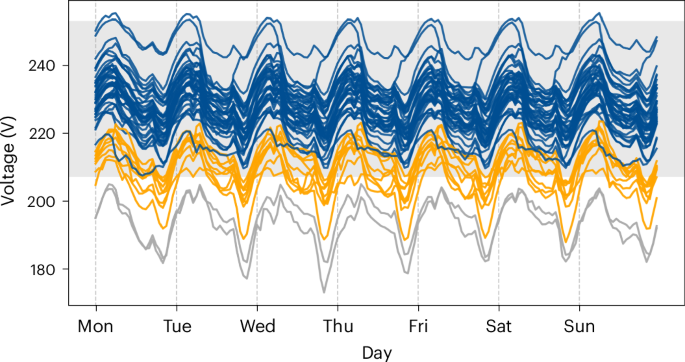
The grey band is the region of acceptable or useful voltage magnitude that is ±10% of the nominal voltage. Each line represents one transformer. The grey lines are the voltage profiles of transformers whose voltage was constantly below the nominal range throughout 2023. The orange lines represent the transformers that delivered a nominal voltage during some parts of the day and for which the voltage dropped below the nominal range during peak load. Finally, the blue lines represent transformers whose voltage was constantly within the nominal range throughout 2023. Within the same district, different transformers delivered different voltage qualities to customers, and these inequalities were consistent at different times of the day. Therefore, they were not affected by time-of-day changes in load.
The voltage inequalities among the transformers within Dansoman district were persistent and not affected by the time of the day. This disparity in voltage levels across sites within a district under the same institutional management indicates that there were possible inequities in the quality of electricity supply, governance or infrastructure within the district. Further, these intradistrict PQR disparities highlight the need for regulatory bodies to monitor and enforce service quality standards across all segments of the community. However, these data call for nuance, and they provoke questions as to whether the observed disparities are institutional or related to the socio-economic characteristics of the neighbourhoods (in other words, are PQR needs within a district recognized and prioritized in relation to socio-economic differences?).
Intersections of poor PQR and multidimensional poverty in Accra
To determine how multidimensional poverty intersects with electricity service provision, we compared our PQR maps with the AMA-generated multidimensional poverty hotspot index. See Supplementary Table 1 for a detailed breakdown of the AMA MPI. (We refrained from performing a direct correlation analysis because of the different levels of aggregation between Ghana’s available MPI data and nLine’s PQR metrics.) We identified areas with the highest and lowest multidimensional poverty levels and hypothesized that the PQR metrics would show strong relations with these poverty index classifications. In the analysis of the AMA MPI15, regions with elevated multidimensional poverty indices were identified, including Chorkor, Korle Gonno, Mpoase, Mamprobi, Nima, Sodom & Gomorrah, Jamestown and Sabon Zongo. Conversely, areas exhibiting the lowest levels of multidimensional poverty included Roman Ridge, Dzorwulu, East Legon and Labone. Notably, several of the high-poverty regions coincided with Accra’s informal settlements. We identified sites (Fig. 3a,b) in these areas where nLine sensors were deployed and compared the PQR metrics (monthly SAIDI, SAIFI and average daily hours of undervoltage) between these two groups of sites (high-poverty areas versus low-poverty areas)

a,b, Spatial comparison of SAIDI in Accra (a) with the AMA MPI (b). Certain hotspots have a visibly high SAIDI and a high MPI index, for example, the areas around Jamestown on the south-east of the map; b reproduced with permission from ref. 15, Ghana Statistical Service.
Throughout 2023, high-poverty areas according to the AMA MPI (Fig. 3a,b) experienced significantly higher outage durations and average daily hours of undervoltage per month than low-poverty areas, with high-poverty areas experiencing up to ten times more hours of outage in some months than low-poverty areas, further disadvantaging high-poverty areas. These comparisons are also shown in Fig. 4a–c, demonstrating the PQR inequalities between low-poverty areas and high-poverty areas. This disparity is especially pronounced for voltage quality (Fig. 4c). This comparison shows the strong relation between an area’s multidimensional poverty and the quality and reliability of the power it receives. Situating this finding within the context of transitions, areas with higher multidimensional poverty rates will more probably be left behind in low-carbon transitions because of the constrained grid capacity in these areas. Policymakers could use these insights from PQR data to channel targeted infrastructure investment to areas affected by electricity inequities.

a, Monthly SAIDI for low-poverty areas verus high-poverty areas in Accra, 2023. Higher SAIDI values indicate less reliability. The high-poverty areas experienced longer durations of outages than low-poverty areas for every month of 2023. b, Monthly SAIFI for low-poverty areas versus high-poverty areas in Accra, 2023. Higher SAIFI values indicate less reliability. The high-poverty areas experienced a higher number of outages than low-poverty areas for ten out of the 12 months in 2023. c, Average daily hours of undervoltage per month for low-poverty areas versus high-poverty areas in Accra, 2023. The high-poverty areas experienced significantly more daily undervoltage hours (at least four times) than low-poverty areas for every month of 2023.
Unravelling the potential impacts of PQR on household capabilities
To assess the potential impacts of PQR on household capabilities, we analysed PQR values during peak demand hours (1700 h to 2300 h), the primary period when households rely on consistent electricity for essential activities like lighting, charging and cooking. During peak periods, high-poverty areas had unusable power for 58% of the time, which is approximately twice the amount of time low-poverty areas experienced unusable power (30% of the time, Table 2).
From this analysis, we can see how PQR data could be used to determine where and how electricity-dependent domestic functions occur and disproportionately affect those already vulnerable. Crucially, these data could help unravel the extent to which variations in PQR create differences in the capacity to undertake domestic work and how this variation may play a role in exacerbating social disparities or impact the adoption of new technologies (such as electric cooking).
Discussion
Equitable and resilient energy grids are crucial for SSA’s socio-economic transformation and energy transition. Yet, formal and wealthier neighbourhoods receive more reliable and higher quality power than those in informal or poorer neighbourhoods. Although the implications of widespread inequities for SSA’s urban megacities have been widely discussed, because of the prohibitive cost of monitoring power quality, measurements and data on the scale of the disparities remain virtually non-existent. By leveraging innovative remote-sensing and data techniques, alongside justice, capability and MPI frameworks, we have mapped, quantified and disaggregated the complex urban electricity disparities across Accra. We have highlighted the probable impacts of these electricity infrastructure and provision disparities on the daily and equitable use of electricity.
As echoed by other spatial justice studies8,16 and evidenced in this study, districts and neighbourhoods with poor PQR probably correlate with those experiencing multidimensional poverty and lacking other key infrastructural services necessary for well-being. Poor PQR and its erosion of domestic capabilities is a broader symptom of systemic deprivation, and the overall lack of well-being faced by marginalized communities. However, one could also argue that existing structural socio-economic inequalities in these communities may be the principal factor responsible for fuelling, (re)producing or even sustaining electricity marginality. Regardless of which factor pre-empts the other, it is clear that electricity injustice in the form of poor PQR can thrive because of a repeated narrative that low-income and informal communities contribute less to society. Such narratives bring two things into focus: (1) the exclusion of these communities in current and future energy-transition imaginaries and (2) how such exclusions may become a central point of contention for SSA’s industrialization and decarbonization future. However, how can policymakers overcome these two challenges? We believe that our analytical framework (PQR measurements combined with normative justice frameworks) is a vital intellectual starting point for driving advocacy around electricity equity and enabling policy reforms in SSA. This is because many grid modernization investments are underway, and without grid visibility, areas of infrastructural deprivation, inequities and wide-scale system instabilities will continue to remain unknown. Energy ministries and grid investors, such as development finance institutions, must provide funds to offset the upfront investment and perceived high transaction costs around the use of sensors to support grid audits and the subsequent design, implementation and evaluation of new electrification investments (life-cycle approach). Below we describe the different ways in which our analytical framework has and could be administered in collaboration with energy stakeholders to audit the grid, generate key performance indicators (KPIs) of power-quality equity and support inclusive electricity access in African countries. This is not a comprehensive list of the potential applications of PQR data. Rather this is drawn from observations from over 4 years of work done by the authors.
First, PQR data could aid the visualization and recognition of populations on the frontlines of PQR inequities and could be leveraged to ‘catalogue’ the spatial forms that these inequities take to inform equitable energy interventions. In Uganda, the Spotlight Kampala team leveraged PQR measurements to assess electricity equity between formal and informal settlements across Kampala17. From a policy standpoint, PQR data could foster recognition and the need for equitable policies in informal or peripheral settlements, which are often not recognized as spaces for formal electricity provision but maligned and disrespected in public discourses as places where electricity theft occurs. PQR data could also enable policymakers and justice advocates to identify multi-scalar institutional inequality and governance trends prevalent in informal or poor communities that may be disguised or missed when looking at macro-level infrastructure trends (for example, the exclusion of such communities in electricity infrastructure planning).
Second, as several countries across SSA plan to spend hundreds of billions of dollars on implementing Net Zero Transition initiatives (by rolling out distributed generation and storage, electric vehicles or electric cooking solutions), PQR measurements could be used to rapidly conduct infrastructure readiness assessments and provide insights into the conditions leading to infrastructure vulnerabilities (for example, the durability of local electricity infrastructure) that may be place-specific or enhance vulnerabilities18. Policymakers could evaluate transition tensions and trade-offs by leveraging PQR data to visualize how the proposed transitions and their accompanying innovations (for example, demand side management) may contravene tenets of justice by being accessible only to the rich or exacerbate pre-existing vulnerabilities related to class, gender or ethnicity19.
Third, PQR data (that is our framework) could be leveraged to support new financial incentives and innovations that enable high operational performance and improved maintenance arrangements and lessen differences in operational equity. For example, funders or regulators could leverage PQR KPIs to digitally verify and track utility performance (including mini-grid companies) to ensure service compliance (see related work on carbon trading20). A standardized PQR index could be generated and integrated into interest rate calculations or financial models to incentivize the performance and service quality of utilities (including mini-grid companies) in disadvantaged areas21. This would create a direct financial motivation for these companies to improve network services. More importantly, these data could catalyse ‘institutional work’ that changes how electricity infrastructures are configured or reimagined.
Fourth, PQR data (based on our framework) could support evaluations and learnings from infrastructure projects and increase the transparency and accountability of grid modernization outcomes (for example, the scale of improvements observed in marginalized communities). Funders would be able to evaluate project performance, making it easier for them to identify areas needing improvement and make informed decisions about future investments. Some development finance institutions have already begun to integrate funding for grid measurements in monitoring and evaluation plans for new grid investments (see MCC’s Power Compact in Ghana and Senegal)22.
In conclusion, many utilities and government agencies in SSA are behind the technological frontier in terms of medium- to low-voltage grid-monitoring. The affordability of sensors and the strides made in machine-learning algorithms offer rigour and independent tracking of PQR inequities, address current methodological challenges around granularity, temporality and scale in the identification of poor PQR hotspots, and provide interpretive PQR KPIs (SAIDI, SAIFI and voltage KPIs) that could stimulate rapid real-time learning processes among utility staff to achieve predefined technical performance goals and enable operational, governance and business models that enhance the performance of the grid. Finally, these data could be leveraged by policymakers to assess electricity inequities and determine where electricity interventions could have the largest impact.
Methods
Grid measurement scope
The data presented in this work were collected by nLine, Inc., as subcontractors for the University of California, Berkeley, for the MCC’s Learning Impact Evaluation of investments under the ECG Financial and Operational Turnaround Project (EFOT) of the Ghana Power Compact. Beginning in 2018, a fleet of over 1,200 sensors were used to gather PQR data in Accra in support of the MCC’s independent evaluation of the EFOT Project. The measurements covered an estimated 2 million grid-connected customers in Accra and provide a 5-year longitudinal dataset. The GridWatch sensors (Supplementary Fig. 1) plug into wall outlets and collect PQR measurements, namely voltage magnitude (Vrms), a.c. frequency (Hz) and power state (energized or de-energized), which directly capture a consumer’s experiences of electricity supply.
Sensor methodology and deployment were informed by the structure of the grid assets of the ECG. ECG’s grid network is organized into eight regions, which are divided into districts. Based on ECG’s district bifurcation, neighbourhoods with different socio-economic characteristics often fall under the same grid assets. Sensors were deployed in homes and small businesses across 21 districts covering an estimated 2 million ECG customers. We focused on 14 districts that had a higher sensor density (Supplementary Fig. 2). This dataset is available at https://nline.io/public-data.
Calculating PQR injustice
We aggregated sensor measurements into daily and weekly averages for SAIFI, SAIDI and daily hours undervoltage. SAIDI is the average total outage time experienced by a customer over a period. SAIFI is the average number of outages experienced by a customer over a period. SAIDI and SAIFI offer valuable insights into the length and frequency of power outages. Voltage metrics reveal how useful the power is when it is actually on (for example, if a household’s voltage is consistently significantly lower than the nominal range, appliances like refrigerators and electric cookers may not operate efficiently, resulting in higher energy bills or appliance damage). Voltage quality measurements capture the average daily hours of undervoltage and average daily minutes of overvoltage (the Institute of Electrical and Electronics Engineers defines the voltage expectation as ±10% of the nominal voltage).
We then comparatively analysed the experiences of 14 districts to identify interdistrict and intradistrict PQR differences. PQR discrepancies between districts were significant despite being served by the same grid. In 2023, the longest overall outage duration for a district was 3 times that of the shortest, and the district with the most outages had 4.5 times more outages than the district with the fewest. The district with the worst voltage quality experienced over 3 times the number of undervoltage hours than the districts with the best voltage quality. These discrepancies were consistent at different times of the year and were not affected by seasonality. Supplementary Fig. 3 shows a 4-year comparison between the district with the lowest voltage quality (Dansoman) and another district (Achimota). Although seasonal patterns are visible in the voltage quality, these patterns did not affect the discrepancies between the two districts. Dansoman constantly experienced lower voltage quality, showing that the discrepancies were not occasioned by seasonal changes.
Aggregating intersections between PQR and MPI
To unmask how multidimensional poverty intersects with electricity service provision to amplify PQR inequities, we compared our PQR maps with the AMA-generated multidimensional poverty hotspots in Accra (Supplementary Fig. 4a,b). The AMA MPI builds on the global MPI framework, which is traditionally based on ten indicators, but has been expanded to include 13 indicators across four dimensions: living standards, education, wages and health. This expansion of indicators in the AMA MPI was implemented following extensive consultations with experts, who recommended aligning the ten-indicator structure of the global MPI with available, context-specific data for each country. According to the Ghana statistics authority, the AMA MPI was constructed using the Alkire–Foster approach, which is a widely used methodology for measuring multidimensional poverty. Rather than relying on income or consumption measures, this approach considers several dimensions of poverty simultaneously. It identifies who is poor by summing the deprivations each person experiences through a weighted deprivation score and aggregates these data into a headline for a given population. The MPI has three essential components: incidence (the proportion of the population that is considered multidimensionally poor), intensity (the severity or depth of poverty experienced by individuals or households) and MPI or adjusted headcount ratio (calculated by multiplying the incidence by the intensity, MPI = H × A). The data used in constructing the AMA MPI were sourced from the Ghana Living Standards Survey and the Ghana 2021 Population and Housing Census. The weighting system used for Ghana’s MPI follows a ‘nested weights’ approach, where each of the four dimensions—living standards, education, health and employment—receives equal weights, with each dimension contributing one-quarter of the total weight. Within each dimension, the individual indicators are equally weighted to ensured that there is a balanced representation of each component in the overall index (Supplementary Table 1).
The MPI already factors in electricity deprivation (lack of access) as one of the key metrics for identifying whether an individual is vulnerable. In the analysis of the AMA MPI, the regions with elevated multidimensional poverty indices were identified: Chorkor, Korle Gonno, Mpoase, Mamprobi, Nima, Sodom & Gomorrah, Jamestown and Sabon Zongo. Conversely, the areas exhibiting the lowest levels of multidimensional poverty were Roman Ridge, Dzorwulu, East Legon and Labone. Notably, several of the high-poverty regions coincided with Accra’s informal settlements. This validates previous theoretical insights in the EJ literature, particularly the observation that informal or marginalized communities, often mischaracterized as ‘unproductive’ spaces, consistently lack access to quality energy infrastructure and are more probably at risk of electricity deprivation than others. A next step would be to generate correlation coefficients. However, we refrained from performing a direct correlation analysis for the following reason. Although our findings reveal significant disparities in PQR experiences between those in AMA’s multidimensional poverty hotspots and those in low-poverty regions and indicate a possible correlation between poor PQR and the MPI, a key limitation of this analysis is the different levels of aggregation between Ghana’s available MPI data and nLine’s PQR metrics. The different scales of the data constrain the precision of the comparisons. More granular MPI data are necessary for a direct correlational analysis between PQR indicators and poverty metrics.
Estimating the impact of PQR on capabilities
To assess the probable impacts of observed PQR inequities on domestic capabilities, we compared reliability and voltage quality (hours of undervoltage) during peak demand periods across the 14 districts and focused on neighbourhoods identified as highly vulnerable to multidimensional poverty. These peak periods are particularly important, as most electricity-enabled household activities happen during this time. By assessing the temporal scale of PQR disparities, researchers and policymakers can identify whether certain communities are able to attain socially and materially necessary levels of electricity for domestic use and comfort. Also, they can evaluate the risks or likelihood of poor PQR exacerbating other forms of deprivations (relegating households to using solid fuels).
Institutional review board approval
All subjects gave their informed consent for inclusion before they participated in the study. The study was conducted in accordance with the laws of the Republic of Ghana, and the protocol was approved by the Ethics Committee of the University of California, Berkeley, under Federalwide Assurance No. 00006252 (Approval No. 2017-12-10599).
Responses