Modulation of the human GlyT1 by clinical drugs and cholesterol
Introduction
Cognitive impairment associated with schizophrenia (CIAS), including impairments in working memory and executive function, difficulty expressing thoughts, and reduced processing speed, is a major burden for patients with schizophrenia and negatively impacts many aspects of patients’ life1,2,3. Over 80% of patients living with schizophrenia will experience some level of cognitive impairment, and these symptoms are usually amongst the first to appear4,5. Currently, there are no approved pharmacotherapies specifically targeting CIAS6,7. Accumulating evidence from human and animal models has demonstrated that the hypofunction of glycine and glutamate co-activated NMDA receptors (NMDARs) is central to the pathophysiology of schizophrenia, and enhancing neurotransmission through NMDARs holds promise for treating these conditions8,9,10,11,12,13,14. Considering that the glycine transporter 1 (GlyT1) is co-localized with NMDARs in glutamatergic neurons15,16,17, the development of GlyT1 inhibitors to increase glycine availability in the synaptic cleft and restore disturbed NMDA activity is a key approach to treat schizophrenia, especially CIAS18,19,20.
Iclepertin (BI 425809) is a novel potent and selective inhibitor for GlyT1 currently under development for the treatment of CIAS21. It has shown promising results in the non-clinical studies22, Phase I and Phase II clinical trials23,24,25,26, demonstrating its safety, tolerance, and pro-cognitive effects in patients with schizophrenia. For the obvious improvement in cognition, global multi-center phase III clinical trials (NCT04846868, NCT04846881, and NCT04860830) are ongoing21. Sarcosine is an amino acid that can be naturally found in humans and has been proven as a potent and prototype endogenous inhibitor of GlyT127,28. A meta-analysis including seven trials with 326 participants suggests that sarcosine had a positive but nonsignificant effect on overall cognitive functions in patients with schizophrenia29. Nevertheless, the detailed structural information of the binding site of iclepertin and sarcosine, as well as the molecular mechanism of their selectivity and specificity, have yet to be resolved. The brain harbors the highest concentration of cholesterol in the body, making up roughly 20% of the total30,31. Cholesterol functions as a pivotal modulator, intimately engaging with integral membrane proteins to regulate their activities32,33. The interaction and potential modulation of GlyT1 by cholesterol, however, remains unclear.
Here, we determine the cryo-electron microscopy (cryo-EM) structures of human GlyT1 in the apo state (GlyT1Apo), in complex with inhibitor iclepertin (GlyT1ICL) and sarcosine (GlyT1Sar), which allow us to investigate the binding pocket and inhibitory mechanism of drugs targeting GlyT1. Moreover, we identify two allosteric binding sites for cholesterol and elucidate how cholesterol modulates GlyT1 activity.
Results
Conformational equilibrium of the human GlyT1 in its apo state
To understand the transport and molecular mechanism of GlyT1, we designed and purified GFP-tagged full-length human wild-type (WT) GlyT1. Details of each purification step can be found in the ‘Methods’ section. Briefly, we purified GlyT1 in 1% (w/v) n-dodecyl-β-D-maltoside (DDM) and 0.15% (w/v) cholesteryl hemisuccinate (CHS), followed by reconstitution into nanodiscs to mimic a membrane environment. All samples exhibited a symmetric profile on size exclusion chromatography (SEC) (Supplementary Fig. 1a), and the SDS-PAGE analysis of the nanodisc samples showed two bands representing GlyT1 and MSP1D1E3, respectively (Supplementary Fig. 1b). We then prepared cryo-EM samples in the absence of the ligand and collected cryo-EM data. After extensive 3D classification, we obtained three distinct classes with final particle sets of 9701, 27,861, and 53,906 particles (Supplementary Fig. 2a), respectively, and found that these maps fit well with the GlyT1 structures in the outward-facing, occluded, and inward-facing conformations (Supplementary Fig. 3a). Ultimately, we achieved cryo-EM maps of GlyT1Apo-out, GlyT1Apo-occ, and GlyT1Apo-in, at final resolutions of 6.0 Å, 6.2 Å, and 3.9 Å, respectively (Supplementary Fig. 2b–d).
GlyT1 in its apo state was determined in three distinct conformational states, representing a conformational equilibrium during transport cycle. GlyT1Apo-out and GlyT1Apo-occ constitute a very small portion of the GlyT1Apo dataset, and were reconstructed with a high degree of heterogeneity, indicating that the outward-facing and occluded conformations are not the predominant states in the ligand-free condition. In contrast, GlyT1Apo-in is the dominant class within the entire particle dataset, which suggests that the purified apo GlyT1 preferably adopts the inward-facing conformation. From GlyT1Apo-out to GlyT1Apo-occ, TM1b and TM6a tilt approximately 10 degrees towards TM10, while TM1a remains relatively consistent between these two maps (Supplementary Fig. 3b). Meanwhile, TM1a of GlyT1Apo-in shows an unwound state, indicating higher flexibility of TM1a compared to other TM helices (Fig. 1a, b). From GlyT1Apo-occ to GlyT1Apo-in, TM1a lifts and deviates from TM6b (Supplementary Fig. 3b), forming a vestibule towards the intracellular side (Fig. 1c). These conformational changes are consistent with observations in previous studies of neurotransmitter transporters34,35.
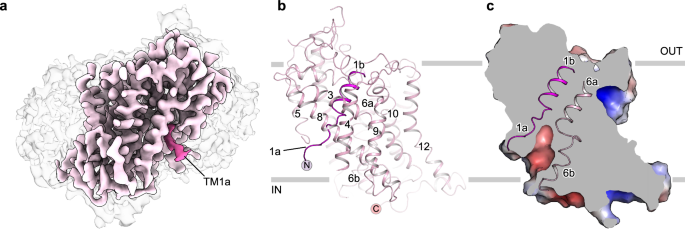
a, b, Cryo-EM density map and overall structure of the GlyT1 in the inward-facing apo state (GlyT1Apo-in). Micelle is colored grey, GlyT1 is colored light pink, and TM1 is highlighted with hot pink. N- and C- termini are labeled with spheres colored hot pink and light pink, respectively. c Surface electrostatic potential map of the GlyT1Apo-in. Unwound TM1a and TM6b form a vestibule toward the intracellular side.
Structure of GlyT1 bound to the substrate sarcosine
Sarcosine, also known as N-methyl glycine or monomethyl-glycine, is a competitive inhibitor and substrate of GlyT127,28. A range of GlyT1 specific inhibitors, such as ALX-540736, AMG 74737, ORG2593538 are developed on the basis of sarcosine. Both rodent and clinical studies have indicated that sarcosine treatment exerts pro-cognitive effect39,40. In detail, adjunctive sarcosine plus benzoate improved the cognitive and global functioning of patients with schizophrenia41. Therefore, it is desirable to investigate how GlyT1 recognizes sarcosine. We determined the structure of GlyT1 in complex with sarcosine at a resolution of 2.8 Å (Fig. 2a, Supplementary Fig. 4), which allows us to illustrate the binding mode of the sarcosine. The sarcosine is encompassed by residues from TM1, TM3, TM6, TM8, and the residues form a cavity situated in the midway of membrane bilayer, which is inaccessible from both the extracellular and intracellular sides, indicating the GlyT1Sar structure we captured is in an occluded state (Fig. 2b). Characteristic unwinding exhibiting in the middle of TM1a–TM1b and TM6a–TM6b formed ion-dipole interactions with Na1 (δ+), Na2 (δ+), and Cl (δ–) (Fig. 2c). The residues among TM1, TM3, TM6, and TM8 formed a cavity and stabilized sarcosine by forming multiple hydrogen bonds (Fig. 2d). The carboxyl group of sarcosine faces the unwinding region of TM1 and the hydroxyl group and carbonyl group form hydrogen bonds with Na1 and hydroxyl oxygen of Y62 in TM1 (Y62TM1) at distances of 2.5 Å and 2.8 Å. The amino group of sarcosine oriented towards TM6 is potentially coordinated with hydrogen bonds formed by the carbonyl oxygen atoms on the backbone of Y316TM6 and S317TM6. The N-methyl group of sarcosine bends towards the side chain of Y62TM1, while the backbone carbonyl oxygen of Y62TM1 forms a potential hydrogen bond with the hydroxyl oxygen of T418TM8, stabilizing the binding of sarcosine. Additionally, a π−π stacking interaction formed between Y316TM6 and W322TM6, together with other residues including Y62TM1, A63TM1, L66TM1, Y142TM3, and L422TM8, engage in hydrophobic interactions that shape the binding pocket of sarcosine (Fig. 2d). In the GlyT1Gly structure, a water molecule is found involved in substrate glycine binding through forming hydrogen bonds with amino group of glycine and carbonyl oxygen of Y62TM1. However, such a water molecule does not exist in the GlyT1Sar structure, which overlaps with the methyl group in the sarcosine (Fig. 2e, f). Moreover, sarcosine can inhibit GlyT1 but not GlyT227,42,43. According to the sequence alignment between GlyT1 and GlyT2, the corresponding position of G319 in GlyT1 (G319T1), while it is S479 in GlyT2 (S479T2). G319 is located close to the N-methyl group of sarcosine. We speculate that the substitution of G319T1 with serine in GlyT2 could cause a steric clash with sarcosine, consequently preventing GlyT2 from recognizing sarcosine. To validate our speculation, we designed two mutants: G319T1 substituted with serine (G319ST1) and S479T2 replaced with glycine (S479GT2). The functional assay has demonstrated that the inhibitory potency of sarcosine on G319ST1 is significantly reduced by ~200-fold compared to that of WT GlyT1. Although WT GlyT2 is not sensitive to sarcosine inhibition, S479GT2 exhibits a susceptibility similar to that of WT GlyT1. These observations suggest that the differences between G319T1 and S479T2 are responsible for the discrimination of sarcosine between GlyT1 and GlyT2 (Fig. 2g).
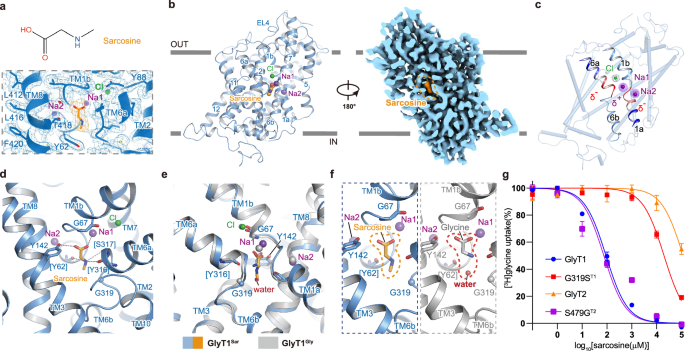
a Molecular structure (upper) and cryo-EM density map (lower) of the sarcosine. Sarcosine is shown as orange sticks. b Overall structure of GlyT1 in complex with sarcosine in the occluded state. Sarcosine, sodium and chloride ions are represented as orange, purple, and green spheres and labeled, respectively. c Interactions between GlyT1 and sarcosine in the binding site. Sarcosine and residues involved in the interactions are shown as sticks and labeled. Sodium and chloride ions are shown as purple and green spheres and labeled, respectively. Hydrogen bonds interactions among sarcosine, sodium ions, and GlyT1 are depicted via dashed lines. d, e Superposition of GlyT1 bound with glycine (GlyTGly) and GlyT1 bound with sarcosine (GlyTSar) using scaffold domain as reference for alignment. GlyTGly and corresponding ions are colored grey. f Comparison of the binding pose of sarcosine in GlyT1 and glycine in GlyT1. Residues involved in the interactions are shown as sticks. g The inhibition curves of wild-type GlyT1, G319ST1, wild-type GlyT2 and S479GT2. The IC50 values of GlyT1, G319ST1, GlyT2 and S479GT2 are 96.81 ± 13.67 μM, 18.62 ± 1.55 mM, 66.97 ± 7.7 μM and 108.9 ± 11.2 mM, respectively. Data represent as mean ± S.E.M. (n = 9 for GlyT1 and G319ST1, n = 3 for GlyT2 and S479GT2). There is a statistically significant difference between the mutants and their corresponding wild-type protein (P < 0.0001 for G319ST1, and P = 0.0006 for S479GT2), while there is no significant difference between the wild-type GlyT1 and S479GT2 (P = 0.2560). Data shown in the panel are from three biologically independent experiments, and samples for GlyT1 and G319ST1 are measured in triplicate. The [3H]glycine uptake has been normalized to the uptake of cells without inhibitor treatment. WT and mutant are represented by specific symbols and lines defined in the legend. P-Values are calculated by unpaired two-tailed t-test with a significance level of 0.05.
Inhibitory mechanism of GlyT1 by iclepertin
Iclepertin (BI 425809) developed by Boehringer Ingelheim, specifically for the treatment of CIAS, is undergoing global multi-center phase III clinical trials21. It specifically inhibits GlyT1, rather than GlyT2, in a dose-dependent manner in both rats and humans25,44. Iclepertin has a high affinity for GlyT1, and the IC50 was determined to be 5.2 ± 1.2 nM in rat primary neurons44. To elucidate the binding pocket of iclepertin, we determined the structure of GlyT1 in the presence of iclepertin at a resolution of 2.9 Å (GlyT1ICL), which facilitates the reliable model building of GlyT1ICL (Supplementary Fig. 5). Iclepertin is composed of two main chemical blocks, (R)-5-(methylsulfonyl)-2-([1,1,1-trifluoropropan-2-yl]oxy)benzoic acid, and 3-[(1 R,5R)-3-azabicyclo[3.1.0]hexan-5-yl]-5-(trifluoromethyl) isoxazole linked to each other via an amide bond45. In our cryo-EM structure, the letter T-shaped iclepertin extends into a binding pocket opening toward cytosol, with the methylsulfonyl group pointing to TM1a, trifluoropropan group pointing to TM6b, and the trifluoromethyl group pointing to the intracellular side (Fig. 3a–c). In specific, the sulfonyl oxygens on iclepertin formed hydrogen bond interactions with the amide nitrogen of L66TM1 and G67TM1, respectively. The thiol group on the residue C421TM8 formed a hydrogen bond with a fluorine atom on the trifluoropropan group that oriented to the TM6 and TM8. The carbonyl and amide nitrogen on the amide bond linker between two chemical blocks of the iclepertin established hydrogen bonds with hydroxyl groups on the residue T418TM8 and on the backbone of residue G61TM1. Moreover, the phenyl groups on residue W322TM6 and Y62TM1 formed π−π interactions with the benzoic group and isoxazole group in iclepertin, respectively. Residues V64TM1, F100TM2, L104TM2, I345TM7, and L422TM8 participate in the hydrophobic interactions with iclepertin. Apart from the direct interactions mentioned above, residues such as G65TM1, G67TM1, G319TM6, and G324TM6 are likely to play significant roles in providing sufficient space to accommodate the iclepertin (Fig. 3d, e).
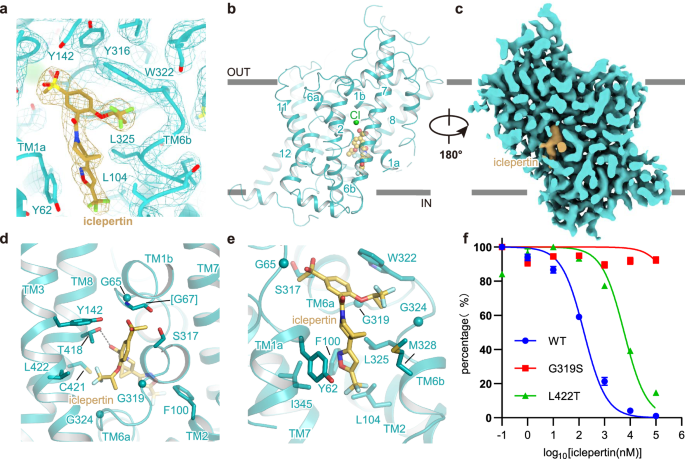
a Molecular structure and cryo-EM density map of iclepertin bound to GlyT1. Iclepertin is shown as light-yellow sticks. b, c Overall structure (left) and cut-open view (right) of GlyT1 in complex with iclepertin in the inward-facing state. Iclepertin, sodium and chloride ions are represented as light-yellow, purple, and green spheres and labeled, respectively. d–e Interactions between GlyT1 and iclepertin in the binding pocket. Iclepertin and residues involved in the interactions are shown as sticks and labeled. Potential hydrogen bonds between iclepertin and GlyT1 are depicted via dashed lines. f The inhibition curves of wild-type GlyT1 (WT), G319S, and L422T mutant. The IC50 values of WT and L422T are 161.8 ± 19.6 nM and 5.25 ± 0.33 µM, respectively. G319S is not inhibited by iclepertin in our assay. There is a statistically significant difference between WT and L422T (P < 0.0001). Data represent as mean ± S.E.M. (n = 9). Data shown in the panel are from three biologically independent experiments, and samples in each experiment are measured in triplicate. The [3H]glycine uptake has been normalized to the uptake of cells without inhibitor treatment. WT and mutants are represented by specific symbols and lines defined in the legend. P-Values are calculated by unpaired two-tailed t-test with a significance level of 0.05.
Iclepertin selectively inhibits GlyT1, but GlyT2 is resistant to it. To explore the structural basis of this selectivity, we compared the sequences of GlyT1 and GlyT2 and found that most of the residues involved in the interactions mentioned above are conserved, except for the residue G319 (serine in GlyT2) and L422 (threonine in GlyT2). Although it seems that residue G319 on TM6b does not directly interact with iclepertin, we propose that G319 in GlyT1 provided adequate space for iclepertin to locate. In GlyT2, the substitution of G319 with serine might cause steric hindrance and consequently hinder the binding of iclepertin with GlyT2. Residue L422 in GlyT1 locating on TM8 does not orient to the binding pocket of iclepertin, substitution of L422 with threonine in GlyT2 might cause local conformational changes and trigger local conformational change in TM8. To validate these speculations, we designed G319S and L422T mutations and measured the IC50 values of iclepertin for these mutants. We found that iclepertin potently blocks the activity of WT GlyT1 with an IC50 value of 100 nM (Fig. 3f), which is comparable to observations in a previous study44. The L422T mutant exhibits a significant reduction in its sensitivity to iclepertin, with an IC50 value of 10 μM (Fig. 3f). The G319S mutation almost completely eliminates sensitivity to iclepertin, with no visible inhibition effect in our functional assay (Fig. 3f). These observations confirm that the residue variations at G319 and L422 in GlyT1 play crucial roles in the selective inhibition of GlyT1 by iclepertin.
ALX-5407 and sarcosine feature electron-rich carboxylates, while iclepertin and Cmpd1 present electron-rich sulfonyl groups, respectively, which can serve as strong hydrogen-bond acceptors35,46. In the occluded state, the central pocket offers limited space and can only accommodate compounds such as sarcosine or glycine. Despite significant differences in their chemical structures, ALX-5407, Cmpd1, and iclepertin all occupy the intracellular cavity35,46, with their electron-rich groups contacting the base of the intracellular cavity (Supplementary Fig. 6a–e). We further compared the drug binding modes of GlyT1 with those from other neurotransmitter transporters (Supplementary Fig. 7), including the human dopamine transporter (hDAT), human norepinephrine transporter (hNET), and human serotonin transporter (hSERT)47,48,49,50. We found that the functional groups of drugs located at the tip of the intracellular cavity are electroneutral and hydrophobic, which contrasts with the negatively charged groups of inhibitors targeting the inward-facing GlyT1.
Allosteric binding site of cholesterol in the GlyT1
Cholesterol is fundamental in regulating the biological processes of a wide range of membrane proteins51,52,53. In the cryo-EM map of GlyT1Sar, we identified three extra densities cradled by a pocket formed by TM10, TM11, and TM12 on the extracellular side, and two grooves, one formed by TM10 and TM11 on the intracellular side, and another formed by TM4 and TM9 on the extracellular side. These densities do not resemble the ligand sarcosine that we added. Subsequent model building revealed that the cholesterol molecule fits well into these densities; therefore, we propose that the densities observed might be cholesterol molecules. For convenience, we will refer to the observed cholesterol molecules as CHOL1, CHOL2, and CHOL3, respectively (Fig. 4a, Supplementary Fig. 8a). Cholesterol is one of the polycyclic amphipathic molecules derived from the sterane backbone54,55. It can be depicted with a single hydroxyl group (the polar section) and an asymmetric structure with two distinct faces (the apolar section), referred to as α face (a planar surface) and β face (a rougher surface) according to the system numeration of ring compounds54,56. For the CHOL1, the hydroxyl group on the polar side pointed to the extracellular side. Some interactions identified above the hydroxyl group stabilize TM1b, EL5, and TM6a in a specific configuration, creating space to accommodate CHOL1. For instance, a cation-π interaction forms between Y549EL5 and H548EL5, a hydrogen bond exists between R78TM1 and N475TM10, and two salt bridges occur among residues D309TM6, K305TM6 and R78TM1. The apolar section of CHOL1 is embedded within a pocket composed of hydrophobic residues from TM10, TM11, TM12, and EL5. The aromatic side chains of residue Y476TM10, Y541EL5, Y546EL5 and F560TM12 stack onto the α face of CHOL1 through CH-π interactions (Supplementary Fig. 8b). Moreover, the branched side chains of V484TM10, L534TM11, V538TM11, L564TM12, and V567TM12 interpenetrate into the β face of cholesterol, which is formed by two methyl groups and an isooctyl chain those linked to the sterane backbone, and interact with the rough surface through Van der Waals interactions (Supplementary Fig. 8b). The small side chain of A563TM12 is likely to provide sufficient space for CHOL1 to locate (Supplementary Fig. 8b). The binding pocket of CHOL2 is consist of residues from TM10 and TM11 (Fig. 4a). Branched side chains of V484TM10, I488TM10, V491TM10 interact with the rough face of CHOL2 through Van der Waals interaction (Supplementary Fig. 8c). Phenyl groups of Y495TM10, Y524TM11 and F531TM11 stack on the β face of CHOL2 through CH-π interactions (Supplementary Fig. 8c). CHOL3 is surrounded by many hydrophobic residues of TM4 and TM9 (Supplementary Fig. 8a), such as L237, V242, L245, and F455 (Supplementary Fig. 8d). G238 and G241 provide the spatial requirements that enable the accommodation of CHOL3 in the groove (Supplementary Fig. 8d).
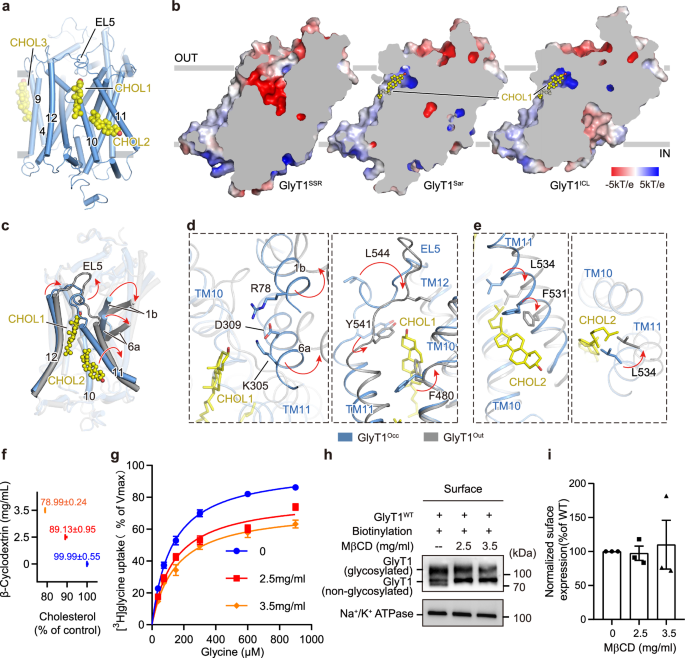
a Cholesterol binding sites depicted in the occluded state. The left panel shows the overall structure of cholesterol binding sites, with GlyT1 and cholesterol molecules represented as cylinders and spheres, respectively. b Representative cholesterol binding sites and surface electrostatic potential maps of GlyT1 in outward-facing (GlyT1SSR), occluded (GlyT1Sar), and inward-facing (GlyT1ICL) states. Cholesterol is shown as yellow spheres and labeled. c–e Structural comparison of cholesterol binding sites between occluded (GlyT1Sar, light blue) and outward-facing (GlyT1SSR, grey) states. Red arrows indicate helix and residue movements during conformational transitions for (d) CHOL1 and (e) CHOL2. Residues involved in the interactions are shown as sticks and labeled. f, g Effects of cholesterol depletion on GlyT1 functional activity in HEK−293F cells. Cholesterol concentrations in cells after brief incubation with MβCD (0, 2.5, or 3.5 mg/mL) are shown. [3H]Glycine uptake plots for GlyT1 in the absence (0 mg/mL, blue) or presence (2.5 mg/mL, red; 3.5 mg/mL, orange) of MβCD. No significant differences in Km values compared to WT GlyT1 (P = 0.4221 for 2.5 mg/mL, P = 0.1735 for 3.5 mg/mL). Vmax values show significant differences in presence of 2.5 mg/mL (P < 0.0001) and 3.5 mg/mL (P < 0.0001) MβCD. Vmax values for 2.5 mg/mL and 3.5 mg/mL MβCD also differ significantly (P = 0.0172). Data from three independent experiments presented as mean ± SEM. Statistical comparisons were conducted using one-way ANOVA followed by an unpaired t-test to determine significant differences. h Cell surface biotinylation of WT GlyT1 incubated with 0, 2.5, and 3.5 mg/mL MβCD in HEK293F cells. Surface proteins (lanes 1–3) labeled with biotin and recovered using streptavidin beads. Biotinylated Na+/K+ ATPase served as loading control. Experiments repeated three times with similar results. i Densitometric quantification of surface expression for WT GlyT1 incubated with 0, 2.5, and 3.5 mg/mL MβCD in HEK293F cells. Gels that derived from the same experiment were processed in parallel. The surface expression was first normalized to Na+/K+ ATPase and then to the expression of WT GlyT1. Each black dot, square, and triangle symbol represents an individual data point for WT GlyT1 incubated with 0, 2.5, and 3.5 mg/mL MβCD, respectively. Data are shown as mean ± S.E.M. (n = 3 biologically independent experiments).
We further investigated cholesterol binding in other conformational states and found that three cholesterol molecules CHOL1, CHOL2, and CHOL3 are also associated with GlyT1 in the inward-facing GlyT1ICL structure (Fig.4b, Supplementary Fig. 8e, f). Their binding pockets are nearly identical in these two structures. However, upon examining the cryo-EM map of the outward-facing SSR504734-bound GlyT1 structure (GlyT1SSR), we found no cholesterol associated at the binding sites of CHOL1 and CHOL2, but associated with density in CHOL3 site (Supplementary Fig. 8f). Further inspection and structural comparison between GlyT1Sar and GlyT1SSR reveal that TM1b, TM6a, and TM11 move away from TM12 during the conformational transition from the occluded state to the outward-facing state (Fig. 4c). The residue F480TM10 directly oriented to the CHOL1 in the outward-facing state and possibly caused the steric hindrance which prevents the cholesterol from binding in the outward-facing state (Fig. 4d). For the CHOL2, the movement of TM11 deviated from TM12 with branched side chain of L534TM11 introduces steric hindrance with the isooctyl group of CHOL2. Given that the cholesterol binding pockets of CHOL1 and CHOL2 are conformation-dependent, varying across different conformations of GlyT1, we propose that these cholesterol molecules may influence the conformational transitions and turnover rate of GlyT1. However, CHOL3 is present in all three conformations, indicating that it is non-conformation-dependent.
To assess our speculation regarding the regulatory role of cholesterol, we conducted [3H]glycine inhibition and kinetic assays in cells expressing WT GlyT1, with cholesterol on the membrane partially depleted by various concentrations of methyl-β-cyclodextrin (MβCD)57,58. The kinetic study of WT GlyT1 revealed that the Km value is 125.6 μM, which is similar to previous observations35. Treatment of cells expressing GlyT1 with 2.5 mg/mL and 3.5 mg/mL of MβCD effectively decreased the cholesterol content on the membrane by 10% and 20%, respectively, without altering the surface expression (Fig. 4f, h, i). Our kinetic study showed that the Km values remained relatively unaffected, while there was a significant decrease in Vmax values, about 19.6% and 26.7% reduction compared to that of WT GlyT1. Next, we supplemented 2.5 mg/mL water-soluble cholesterol (wsCHOL) in the uptake reaction, which increased cholesterol content in membrane by approximately 1-fold (Supplementary Fig. 8g, 8j). We found that the [3H]glycine uptake rate is reduced in the wsCHOL-treated cells (Supplementary Fig. 8g). We speculate that the membrane environment with higher concentration cholesterol promotes inward-facing conformation and hinders conformational transition of GlyT1 to outward-facing state, leading to a reduction in Vmax. These findings indicate that the cholesterol depletion or replenishment can alter binding equilibrium of cholesterol with GlyT1, resulting in an increased population of the transporter in outward-facing or inward-facing conformations, respectively. This alteration potentially creates an energy barrier that impedes the conformational transition between inward-facing and outward-facing states.
To further assess the modulatory role of cholesterol, based on the binding mode of cholesterol, we designed an A563F mutation within the CHOL1 site that is supposed to compromise cholesterol binding (Supplementary Fig. 8b, 8h). The uptake assay demonstrated that the A563F mutant exhibits significantly reduced maximal transport activity without discernible changes in substrate affinity (Supplementary Fig. 8h). The cholesterol depletion further impairs the transport rate of the A563F mutant, consistent with observations using WT GlyT1 (Supplementary Fig. 8i). Strikingly, unlike the reduction of Vmax observed in WT GlyT1, wsCHOL treatment remarkably improves the transport activity of the A563F mutant (Supplementary Fig. 8i). We speculate that the A563F mutation may function similarly as cholesterol depletion to increase the proportion of GlyT1 in an outward-facing conformation. However, the cholesterol replenishment may compensate for the low binding affinity of the A563F mutant at the CHOL1 site by increasing the occupation of cholesterol at CHOL1, thereby facilitating conformational transition between inward- and outward-facing states. Furthermore, our [3H]glycine inhibition assay indicated that 3.5 mg/mL MβCD treatment effectively lowered the cholesterol levels in the cells without altering the inhibitory potency of iclepertin and sarcosine on GlyT1, consistent with the structural observation of cholesterol allosteric binding (Supplementary Fig. 8k-8m). These observations demonstrate that cholesterol indeed modulates GlyT1 activity by affecting conformational transitions and equilibrium, but without affecting its binding affinity to the sarcosine and iclepertin. This is consistent with the regulatory role of cholesterol on DAT58,59, even though the cholesterol binding sites are distinct in these two transporters (Supplementary Fig. 9a, c–f).
Cholesterol has also been identified in other neurotransmitter transporters in previous studies58,60,61,62. We superposed GlyT1 with the drosophila dopamine transporter (dDAT), the hSERT, and the hDAT (Supplementary Fig. 9a–d). The binding sites of CHOL1, CHOL2, and CHOL3 are all distinct from cholesterol or cholesteryl hemisuccinate binding sites observed in these transporters (Supplementary Fig. 9a–d). We found that the residues within the cholesterol binding site are not conserved. In GlyT1, some small or hydrophobic residues at the three cholesterol binding sites are replaced by bulky or hydrophilic residues in hDAT, introducing steric hindrance or hydrophilic interface, thereby disrupting cholesterol binding. For example, F560 of GlyT1 (F560T1), F480T1, and V484T1 are replaced by W562 of hDAT (W562DAT), T482DAT, and F486DAT at the binding site of CHOL1. C487T1 and Y495T1 are replaced by L489DAT and W497DAT at the binding site of CHOL2. L234T1, G238T1, and G241T1 are replaced by W238DAT, A245DAT, and T245DAT at the binding site of CHOL3 (Supplementary Fig. 9e). Similarly, compared to hDAT, some residues in GlyT1 become larger or more hydrophilic, and the orientation of certain TM helices or loops changes. This may introduce steric hindrance with cholesterol, thus preventing its binding in the equivalent pocket found in DAT (see Supplementary Fig. 9f). Moreover, a cholesterol-binding site was identified in GlyT2 through molecular dynamics simulations63. This site is adjacent to TM1a, similar to the one found in DAT, and is also dependent on conformation. Electrophysiological experiments showed that depleting membrane cholesterol reduced the Vmax of GlyT2 without affecting inhibitor binding63, consistent with observations made for GlyT1 when cholesterol is depleted.
Discussion
In this study, we determined the structures of human GlyT1 in the apo state and in complex with sarcosine and iclepertin, both of which are undergoing clinical trials and have shown potential in improving cognitive symptoms of schizophrenia. On one hand, we elucidated the conformational transition mechanisms of the transport cycle, which are consistent with previous observations35. On the other hand, the complex structures revealed drug-binding pockets and specific residues responsible for their selectivity in inhibiting GlyT1 over GlyT2 (Fig. 2g). Most strikingly, we determined three cholesterol binding sites (Fig. 4a and Supplementary Fig. 8a), which are distinct from the observation in other neurotransmitter transporters such as DAT and SERT (Supplementary Fig. 9). CHOL1 and CHOL2 located in the pocket among TM10, TM11, and TM12, with CHOL3 positioned in the groove between TM4 and TM9 (Fig. 4b–d). Compared with GlyT1 in the outward-facing state, we found that CHOL3 is consistently preserved across all conformational states (Supplementary Fig. 8f). However, the association of CHOL1 and CHOL2 is conformation-dependent; they are only present in the occluded and inward-facing conformations (Fig. 4b). In the outward-facing conformation, their binding pockets are disrupted due to local rearrangement of the TM helices and side chains (Fig. 4c–e). We propose that such conformation-dependent binding of cholesterol may be important to modulate conformational transitions. Consequently, we manipulated the cholesterol content of cells and measured GlyT1 transport kinetics. We found that both depletion and replenishment significantly decrease the maximal transport activity without altering the glycine binding affinity (Supplementary Fig. 8g). The A563F mutation, which is supposed to impair cholesterol binding at the binding site of CHOL1, reduces transport activity (Supplementary Fig. 8h), and cholesterol depletion can further decrease its activity (Supplementary Fig. 8i). However, cholesterol replenishment can enhance its activity (Supplementary Fig. 8i), instead of the reduction in Vmax observed in WT GlyT1 (Supplementary Fig. 8g). The enhancement is likely due to the fact that a high cholesterol concentration facilitates cholesterol binding at the CHOL1 site, even with the mutation, to a level similar to that of the WT GlyT1 in its native environment, thereby partially restoring the optimal equilibrium of conformational transitions. These observations demonstrate that the equilibrium of cholesterol binding and unbinding is crucial to modulating the conformational transitions of GlyT1. Changes in cholesterol concentration may cause variations in the conformational equilibrium of GlyT1 between inward-facing and outward-facing states, thus hindering its transition between these two states. The modulatory role of cholesterol on SERT and DAT has also been investigated57,58,59,64. Although the cholesterol binding sites in these two transporters are significantly distinct from those in GlyT1, and cholesterol associates with SERT or DAT in the outward-facing conformation rather than the inward-facing state in GlyT161,65, they may still adopt a similar mechanism to influence transport activity. Our work also provides structural insights into how sarcosine and iclepertin interact with GlyT1. Iclepertin is currently undergoing clinical trials at multiple centers globally, but the clinical data have not yet been disclosed. Should there be any shortcomings in efficacy or potential side effects associated with this compound, our complex structure offers a precise template for further drug optimization. Moreover, the conformation-dependent cholesterol binding identified in this study also holds promise for developing an allosteric modulator to inhibit its function, providing another avenue for future drug design. In summary, our study elucidates the modulatory roles of pharmacological compounds and intrinsic cholesterol molecules on GlyT1, which are critical for the rational design of more potent and specific inhibitors targeting GlyT1.
Methods
Expression and purification of human GlyT1
The full-length human GlyT1b gene (SLC6A9, Uniprot ID: P48067-3) was amplified from a human cDNA library using Super-Fidelity DNA Polymerase (Vazyme) and cloned into the pEG BacMam vector. This vector included a C-terminal superfolder GFP (sfGFP) fused with a Twin-Strep affinity tag, separated from GlyT1b by a PreScission Protease (PPase) cleavage site. Recombinant baculovirus was produced using the Bac-to-Bac system in Sf9 cells, which were cultured in IB905 Medium (YSK BIOSCIENCES, Zhejiang, China). HEK-293F cells at a density of ~2.5 × 10⁶ cells/mL were infected with 2% (v/v) P2 recombinant baculovirus and cultured in 293 F Hi-exp Medium (AC601501, Shanghai OPM Biosciences Co., Ltd.) at 37 °C with 5% CO2 in a shaking incubator. After 12 hours, 10 mM sodium butyrate was added to enhance protein expression. Cells were harvested 48 hours later and immediately stored at −80 °C after rapid freezing in liquid nitrogen.
After thawing, frozen cell pellets were suspended on ice in buffer A (20 mM HEPES (High Purity Grade, JS0164, JSENB) pH 7.5, 150 mM NaCl, 2 μg/mL aprotinin (MedChemExpress), 1.4 μg/mL leupeptin (MedChemExpress), 0.5 μg/mL pepstatin A (MedChemExpress)). Cell membranes underwent disruption using a Dounce homogenizer, followed by enrichment through centrifugation at 200,000 g for 30 minutes at 4 °C. The resulting membrane pellets were solubilized in buffer A containing 1% (w/v) n-dodecyl-β-D-maltoside (DDM) and 0.15% (w/v) cholesteryl hemisuccinate (CHS) (Anatrace, USA) for 2 hours at 4 °C with rotation. After centrifugation at 200,000 g for 30 minutes to remove insoluble debris, the supernatant underwent filtration through a 0.22 μm filter and was subsequently applied to Streptactin Beads 4FF (Smart-Lifesciences) for protein purification. Following sample loading, the resin was washed with buffer B (20 mM HEPES pH 7.5, 150 mM NaCl, 0.025% DDM). GlyT1 protein elution was achieved using buffer C (20 mM HEPES pH 7.5, 150 mM NaCl, 0.1% digitonin, 5 mM desthiobiotin (1169249, Leyan)). The eluted protein was concentrated to 1 mL using a 50-kDa Millipore Tube (Merck Millipore, Germany) and underwent further purification through size exclusion chromatography (SEC) using a Superose 6 Increase 10/300 GL column (GE Healthcare, USA) equilibrated with buffer D (20 mM HEPES pH 7.5, 150 mM NaCl, 0.1% digitonin). Peak fractions were collected and adjusted to −1 mg/mL for nanodisc reconstitution. Throughout the purification process, 20 mM sarcosine (Macklin) or 1 μM iclepertin (MedChemExpress) was included for sarcosine-bound and iclepertin-bound structures, respectively.
Nanodiscs reconstitution
Nanodisc reconstitution involved the use of membrane scaffold protein MSP1D1E3, which was purified via a metal chelate affinity column (Ni-NTA) and dialyzed in TBS buffer (20 mM Tris pH 8.0, 150 mM KCl). Brain polar lipid (BPL, Avanti) dissolved in chloroform was mixed with HBS buffer (20 mM HEPES pH 7.5, 150 mM NaCl), supplemented with 2% (w/v) digitonin, and incubated at 4 °C for 30 minutes. GlyT1 protein was combined with MSP1D1E3 and BPL in a 1:5:200 molar ratio and rotated at 4 °C for 1 hour. Detergent removal was achieved by adding Bio-Beads (SM2, Bio-Rad) at 400 mg/mL, followed by overnight incubation at 4 °C. After centrifugation, the supernatant was loaded onto streptavidin resin, washed with buffer E (20 mM HEPES pH 7.5, 150 mM NaCl) to remove empty nanodiscs, and eluted with buffer E containing 4 mM desthiobiotin. The elution was digested with HRV3C protease at 4 °C for 1 h to remove the sfGFP tag of GlyT1. The eluate, supplemented with 15 mM imidazole, was applied to Ni-NTA resin, washed with buffer E containing 20 mM imidazole, and collected. After concentration, peak fractions were obtained using Superose 6 Increase 10/300 GL column and concentrated to 5 ~ 6 mg/mL for cryo-EM grid preparation. The final protein samples used in the cryo-EM study were analyzed by SDS-PAGE, with molecular weight protein markers (New Cell & Molecular Biotech, P9008) used for reference (Supplementary Fig. 1b and Source Data file).
Cryo-EM sample preparation and data collection
200 μM iclepertin and 200 mM sarcosine were added to the cryo-EM samples for GlyT1ICL, GlyT1Sar, respectively, and incubated for 40 minutes on ice. Quantifoil 1.2/1.3 Cu 300 mesh grids were glow-discharged for 60 seconds under H2-O2 conditions using a Solarus plasma cleaner (Gatan, USA). A 3 μL protein sample droplet was applied to the grids at 4 °C and 100% humidity, then snap-frozen in liquid ethane cooled by liquid nitrogen using a Vitrobot Mark IV (Thermo Fisher Scientific, USA). The grids were stored in liquid nitrogen until examination on the electron microscopy instrument.
Cryo-EM grids were prepared in the following procedures using a Vitrobot Mark IV (Thermo Fisher Scientific, USA). A final concentration of 200 mM sarcosine and 200 μM iclepertin were added to the corresponding cryo-EM sample and incubated for 40 minutes. Then, 3 μL of the protein sample droplet was applied to a glow-discharged grid (Quantifoil 300 mesh, Cu R1.2/1.3). The grids were blotted for 4–5 s using a blot force of 4 and then plunge-frozen into liquid ethane cooled by liquid nitrogen. The grids were stored in liquid nitrogen before being transferred into cryo-EM instrument.
Then, the grids were transferred to a Titan Krios G4 microscope (Thermo Fisher Scientific) operating at 300 kV. Movies were recorded on a K3 direct electron detector (Gatan) mounted post a quantum energy filter (slit width 10 eV) in super-resolution mode with a defocus range of −1.0 to −2.0 μm and a magnification of 105,000 ×, resulting in a calibrated pixel size of 0.425 Å. Data were collected using EPU software. Each movie stack of 32 frames was exposed in 2.89 s with a total accumulated dose of 60 e−/Å2.
Cryo-EM data processing
Data were processed in CryoSPARC (v4.4.0). Patch motion correction was performed to align movie frames, and patch CTF estimation were used to estimate contrast transfer function (CTF). Micrographs were then manually curated, and those with poor ice thickness, astigmatism, CTF-correlated resolutions, and defocus ranges were removed to facilitate further processing.
For GlyT1Sar dataset, 2191 micrographs were selected, and 2,644,128 particles were picked using blob picker at a box size of 256 pixels in the first round. 2D classification was performed and particles with poor signal-to-noise ratio were discarded, yielding 737,767 good particles. Then, heterogeneous refinement and ab-initio reconstruction were used to remove bad particles, and 321,248 good particles were classified and subjected to non-uniform refinement, producing a map with an overall resolution of 3.1 Å. To further improve the resolution, 3,828,419 particles were selected and mixed with good particles classified in the first round, with duplicated particles removed. Heterogeneous refinement was performed, and 984,576 particles with discernible features were classified, re-extracted with a box size of 320 pixels, and subjected to 3D classification (without alignment), resulting in 639,501 particles. Finally, reference-based motion correction and local refinement were conducted, producing a well-defined map with an overall resolution of 2.8 Å. For GlyT1ICL dataset, the common procedures were conducted the same as GlyT1Sar, yielding a map with an overall resolution of 2.9 Å (Supplementary Table 1).
Model building
We employed the models GlyT1Gly and GlyT1ALX as the initial templates for GlyT1Sar and GlyT1ICL, respectively35. For the model building, we individually aligned the models of GlyT1Gly and GlyT1ALX into the cryo-EM density maps of GlyT1Sar and GlyT1ICL in UCSF Chimera66. The models were then manually rebuilt using COOT67 to fit the density. The models of sarcosine, iclepertin, cholesterol, and their geometric constraints were generated using elBOW module in PHENIX68. Comprehensive refinements of all models against their corresponding maps were performed using the ‘phenix.real_space_refine’ tool, incorporating secondary structure and geometric restraints69. Validations of the structures were conducted by assessing Clash scores, MolProbity scores, and Ramachandran plot statistics using the ‘phenix.comprehensive validation (cryo-EM)’ tool69.
All figures were prepared with the software Pymol or UCSF Chimera.
Cholesterol manipulation and quantification
Methyl-β-cyclodextrin (MβCD), purchased from Sigma-Aldrich, was employed to deplete cholesterol on the membrane57,58 and cholesterol replenishment was achieved using water-soluble cholesterol (wsCHOL)58,59,70. The wsCHOL was the mixture of cholesterol and MβCD in the ratio of 40 mg/g. MβCD and wsCHOL were freshly dissolved in uptake buffer (10 mM HEPES-Tris, pH 7.4, 150 mM NaCl, 1 mM CaCl2, 5 mM KCl, 1 mM MgSO4, and 10 mM glucose) before the experiment. HEK-293F cells were washed once with uptake buffer and were subsequently incubated with MβCD or wsCHOL for 30 minutes at 37 °C. Then, cells were collected at 1000 × g at room temperature for 2 minutes and were then washed once with uptake buffer before the quantification of the cholesterol or the kinetic assay. The cholesterol content of cells was measured using Amplex Red Cholesterol Kit (Beyotime, China), according to the manufacturer’s protocol.
[3H]glycine inhibition and kinetic assays
[3H]glycine uptake and kinetic assay was processed according to a previously published method35 with a few adjustments. In brief, HEK-293F cells at a density of 2.5 × 10⁶ per mL were infected with various GlyT1 construction viruses. After 15 hours of transfection, cells were collected and washed once with uptake buffer (10 mM HEPES-Tris, pH 7.4, 150 mM NaCl, 1 mM CaCl2, 5 mM KCl, 1 mM MgSO4, and 10 mM glucose). In the inhibition assays, cells were preincubated with varying concentrations of inhibitors iclepertin or sarcosine, for 10 minutes. Cells were then incubated with 25 μM mixture of [3H]glycine and unlabeled glycine at a ratio of 1:2500 for 1 minute, which was in the linear range. The preincubation and uptake were both conducted at room temperature (25 °C). The cells were then washed twice with cold uptake buffer to remove any free isotope. For kinetic uptake studies, cells with or without treatment were washed once with uptake buffer. 37.5–900 μM substrate glycine was prepared by mixing [3H]glycine and unlabeled glycine in a 1:8000 molar ratio and was added to cells to initiate the uptake. After incubation for 1 minute, cells were washed twice with ice-cold uptake buffer to terminate the reaction. The cells were the lysed in 200 μL uptake buffer supplemented with 1% Triton X-100. Radioactivity was measured using a Hidex 300 SL liquid scintillation counter (Hidex, Finland). Data were obtained from three biologically independent experiments, and curves were fitted with the mean of data. The IC50 and Kinetic parameters (Km and Vmax) were calculated using the specified equation in GraphPad Prism9. The mutants used in this study were generated by site-directed mutagenesis using the Super-Fidelity PCR kit (Vazyme, P505) and verified by sequencing. The primer sequences are provided in the Supplementary Table 2.
Cell surface biotinylation and immunoblot analysis
HEK-293F cells expressing WT GlyT1-FLAG were collected and washed once with uptake buffer (10 mM HEPES-Tris, pH 7.4, 150 mM NaCl, 1 mM CaCl2, 5 mM KCl, 1 mM MgSO4, and 10 mM glucose). Then, cells were incubated with uptake buffer with or without MβCD for 30 minutes at 37 °C. After washing with uptake buffer, cells were labeled with Sulfo-NHS-SS-Biotin (1 mg/mL, APExBIO) for 30 minutes at 4 °C with gentle rotation. The remaining Sulfo-NHS-SS-Biotin was removed by washing once with uptake buffer containing 100 mM glycine and quenched by a further incubation for 20 minutes at 4 °C. After a final wash with uptake buffer, cells were lysed in buffer A (20 mM HEPES, pH 7.5, 150 mM NaCl, 2 μg/mL aprotinin, 1.4 μg/mL leupeptin, 0.5 μg/mL pepstatin A) containing 1% (w/v) DDM and 0.15% (w/v) CHS (Anatrace, USA) for 1 hour at 4 °C with rotation. The lysate was centrifuged at 20,000 × g for 30 minutes at 4 °C, and the supernatant was subsequently applied to the column containing 50 μL Streptactin Beads 6FF. The mixture was gently shaken for a few minutes at room temperature to allow the biotinylated proteins to bind the streptavidin beads. The beads were washed with buffer B (20 mM HEPES pH 7.5, 150 mM NaCl, 0.025% DDM) to remove the unbound proteins. The beads were then suspended by 100 μL buffer B, and the bead suspension was separated by 10% SDS-PAGE and transferred to PVDF membranes. Membranes were first blocked with 5% (w/v) milk powder in TBS-T at room temperature for 1 hour, followed by three washes in TBS-T. Membranes were incubated with primary antibodies for 1 hour at room temperature and were then washed 3 × 5 minutes with TBS-T. Membranes were subsequently incubated with horseradish peroxidase (HRP)-conjugated secondary antibodies 1 h at room temperature followed by three washes in TBS-T. The protein was visualized using TanonTM High-sig ECL Western Blotting Substrate. The image was captured using Tanon-5200Multl and was analyzed using Fiji.
Primary antibodies against GlyT1WT-FLAG protein and Na+/K+ ATPase protein was mouse anti-FLAG antibody (Bioworld, AP0007M, 1:5000 dilution for immunoblotting) and rabbit anti-Na+/K+ ATPase antibody (Abcam, ab76020, 1:5000 dilution for immunoblotting), respectively. Na+/K+ ATPase was employed to determine equal protein loading.
Reporting summary
Further information on research design is available in the Nature Portfolio Reporting Summary linked to this article.
Responses