More robust offshore wind energy planning through model ensembling
Introduction
Offshore wind energy (OWE) development belongs to the pillars of the European1 and global Energy transition2. In European seas, national governments have identified potential areas for offshore wind energy deployment using maritime spatial planning (MSP). Most recent national MSP initiatives lack the analytical tools necessary to provide ex-ante assessments for sea areas prioritized for OWE development. Ex-ante assessments are crucial as they support decision-making in the early stages of developing technological systems, facilitating the sustainable deployment of infrastructure and technological innovations3,4. Ex-ante assessments of maritime spatial plans are a priority area for the European Maritime, Fishery and Aquaculture Fund (EMFAF) and have the benefit of identifying trade-offs, minimize conflicts, promote sustainable development in marine areas and reinvigorate with new knowledge future amendments and cycles of national maritime spatial plans. In the context of OWE planning, MSP appears to have multiple utilities, such as ensuring legal certainty of use of the sea space of emerging human activities such as OWE5, it regulates co-existence of OWE with existing human activities at sea (commercial fishery, shipping, aquaculture, etc…)6, it fosters ecosystem-based management of natural resources at multi-sectoral level7 and facilitates coordinated actions among stakeholders.
However, MSP, together with the Blue Economy—which encompasses economic activities that depend on the sea, often associated with other economic sectors, including tourism, maritime transport, energy, and fishing8—receives increased criticism together with Blue Economy, because promoting a neoliberal logic centered on re-spatializing the sea space in favor of economic interests9, leaving behind nature protection and the place-based socio-cultural characteristics of coastal territories10,11.
European seas are experiencing significant changes in governance, particularly through the implementation of the MSP Directive. As of January 2018, 21 out of 23 EU member states have transposed the MSP Directive into their national legislation12. The pressing need for transitioning towards more sustainable modes of energy production is expected to increase competition for sea space of up to 80% of Europe’s sea space by 205013 due to marine infrastructure deployment. The experience of first-cycle national maritime spatial plans provides an unprecedented opportunity to initiate ex-ante assessments addressing the balance of ecological, social, spatial, economic, energy-related, and technological characteristics when determining the allocation of OWE arrays at sea.
Literature on MSP has identified in multi-criteria decision analysis (MCDA)14,15,16,17 a central technique for OWE allocation. In the last five years the approach has been subjected to an evolution as techniques shifted from single to ensembled MCDA (EnseMCDA) techniques14,18. Ensembling techniques involve the aggregation of multiple decision-making methods, criteria, or models to rank alternatives across multiple objectives. They leverage the strengths of individual methods, compensate for their weaknesses, and provide a more holistic, balanced, and reliable evaluation of alternatives. By integrating diverse perspectives, EnseMCDA enhances the comprehensiveness of decision-making processes, enabling stakeholders to make more informed and objective decisions.
The aim of this research is the development and application of an EnseMCDA technique to support more robust ocean planning decisions based on a national case study for the high potential areas for offshore wind energy (HPA-OWE) settled in the first Spanish Maritime Spatial Plan.
The manuscript is structured as follows: The results section describes the 39 criteria database describing the ecological, social, economic, energy-related, spatial, and technical/technological performance of the 19 the HPA-OWE (Figs. 1 and 2). Then, we describe the EnseMCDA ranking and the optimal ranking results (Fig. 3; Table 1) for each HPA-OWE based on three MCDA methods (TOPSIS—technique for order of preference by similarity to ideal solution; MMOORA—multi-objective optimization by ration analysis and VIKOR—multicriteria optimization and compromise solution)19,20,21. The EnseMCDA is coupled with a non-conditioned weighting mechanism with importance weights attributed uniformly through a Monte Carlo simulation to derive a more robust decision. We describe the emerging trade-offs in the four planning subdivisions (Fig. 4) by applying a Random Forest (RM) machine-learning (ML) technique to identify the mean square error (MSE) as criteria importance indicator. The discussion section addresses the findings and outlines potential future research directions.
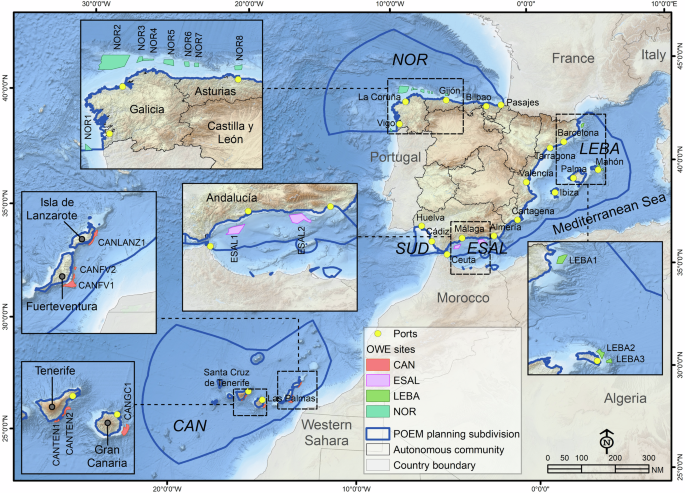
Source: BOE-A-2023-5704.
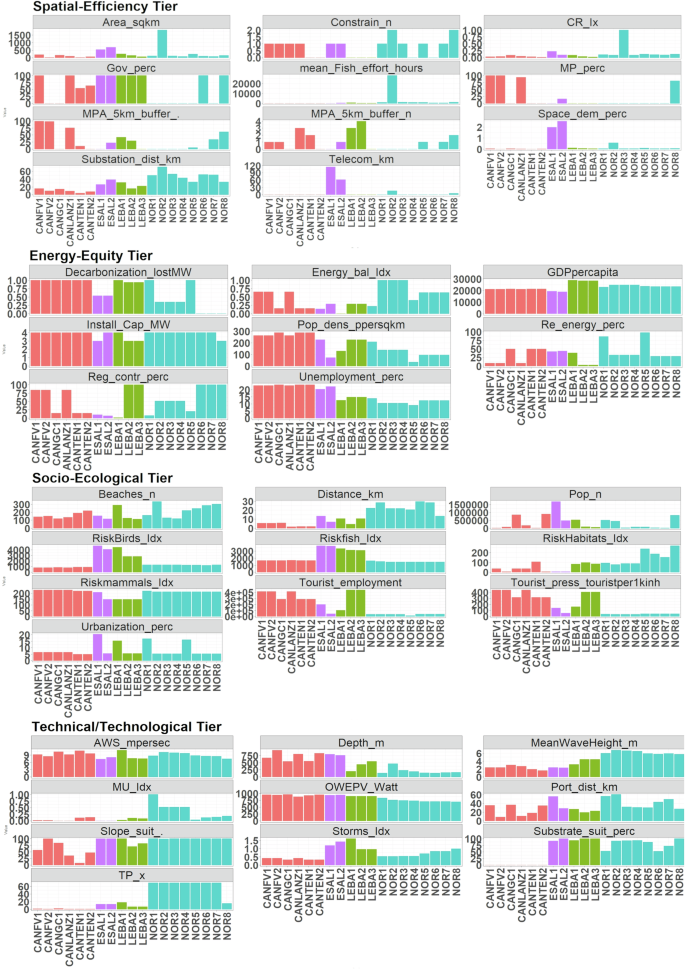
Table 1 provides the abbreviations and methodological description of each criteria.
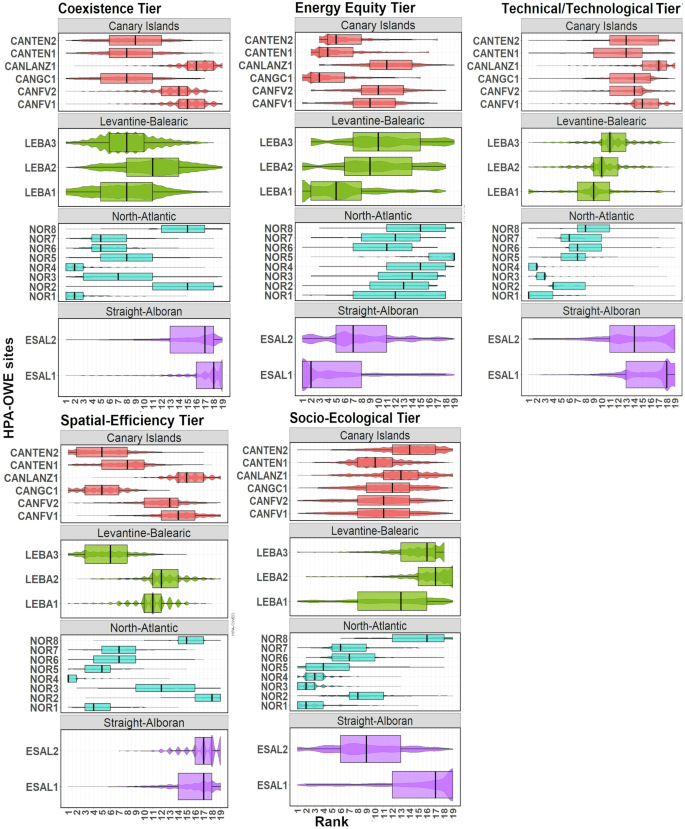
The x-axis defines the rank from 1 to 19 of the HPA-OWE, the y-axis defines the assessed HPA-OWE site.
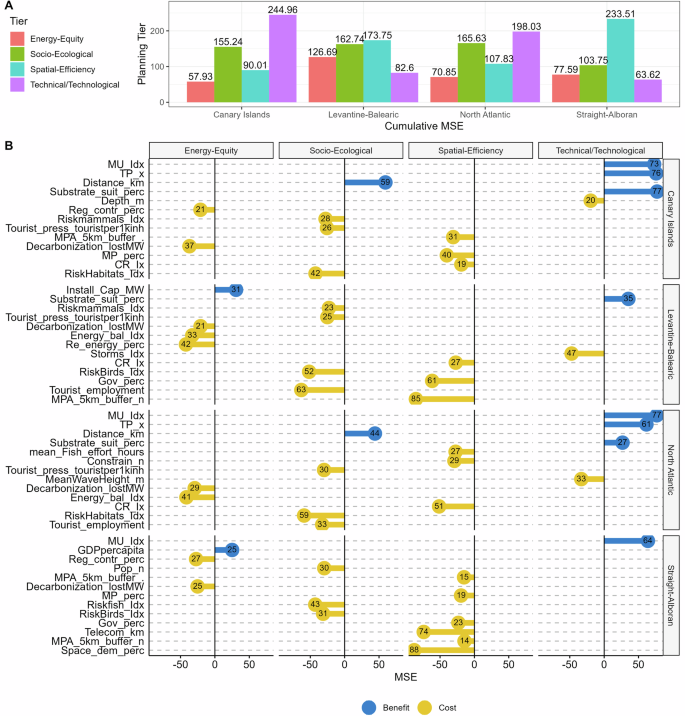
A Cumulative-MSE (C-MSE) for each planning subdivision and B specific MSE score for 13 highest costs and benefits in the 39 criteria database according to four different planning tiers.
On February 2023 the Spanish Ministry for the Ecological Transition and the Demographic Challenge adapted the first Spanish Maritime Spatial Plan (Planes de Ordenación del Espacio Marítimo—POEM; BOE-A-2023-5704)6, by the Council of Ministers by Royal Decree. It establishes plans for five planning subdivisions (Fig. 1): Canary Islands (CAN); Straight-Alborán (ESAL); Levantine-Balearic (LEBA), South-Atlantic (SUR) and North-Atlantic (NOR). There are 19 HPA-OWE covering 0.4% (5056.7 km2) of the entire Spanish EEZ (Table 2). The two HPA-OWE located in the ESAL planning subdivision have highest sea space occupation 4.9% (1234 km2). At the time of the release of the POEM, no HPA-OWE was defined in the South Atlantic (SUR) subdivision. The National Integrated Plan for Energy and Climate (PNIEC) foresees to install 3 GW of offshore wind capacity by 2030.
Results
Criteria performance
Figure 2 provides an overview of the 39 criteria and the planning tier setup. We summarize the most noticeable aspects. The Coexistence Tier is the overall tier (n = 39 criteria) that incorporates the socio-ecological tier (n = 10 criteria), technical/technological tier (n = 10 criteria); spatial-efficiency tier (n = 11 criteria) and the energy-equity tier (n = 8 criteria). Spatial-Efficiency criteria. NOR2 is the most extended HPA-OWE development, it is the most constrained area as located in military areas and shipping lanes and has highest intensity of interactions with commercial fishery (27,997 h of displacement in 2021). NOR3 is the area with the highest collision risk potential in the North Atlantic subdivision and ESAL1 in the Mediterranean. Eight HPA-OWE fully overlap with restricted areas (Gov_perc) for offshore wind energy development. There are three HPA-OWE that fully or partially overlap with marine protected areas in the Canary Islands (CANFV1, CANFV2, and CANLANZ1), the Straight-Alborán (ESAL2) and North Atlantic (NOR8). Socio-Ecological criteria. HPA-OWE located in the North Atlantic subdivision shows higher distance from shore (28–13 km). Mediterranean HPA-OWE are mostly located in high population areas such as ESAL1 and 2. Highest urbanization patterns are in ESAL1 (20.5%), NOR1 (16.9%) and LEBA1 (15.3%). Ecological risks to birds and fish resources are higher in Mediterranean HPA-OWE compared to the North Atlantic subdivision. Energy-Equity criteria. Coastal provinces of LEBA1 to 3 have the highest GDP per capita (2021) compared to coastal provinces. Renewable energy percentage is highest in NOR5 and lowest in the LEBA2 and 3 located in the Balearic Islands. Unemployment rates are high in the Canary Islands and the ESAL1 and 2. Technical/Technological criteria. Multi-use potentials (MU_Idx) with offshore wind energy—aquaculture MU are NOR1 (score 1) and NOR 2–4 (score 0.52) in the North Atlantic. Multi-use potentials with Photovoltaic power are highest in the Canary Island, Straight-Alborán, and Levantine Balearic subdivisions. Increased storm frequency due to climate change can cause damage to infrastructure and to the operational safety of the site is most relevant in the Mediterranean HPA-OWD (LEBA1, ESAL2, and 1).
Ranking of HPA-OWE
Results for the ranking of the HPA-OWE were presented for a data frame of 390,000 weights and 30,000 ranking results. They were graphically presented as boxplots (Fig. 3) in terms of median rank (x̃) and as interquartile range of ranks (IQR). We synthesize the results for the first ranked HPA-OWE for each planning tier in the Atlantic (NOR and CAN) and for the Mediterranean subdivisions (LEBA and ESAL):
-
Coexistence Tier. In the Atlantic subdivision NOR1 (x̃ = 2; IQR = 1–3) and NOR4 (x̃ = 2; IQR = 1–3) and in the Mediterranean subdivisions LEBA3 (x̃ = 8; IQR = 6–10) and LEBA1 (x̃ = 8; IQR = 5–11).
-
Spatial-Efficiency Tier. In the Atlantic subdivisions NOR4 (x̃ = 1; IQR = 1–2) and NOR1 (x̃ = 4; IQR = 3–6) and in the Mediterranean subdivisions LEBA3 (x̃ = 6; IQR = 3–8) and LEBA1 (x̃ = 11; IQR = 10–12).
-
Energy-Equity Tier. In the Atlantic subdivision CANGC1 (x̃ = 3; IQR = 2–6) and CANTEN1 (x̃ = 4; IQR = 3–7) and in the Mediterranean subdivisions ESAL1 (x̃ = 1; IQR = 1–8) and LEBA1 (x̃ = 5; IQR = 2–8).
-
Socio-Ecological Tier. In the Atlantic subdivision NOR1 (x̃ = 2; IQR = 1–4) and NOR3 (x̃ = 2; IQR = 1–3) and in the Mediterranean subdivisions ESAL1 (x̃ = 17; IQR = 12–19) and ESAL2 (x̃ = 9; IQR = 5–13).
-
Technical/Technological Tier. In the Atlantic subdivision 8 HPA-OWE are within the first 10 ranks: e.g., NOR1 (x̃ = 1; IQR = 1–4) and NOR4 (x̃ = 2; IQR = 1–2) and in the Mediterranean subdivisions LEBA1 (x̃ = 9; IQR = 7–11) and LEBA2 (x̃ = 10; IQR = 9–12). To notice is that ESAL1 performance is the weakest (x̃ = 18; IQR = 13–19).
Optimal ranking of HPA-OWE
The optimal ranking (Table 1) provides a definitive rank (R) on how often a specific HPA-OWE alternative ranks within the top-10 (ntop-10). In the supplementary information (Fig. 1), a detailed graphical overview of optimal rankings is available. We synthesize the results for the optimal ranking for the best-ranked HPA-OWE in the Atlantic (NOR and CAN) and in the Mediterranean subdivisions (LEBA and ESAL):
-
Coexistence Tier. In the Atlantic subdivisions NOR1 (R = 1; ntop-10 = 29,776), NOR4 (R = 2; ntop-10 = 29,709) and in the Mediterranean subdivisions LEBA3 (R = 5; ntop-10 = 22,869) and LEBA1 (R = 7; ntop-10 = 21,217).
-
Spatial-Efficiency Tier. In the Atlantic subdivisions NOR4 (R = 1; ntop-10 = 29,956); CANGC1 (R = 3; ntop-10 = 29,395) and in the Mediterranean subdivision LEBA3 (R = 5; ntop-10 = 28,252) and LEBA1 (R = 10; ntop-10 = 12,055).
-
Energy-Equity Tier. In the Atlantic subdivisions CANGC1 (R = 1; n = 27,383), CANTEN1 (R = 2; ntop-10 = 26,710) and for the Mediterranean LEBA1 (R = 4; ntop-10 = 25,422) and ESAL1 (R = 5; ntop-10 = 24,690).
-
Socio-Ecological Tier. In the Atlantic subdivisions (e.g., NOR4: R = 1; ntop-10 = 29,964; NOR3: R = 2; ntop-10 = 29,939) and in the Mediterranean subdivisions ESAL2 (R = 8; ntop-10 = 19074) and LEBA1 (R = 12; ntop-10 = 11,558).
-
Technical/Technological Tier. In the Atlantic subdivisions NOR4 (R = 1; ntop-10 = 29,109) and in the Mediterranean subdivisions LEBA1 (R = 9; ntop-10 = 20,706).
Cost-benefit analysis at planning subdivision scale
The 13 most important criteria for each planning subdivision are represented as costs and benefits in form of cumulative mean square error (C-MSE; Fig. 4A) and in detail as single criterion (Fig. 4B). On overall, the C-MSE shows that the Spatial-Efficiency Tier has most importance in ESAL (C-MSEESAL = 233.51%) and LEBA (C-MSELEBA = 173.75%). While the Technical/Technological Tier has more relevance in the North Atlantic (C-MSENOR = 198.03%) and CAN (C-MSECAN = 244.96%).
In the Socio-Ecological Tier (C-MSELEBA = 162.74%) and the NOR (C-MSELEBA = 165.63%). Tier-specific results indicate that the Energy-Equity Tier shows that recurrent costs are associated provincial contribution to the energy balance for Levantine-Balearic (MSELEBA = 42%) and North Atlantic (MSENOR = 41%) and loss of MW due to national decarbonization policies (MSENOR = 37%).
The Spatial-Efficiency Tier is related to the proximity of HPA-OWE development to marine protected areas (MSELEBA = 85%), space demands (MSEESAL = 88%), and the presence of telecommunication subcables (MSEESAL = 74%) are relevant for the Straight-Alborán subdivision. In the Socio-Ecological Tier, habitat risks (MSENOR = 59%), risks to birds (MSELEBA = 52%), and risks to fish (MSEESAL = 43%) and mammals (MSECAN = 28%). The Technical/Technological Tier include Storm Frequency (MSELEBA = 47%), wave height (MSENOR = 33%), and depth (MSECAN = 20%).
Discussion
In addressing the fundamental challenge of transitioning towards sustainable use of marine resources and sea space utilization, our study aims to strategically re-analyze proposed HPA-OWE sites of a national maritime spatial plan through balancing ecological, social, spatial, energy-related, and technical/technological characteristics. To respond to this challenge, we develop a 39-criteria dataset and apply an ensemble MCDA based on three algorithms, resulting in a database of 30,000 ranking results. The optimal prioritization of HPA-OWE development (Table 1 and Supplementary Figure 1) based on the coexistence planning tier are:
Atlantic subdivisions:
NOR1 (ntop-10 = 29,776); NOR7 (ntop-10 = 27,475) and NOR4 (ntop-10 = 29,709);
Mediterranean subdivisions:
LEBA3 (ntop-10 = 22,869); LEBA1 (ntop-10 = 21,217) and LEBA2 (ntop-10 = 12,217).
Our method can be extended to other geographic areas and handle decision-making problems of any other sectors of the Blue Economy: For instance to reach protection targets of 30% of sea space by the Biodiversity Strategy 2030, the method can be used for optimal allocation of new protected sites as well as for aquaculture development, ports or any other emerging marine renewables technology (e.g., wave energy converters, tidal energy etc…). The EnseMCDA modeling protocol is fully open source, using R-programming and a database of regional, national, European and global open data repositories (see Table 3). The adaptation of an ensembled MCDA technique and the use of uniformly machine-generated weights through Monte Carlo simulation have several advantages compared to traditional MCDA applications:
-
i.
Our technique has an enhanced robustness by combining multiple individual algorithms and mitigating the weaknesses of any single method22,23,24,25.
-
ii.
Our technique promotes a more objective and transparent method for criteria weighting, relying on empirical data rather than subjective, sector-specific or expert-based knowledge usually used in offshore infrastructure suitability analysis24,26.
-
iii.
The EnseMCDA technique is more effective in exploring different planning options through the generation of a large number of weight combinations.
-
iv.
The technique is more adaptable to evolving environmental, economic, policy, energy security, and social conditions. This adaptability is crucial for the design of MSP scenarios that have to respond to transition strategies, such as the European Green Deal (COM/2019/640), the EU Nature Restoration Law (2022/304 final), or the Just Transition Mechanism (2021/1056).
-
v.
The method is highly flexible and can be applied to any high-potential ocean technologies relevant to future maritime spatial plans, including the identification of nature-inclusive designs, nature-based solutions, vessel electrification potentials, ocean clean-up systems, etc…
-
vi.
The EnseMCDA model can make stakeholder engagement within MSP processes more dynamic, by testing planning proposals and measures for different Blue Economy activities and emerging technological solutions. This dynamism stems from the ability of the model to explore how different stakeholder perception and societal values and behaviours influence resources use, ensuring a more responsive and inclusive decision-making process.
In Europe, maritime spatial planners and decision-makers face challenges in implementing decarbonization policies. Our method is concrete and transparent as it enables the testing of different OWE planning scenarios under different social, ecological, economic, energy-related, and technological marine-coastal settings. The trade-off analysis based on the ML technique (Fig. 4) identified the cost-benefits in different planning subdivisions providing novel insights for future designs of maritime spatial plans that should aim to minimize the identified costs. For instance in the ESAL subdivision planning measures are required to ensure spatial-efficiency of allocation of HPA-OWE, in the LEBA technological solutions are required to reduce damage from increasing storm events and in the NOR, OWE-aquaculture multi-use potentialities should be further explored. Overarching to every subdivision remain the ecological risks from the interaction of the infrastructure with the ecological features that appear to be different in every subdivision (Fig. 4B): risks to habitats (NOR and CAN), to birds (ESAL, LEBA), to mammals (LEBA and CAN) and to fish (ESAL). Our model informs planners on the ecological risks in each planning subdivision that can, in the future, be used to provide recommendations for the design of the HPA-OWE, explore nature-inclusive solutions designed for specific HPA-OWE or based on precautionary principles recommend no-development areas.
Our study incorporates a fully novel indicator set on the energy-equity highlighting that there are spatial disparities in coastal provinces where HPA-OWE are planned. OWE allocation within MSP process needs to be integrated with distributional equity principles when defining HPA-OWE. The indicators include energy production-consumption balance, renewable energy production, provincial contribution to regional energy production, decarbonization policies aimed at coal plants closure or repurposing (CRiT—Coal Regions in Transition, 2017)27 and social conditions, including unemployment rate (in %) and GDP per capita (see Table 3). Between 2019 and 2023, in coastal regions and provinces of Spain, there are at least 10 coal power plants shut down totaling about 7452 MW of lost energy production (Supplementary Table 2). Our ML results (Fig. 4) show that energy-equity aspects are important within the multi-criteria technique: applying National Statistics data (2021) shows that socio-economic wealthy coastal provinces are, in some cases, “energy privileged” areas (Supplementary Tables 1 and 2): For instance coastal provinces of the Levantine-Balearic subdivision (LEB1—Girona province and LEBA2&3-Las Palmas province) have highest GDP per capita (€28,666–€28,325 per year), comparably low unemployment rates (12.7%-14.9%) in respect to Canary Island (€21,344–€21,164; 23–23.5%) or Straight-Alborán (€18,861–€19,276; 20.4–22.2%) subdivision and their coastal regions are little affected by decarbonization policies aimed at coasl plants closure or repurposing. However, the Girona province in front of LEBA1 HPA-OWE is the most energy-reliant coastal province with the most negative energy balance of −3921 GWh (produced vs. consumed ratio) among the 9 coastal provinces and the Principality of Asturias.
The proposed socio-ecological dataset is composed of four risk indicators (risk to habitats, marine mammals, birds, and fish; Fig. 2). Particularly relevant in this context is the application of cross-seabasin datasets of fish, birds, and mammals at the scale relevant for strategic environmental assessment with a common methodology applicable at Mediterranean (LEBA and ESAL) and Atlantic seabasin level (NOR and CAN). The results indicate the need for techniques in cumulative effects assessment that can be coupled with species distribution models adequate for addressing the multiple interactions of the infrastructures with the ecological receptors. The ML results for the socio-ecological tier indicate that the LEBA planning subdivisions with the highest importance for impacts on the coastal tourism sector (Fig. 4): areas show to be highly dependent on coastal tourism employment (between 102,680 and 438,976 jobs; MSELEBA = 63%) and tourism pressures (161.1–404.6 tourist/inhabitant; MSELEBA = 63%). The ecological risks are predominant for birds (MSELEBA = 52%) and marine mammals (MSELEBA = 23%), for fish in the ESAL (MSEESAL = 28%), and for marine habitats in the Canary Islands (MSECAN = 42%).
Spatial efficiency in the HPA-OWE allocation shows that the ESAL1 and 2 in the Straight-Alborán subdivision face the highest planning-efficiency challenges. The C-MSE (Fig. 4A) is the highest among all planning subdivisions (C-MSEESAL = 233.81%). ESAL1 and 2 are the HPA-OWE that have the highest space demand (Fig. 4; MSEESAL = 88%). In the ESAL, the installation of OWE also requires planning measures associated with submerged cable protection and intersection in the area (MSEESAL = 74%). Our model evidence that spatial compatibility of HPA-OWE with MPAs is an important planning conundrum in LEBA (MSELEBA = 85%) and the ESAL (MSEESAL = 14%) due to spatial adjacency and in CAN (MSECAN = 40%) due to overlay of HPA-OWE and MPA. To analyze the interaction with commercial fishery activities we analyze the overlay of HPA-OWE with fishing hours in the year 2021. The highest displacement is caused within the North Atlantic Demarcation (MSENOR = 27%; 34,368 h of displacement).
About 14.6% of the study area is covered by military areas, so that exploring wind energy potentials in military areas as envisioned in the DG ENER’s SYMBIOSIS Program28 can promote co-location of military area with HPA-OWE and alleviate spatial competition with sectors omitted from military areas. Particularly relevant is this aspect in the Southern Atlantic subdivision (see Fig. 1) where presence of military areas is particularly pronounced.
In terms of technical/technological tiers, there is an increasing interest on a European level (European Maritime, Fishery and Aquaculture Fund 2023) to promote multi-use as synergic use of infrastructure in maritime spatial plans (e.g., Italian MSP proposal for the Tyrrhenian Sea) and identify regulatory mechanisms for multi-use licensing. Our model takes into consideration OWE combination with aquaculture29 and hybrid energy infrastructure with solar energy30. Figure 4 shows that OWE-aquaculture is one of the important technical/technological solutions in the North-Atlantic (MSENOR = 77%), Canary Islands (MSECAN = 73%), and the Straight-Alborán (MSEESAL = 64%).
The cross-seabasin nature of the study (Atlantic Ocean and Mediterranean) poses substantial challenges in the data collection, criteria preparation, and analysis phase. Currently, for Spain, there are very few comprehensive studies on biodiversity distribution applicable to the entire Spanish maritime spatial plan. Studies are either sea-basin focused, such as for the Mediterranean (Agreement on the Conservation of Cetaceans of the Black Sea, Mediterranean Sea, and contiguous Atlantic—Accobams31) or some regions of the North Atlantic planning subdivision Basque Country32 and OSPAR level33. This required in our study a fit-for-purpose mapping approach through the design of a spatial-ecological dataset required as input for the ecological risk analysis (birds, fish, and mammals). A cross-seabasin mapping exercise was the use of the species abundance maps from the IUCN Spatial Data Portal34 that were scaled on a 5 km2 grid35. In contrast, marine habitats were represented through EUNIS maps that are scalable across the European seas. Similarly, the sensitivity scores of habitat types (0–5) and ecological features were derived from sensitivity look-up tables from EIONET36 for the Atlantic Ocean and the Mediterranean, enabling the development of a scalable approach to cumulative ecological risk mapping for the study area that can also be used in other European seas.
We applied a 5 km buffer to survey the number of marine protected areas in the surroundings of each OWE site and to address the km2 of marine protected areas within 5 km distance from each HPA-OWE (see Supplementary Table 1). Buffer zones as distance-based tools can be an important instrument to enforce precautionary principles within a wider combination of spatial indicators that could be implemented, such as technical solutions, avoidance of sensitive areas and of sensitive periods, pollutant-specific mitigation measures (Methodological Guidance 2021/C 437/01)37. We also refer to EU nature legislation (Commission Notice 2020)38 that expresses the need for caution on the use of buffer zones in wildlife sensitivity mapping, especially when defining zero-development areas in recognition of the uncertainty associated with the spatial data and knowledge.
Another limitation is that small-scale fishery (SSF; vessel length < 15 meters) data is not included in our analysis, but it is a fundamental contributor to local economies in Spain39,40,41 and globally42, so that data collection techniques to better take into account interactions of SSF with HPA-OWE are needed in the near future. To our knowledge, only the Polish Maritime Spatial Plan43 provides an operational integration of SSF into a national ocean plan.
Building on this work, we argue that incorporating place-based datasets can provide important insights into the energy performance of the study area and offer knowledge for more balanced decisions of future marine energy infrastructure allocation. Maritime spatial plans need to contribute to reducing spatial inequalities by balancing environmental, social, spatial, energy-related, and technological characteristics of a territory. This means that planning approaches aimed at locating offshore wind energy infrastructure in degraded sea areas or urbanized coasts without taking into consideration the social conditions can increase spatial inequalities and further impair environmental resources. Particularly important in this case are social conditions in coastal territories with low income, territories affected by decarbonization policies or high unemployment.
Moreover, knowledge of place-based socio-economic conditions is fundamental for next-generation maritime spatial plans and for a just energy transition. A better understanding of the marine ecosystem services44 requires the integration of Blue Economy datasets45,46,47 (sectorial jobs, revenue), as they enable to understanding the costs and benefits of interactions of offshore wind energy with other sectors (especially commercial fishery, tourism, and shipping) of the Blue economy and can help to produce more informed planning outcomes for society.
Through the five planning tiers, we explore stereotypical dimensions of planning choices and the essential need for interdisciplinary knowledge and data for their implementation. Our method provides a relevant starting point for the definition of new generation of MCDA methods for more transparent and robust exploration of planning decisions in OWE development that however can be extended to any other offshore infrastructure, to conservation planning or any other coastal and maritime activities allocation.
Methods
Figure 5 lays out the methodological framework adopted in this study, exemplified for planning challenge of HPA-OWE development. In the following materials and method section and in the supplementary information a detailed description of each methodological step and data sources is provided.
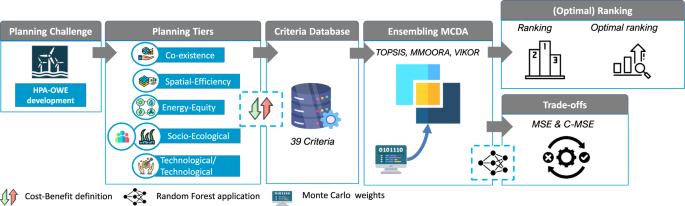
The Ensemble Multi-Criteria Decision Analysis (EnseMCDA) approach incorporates three distinct multi-criteria methodologies: TOPSIS, MMOORA, and VIKOR. Each of these techniques was executed using a set of 10,000 unique weights for each criterion (39 criteria × 10,000 weights = 390,000 weights). These weights were derived through a Monte Carlo simulation process. Consequently, a total of 30,000 rankings were generated, with each methodology contributing 10,000 ranks. These rankings were then consolidated and presented in the form of priority ranks and optimal priority rankings. This comprehensive approach ensures a robust and reliable decision-making process. Machine Learning Technique based on Random Forest was applied for the identification of trade-offs using a C-MSE—cumulative means standard error (Fig. 3A) and the MSE for single criteria (Fig. 3B).
Defining planning tiers
In order to formulate planning relevant outcomes we define five exploratory planning tiers. Planning tiers can provide a set of plausible spatial planning rationales applicable to sectorial MSP challenges such as OWE development15,48. Each of the five planning tiers consists of a descriptive planning narrative (Table 4) derived from the MSP Directive (2014/89/EU), the national plan (BOE-A-2023-5704) and planning research theory. In the EnseMCDA model each tier gets unpacked by a group of criteria. To note is that the coexistence tier is the overall tier and incorporates all 39 criteria displayed in Fig. 2 and described in Table 3.
Criteria database and preparation
The criteria were developed using a comprehensive open-source database of indicators. In total 39 indicators were developed (Table 3) and organized into four categories (ecological, social, spatial/technical, and energy-equity; see Supplementary Table 1). Table 3 provides an overview of the criteria including the cost or benefit attribution (n = 29 are costs and n = 10 are benefits), a methodological description and the data sources. The preparation of the spatial layers was performed with ArcGIS 10.7 (ESRI, 2022). The 19 HPA-OWE (high potential areas for offshore wind energy areas – “Zonas de alto potencial para el desarrollo de la energía eólica marina”) and the 5 planning subdivisions of the Spanish Maritime Spatial Plan (“Ámbito espacial del POEM”) were downloaded from MITECO, 2023 (see Fig. 1).
The indicators were then categorized based on a literature review49 into costs and benefits. We apply a precautionary principle in the cost and benefit attribution selection so that in case a criterion is used in an ambiguous way in different literature, it is defined as cost in our model. Costs refer to anti-ideal solutions that reflect the worst possible value for a specific indicator (e.g., collision risk, distance to coast, overlay with protected areas). Benefits refer to ideal solutions that reflect the best possible value for a specific indicator (e.g., average wind speed, distance from ports).
Creating a decision matrix
After the development of the indicator database, a decision matrix (Table 5) is set up with HPA-OWE1-19 being the 19 alternative HPA-OWE defined within the Spanish Maritime Spatial plan. The alternatives are characterized by a total of 39 criteria (C1–C39) described in Table 3.
Ensembled multi-criteria decision analysis
We apply an ensembled multi-criteria decision analysis (EnseMCDA) technique based on the “MCDM” (multi-criteria decision modeling) library available in R programming language50. The library has the advantage that it can rank alternatives using three MCDM techniques as follows (Table 6): (i) TOPSIS (Technique for Order of Preference by Similarity to Ideal Solution)19; (ii) Multi-MOORA (Multi-Objective Optimization by Ration Analysis (MOORA)—Full Multiplicative Form)21; (iii) VIKOR (Multicriteria Optimization and Compromise Solution)20. Once the cost or benefit of the criteria used and their relative weight have been defined, the algorithms will assign a score for each alternative. However, although it is objective to decide whether the criterion represents a cost or a benefit, the weight attributed to each criterion varies based on the opinions of experts. In order to overcome the expert-based weighting, we apply a non-conditioned weighting mechanism with weights attributed via Monte Carlo simulation, using a continuous uniform distribution. Namely, 10,000 uniformly distributed weights were generated for each criterion in a range between 0.1 (low importance) and 0.99 (very important), as shown in Table 7. The uniform distribution represents an optimal choice in the Monte Carlo simulation when a certain variable is contained in a certain interval, but there is no reason to consider some values more plausible than others51. In this way, the alternatives will be evaluated for a wide range of weights. Compared to the traditional method, there are two main advantages: i) The most robust alternatives can be highlighted, whose score varies little as the weights vary and ii) The criteria that most influence the score of the alternatives can be recognized. The adopted approach generates 10,000 rankings for each MCDA method. These results in a total of 30,000 rankings, corresponding to the number of weights produced through the Monte Carlo simulation. The results were visually represented using boxplots (Fig. 3) to display all the scores acquired from each HPA-OWE.
Optimal ranking
Reducing complexity in spatial decision-making is pivotal as it helps build consensus and agreement among stakeholders with diverse backgrounds and perspectives. For this purpose we synthesize results with an optimal ranking. The optimal ranking is the definitive rank (R) that calculates how often a HPA-OWE falls within the top-10 ranks (ntop-10) of the ranking database generated. Table 1 provides a synthesis of the results for the Atlantic (CAN and NOR) and the Mediterranean subdivisions (ESAL and LEBA). In Supplementary Figure 1, a graphical representation of ntop-10 is provided.
Trade-off analysis
Trade-off analysis is the process of evaluating the costs (disadvantages) and benefits (advantages) associated with different decisions, actions, or allocations of resources within maritime areas. In ocean planning, trade-off analysis can be important because it helps choose the optimal location of wind farms and minimizes conflicts among the multiple sectors, resources, and values. This improves transparency in the decision-making process, promotes efficient solutions, and maximizes sector values. In ocean planning, a limitation of trade-off analysis is the local geographic scope and its dual or triple sector analysis (e.g., offshore wind energy—fishery—marine protection)52,53 often settled into the ecosystem services domain49.
To identify the costs and benefits that significantly impact the scores of the 19 HPA-OWE alternatives examined in this study, we employed the random forest machine learning (ML) algorithm from the “randomForest” R package54. This algorithm is suitable for both classification and regression tasks and assesses the importance of variables involved in the model by calculating the increase in the model’s mean square error (MSE) when a variable is omitted. The algorithm was trained using the weight matrix, which was assigned to the 39 criteria, as predictors (e.g., W1, W2,…,W10,000) and the average score derived from the EnseMCDA for a specific HPA-OWE alternative (e.g., x̃ Scores-W1, x̃ Scores-W2, …., x̃ Scores-W10,000) as response variable. This training process enabled the algorithm to discern how score variations for each HPA-OWE are influenced by the weights assigned to the different criteria. To characterize the importance of the planning tiers at the planning subdivision level we formulate a cumulative MSE (C-MSE) for each planning subdivision. The results (Fig. 4B) unveil what costs and benefits affect most significantly the average score obtained from the four planning subdivisions, providing a robust trade-off analysis at the relevant planning scale. Supplementary information (Table 5) provides a look-up table with the MSE scores for each planning subdivision and planning tier.


Responses