Multi-omics integration analysis and association study reveal the potential of ADIPOQ function in gestational diabetes mellitus

Introduction
Gestational diabetes mellitus (GDM) is a prevalent metabolic disorder encountered during pregnancy, with prevalence estimates varying from 2 to 25% globally [1, 2]. This condition poses a significant and escalating health risk to women globally, particularly in low- and middle-income countries where over 90% of cases of hyperglycemia in pregnancy occur [3]. GDM is associated with a range of short- and long-term complications for offspring, encompassing birth trauma, macrosomia, neonatal hyperinsulinemia, cardiovascular disease, depression as well as anxiety [4, 5]. For mothers, the risk of preeclampsia and cesarean delivery greatly increases with GDM [6, 7]. Emerging evidence suggests that fetal growth trajectories are potentially altered in pregnancies owing to GDM [8], which may negatively affect the neurodevelopment of offspring [9]. However, the molecular mechanisms underlying GDM are still under extensive investigation. Metabolic disturbances in women with GDM may begin early in pregnancy, even before the clinical onset of glucose intolerance [10, 11]. Hence, the identification and validation of sensitive, selective, and reliable biomarkers, which facilitate risk stratification for GDM either during early pregnancy or even before conception, will mitigate the occurrence of GDM and improve its treatment, benefiting both maternal and fetal health.
GDM is a multifaceted metabolic disorder resulting from an intricate interplay between genetic factors and environmental influences [12,13,14]. Understanding the key mechanisms underlying this disorder is crucial for developing tailored and effective therapeutic interventions. The ultimate goal is to accurately assess physiological processes and identify optimal biomarkers for preventing metabolic diseases, guiding mechanistic investigations, and refining treatment strategies. The limitations of single-omics data underscore the importance of multi-omics research, which includes genetics, transcriptomics, and epigenomics [15]. This approach offers unique advantages and a new perspective for systematically and comprehensively understanding the underlying mechanisms of chronic metabolic diseases [16, 17]. Despite these advancements, the integration of multi-omics in the context of metabolic diseases remains in its early stages, requiring further efforts before it can be applied to precision medicine in GDM clinical practice [17].
Adiponectin, a hormone secreted by adipocytes, is encoded by the ADIPOQ gene. Adiponectin plays a crucial role in multiple metabolic processes, such as lipid metabolism and the oxidation of glucose and fatty acids. During pregnancy, ADIPOQ expression is reduced, particularly in women with GDM, leading to lower plasma concentrations [18]. ADIPOQ is associated with decreased insulin resistance, enhanced lipid metabolism, and anti-inflammatory properties [19,20,21]. Consequently, ADIPOQ is widely studied as a potential biomarker for predicting the risk of developing GDM [22].
Previous research has demonstrated an association between ADIPOQ and GDM [18, 22]; however, most of them are mono-omics studies. Multi-omics will provide even more important and comprehensive insights into the understanding of GDM [23]. In this study, we examined the association between SNPs rs266729, rs1501299 on ADIPOQ and the S/D of umbilical artery in GDM. Furthermore, we investigated the ADIPOQ-mediated signaling pathways associated with GDM from a multi-omics perspective. The findings of this study demonstrate that ADIPOQ plays a crucial role in GDM by modulating inflammatory and adipose-metabolism-related pathways, genes, and cellular expression. The current study could give comprehensive biological insights into the pathogenesis of GDM and serves as a reference for early prediction of GDM at risk. This suggests that early management of personal lifestyle interventions, such as diet, weight control, exercise, can be implemented even before the clinically detectable onset of glucose intolerance as these pregnant women were genetically at risk of GDM.
Materials and Methods
Study subjects
All subjects of this study were recruited from the same center (Department of Obstetrics and Gynecology, 2nd Affiliated Hospital of Harbin Medical University, Harbin, Heilongjiang, China) between December 2016 and December 2018, 560 patients of GDM and 597 pregnant women with a normal oral glucose tolerance test (OGTT) during the same period were included in the group. According to the 2015 International Association of Diabetes and Pregnancy Study Groups (IADPSG) criteria [24], the GDM were patients with a 75 g OGTT at 24–28 weeks’ gestation. The diagnostic criteria for GDM were established based on the attainment or surpassing of specific plasma glucose values during OGTT, including fasting plasma glucose of 92 mg/dL (5.1 mmol/L), 1-hour plasma glucose of 180 mg/dL (10.0 mmol/L), and 2-hour plasma glucose of 153 mg/dL (8.5 mmol/L). The exclusion criteria for this study included pre-gestational diabetes mellitus, multiple pregnancies, hypertension, non-Han Chinese populations, liver and renal dysfunction, complications with systemic metabolic diseases such as thyroid dysfunction, systemic lupus erythematosus, rheumatoid disease, and other diseases that may cause abnormal blood glucose during pregnancy. Additionally, subjects who failed genotyping were excluded from the analysis (n = 19). Following the exclusions, a total of 519 GDM patients and 498 controls were recruited for the study. All subjects signed informed consent, which was approved by the ethics committee of the 2nd Affiliated Hospital of Harbin Medical University (KY2019-118).
Selection of SNPs
Recent genome-wide association studies (GWAS) have identified ADIPOQ as being significantly associated with both T2DM and the metabolic syndrome [25,26,27,28]. ADIPOQ gene polymorphisms have been found to have a significant impact on blood glucose control and lipid balance. However, the influence of these genetic variants on fetal umbilical artery flow parameters in cases of gestational diabetes mellitus (GDM) remains unclear. Based on the findings of GWAS for T2DM, where the minor allele frequency (MAF) was found to be greater than 0.15 in the Chinese population, we have selected two candidate single nucleotide polymorphisms (SNPs) (ADIPOQ rs266729 and rs1501299) that may potentially be associated with GDM.
Extraction and genotyping of DNA
Peripheral venous blood was collected from all subjects between 24 and 28 weeks of gestation at admission, and genomic DNA of each individual was extracted according to the protocol of TIANamp Genomic DNA Kit (Tiangen Biotech, China). Polymerase chain reaction (PCR) was used to amplify the polymorphic site of the ADIPOQ gene SNP. All genotyping experiments were performed by Shanghai BioWing Applied Biotechnology Company (http://www.biowing.com.cn) using three rounds of multiplex PCR combined with next-generation sequencing methods [29]. Primer3 online software (v0.4.0, http://frodo.wi.mit.edu/), Oligo (Molecular Biology Insights Inc, USA) and NCBI (http://www.ncbi.nlm.nih.gov/) were used to design amplify the primer sequences. After three rounds of multiplex PCR, the products were mixed in a centrifuge tube. Then they were sealed overnight with a sealing membrane. The mixture was purified by TiangelMidi Purification Kit (China Tiangen Biochemical Technology Co., Ltd.) according to the instructions. The purified PCR products were then paired-end sequenced using Illumina HiSeq XTen platform according to the instructions. FastX-Toolkit software was used to separate the sequences of each sample according to the Barcode sequences, and then Cutadapt software was used to remove the joints and index sequences contained in the sequences for subsequent analysis. Sequences were aligned to the human reference genome using BWA (v0.7.12) software, and SNP calling and genotyping were performed using SamTools (v0.1.19) software [30]. To control the quality of genotyping, the samples were randomly selected for blind DNA replication.
Physiological and biochemical index collection and analysis
In light of our prior investigations into the associations between ADIPOQ gene polymorphisms and clinical data on GDM in Chinese women, the present study primarily emphasizes the examination of fetal umbilical artery blood flow parameters. Data collected included fetal umbilical artery doppler systolic blood flow velocity (Vs), diastolic blood flow velocity (Vd), systolic blood flow velocity/diastolic blood flow velocity (S/D) ratio, fetal cord blood flow resistance index (RI).
ADIPOQ SNP association analysis
According to the clinical data of SNP sites in GDM, we used “circlize” R package [31] (version 3.6.1) to display the clinical characteristics corresponding to different base sites of rs266729 and rs1501299, including urine protein, hydroncus and age. In addition, Kruskal-wallis test was used for difference analysis of blood glucose concentration of OGTT corresponding to different base sites, and “ggplot” was used for display [32]. The sample homogeneity test of variance showed no significant difference (P > 0.05).
Data downloading and processing
We downloaded circRNA data from the gene expression omnibus (GEO) database (GSE182737). GSE182737: circRNA transcriptional spectrums of peripheral blood mononuclear cells between the 6 GDM patients and the 6 healthy controls were obtained through gene microarray technology. We downloaded miRNA data from the GEO database (GSE186883). GSE186883: miRNAs were extracted from extracellular vesicles isolated from maternal blood samples collected at different trimesters of pregnency. miRNA libraries were prepared, sequenced and analysed to identify the differential abundance during various pregnancy complications. We selected eight patient samples and three normal samples for analysis. lncRNA data (GSE65737) were downloaded from the GEO database.
GSE65737: thirty pairs of GDM macrosomia and normal controls were divided into three subgroups randomly, and the umbilical cord vein blood from each subgroup was mixed, and hybridized to a microarray. In addition, we downloaded gestational diabetes gene expression data (GSE70493). GSE70493: RNA was hybridization with GeneChip® Human Transcriptomic Array 2.0 (Affymetrix) from placentas (maternal side) of 30 clinically confirmed cases of GDM and 25 pregnancies without maternal complications.
Single-cell transcriptome data analysis
In order to ensure the high reliability and comparability of the data, we carried out quality control on the data. The quality control process can be summarized in the following four aspects. We filtered out genes expressed only in less than three cells, reducing unnecessary data dimensions. The cells expressing fewer than 200 genes or transcripts were excluded, as such cells may be empty droplets or form from other abnormal causes. Cells with a significantly higher number of transcripts or genes than normal are also filtered out, with a threshold of the top 1% of data. We filtered out cells that contained more than 15% mRNA of mitochondrial genes, because a high proportion of mitochondria might indicate that the internal structure of a cell has been damaged before a single cell can build a library [33]. Subsequent to the aforementioned procedures, a total of 14,015 cells were subjected to follow-up analysis.
After quality control, each data set was analyzed according to the standard procedure of R package “Seurat”. 1 The data is normalized to eliminate the influence of library size between different cells. 2 For feature selection, high-variable genes were selected for downstream analysis, and the first 2000 high-variable genes were selected. In the downstream analysis we focused on these high-variable genes to help highlight the biological signals in the single-cell data set. 3 Scaling the data, a common operation in machine learning, prepares for the next step of dimensionality reduction analysis. Principal component analysis and dimension selection: 4 Principal component analysis (PCA) was used to determine the most obvious biological signals in the data set, and the first N dimensions of PCA analysis results were selected for downstream analysis (N = 20) to reduce the data dimension. 5 For cell clustering, Seurat adopts the graph-based clustering method. Transcription factor (TF) activity is analyzed using pySCENIC and the original count matrix is taken as input. The “grnboost2” function was used to infer gene co-expression modules. The TF-rich regulators were then identified.
Differentially expressed genes identification
To identify differentially expressed genes, we used Bonferroni-Holm correction P < 0.05 and Limma R package of |log (FC)| > 1 to screen differentially expressed genes between normal and diseased patients.
Function annotation
Gene Ontology (GO) functional labeling and Kyoto Encyclopedia of Genes and Genomes (KEGG) enrichment analysis were performed for characteristic cytokines in each cluster using R package “clusterProfiler” [34]. P < 0.05 was corrected by Bonferroni-Holm correction to select the main functions and biological pathways of gene enrichment in each cluster. Subsequently, we used Gene Set Enrichment Analysis (GSEA) software to conduct GSEA enrichment analysis for related genes.
Construction of ceRNA regulatory network
LncRNAs were obtained from lnc2targetv2.0 database (http://123.59.132.21/lncrna2target) and miRNAs from mitarbase 2022 (http://miRTarBase.cuhk.edu.cn/). Cytoscape was used to construct the multifactor regulatory network of hinge genes.
DNA Methylation data analysis
According to GEO2R in GEO database (GSE180355), the DNA methylation sites of the difference between the control group and GDM were calculated, and the volcano map was used to display the difference sites. In addition, relevant sequence information was obtained according to the first 5 sites with significant differences, and miRNAs targeted by methylation sites were predicted using Miranda software. Cytoscape software (3.7.0) was used to construct miRNA networks targeting methylation sites [35].
Statistics and visualization of networks
All statistical analyses were performed using R statistical software and the biological networks were visualized using Cytoscape.
Results
Correlation analysis between ADIPOQ SNP and clinical features
SNP genotype and quality control
SNPs genotype Hardy-Weinberg equilibrium (HWE) were tested by SHEsis (http://analysis.bio-x.cn/myAnalysis.php). All SNPs were found to be in Hardy-Weinberg equilibrium in both cases and control subjects.
We addressed the relation of ADIPOQ with GDM in northern Han Chinese population, 519 GDM cases and 498 control subjects were included and their related physiological and biochemical data were analyzed. In our preliminary study, ADIPOQ may be involved in the pathophysiology of GDM [36]. In the study, we focused on ADIPOQ polymorphisms between rs266729 and rs1501299 and ultrasonic doppler parameters of fetus umbilical artery.
Case-Control ultrasonic doppler parameters of fetus umbilical artery analysis
We analyzed the distribution of genotype frequency of rs266729 and rs1501299 in ultrasonic doppler parameters of fetus umbilical artery between GDM and control. We found that the umbilical arter S/D ratio in GDM patients with CC genotype of rs266729 was higher than control (Fig. 1A). This difference could be due to the lower umbilical artery diastolic flow velocity (Vd) of CC genotype in rs266729 of GDM group (Fig. 1C). The CG and GG genotype of rs266729 have no significantly differences between S/D ratio in GDM and control (Fig. 1A). Furthermore, the S/D ratio in GDM patients with GG genotype of rs1501299 was higher than control. And The TT and TG genotype of rs1501299 have no significantly differences between S/D ratio in GDM and control (Fig. 1B). This may be caused by GG genotype of rs1501299 having a lower Vd in GDM group (Fig. 1D). Moreover, we analyzed the relationship between the distribution of genotype frequency in rs266729 and rs1501299 and umbilical artery flow resistance index (RI) and fetus weight. However, no significantly differences were found (Fig. S1). In conclusion, we further verified that ADIPOQ gene plays a role in fetal umbilical artery flow of GDM by case-control SNP data that we tested.

A Distribution characteristics of rs266729 genotypes in GDM and control group in S/D; B distribution characteristics of rs1501299 genotypes in GDM and control group in S/D; C distribution characteristics of rs266729 genotypes in GDM group and control of Vs and Vd; D distribution characteristics of rs1501299 genotypes in GDM group and control of Vs and Vd. Vs: Umbilical artery systolic flow velocity; Vd: Umbilical artery diastolic flow velocity; S/D: Umbilical artery systolic flow velocity/ Umbilical artery diastolic flow velocity.
The role of ADIPOQ in GDM was analyzed based on single-cell data
Based on the above analysis, ADIPOQ was identified to be linked to the clinical phenotype of GDM. We then focused on the role of ADIPOQ in regulation at the cellular level. scRNA-seq data on GDM were downloaded from the GEO database for single-cell analysis. Using marker gene annotation in known literature (Fig. S2A, Fig. S4), we obtained 9 main cell types, including macrophages, villous cytotrophoblasts (VCT) cell, granulocyte, extravillous trophoblast (EVT) cells, T cell, Monocytes, Myelocyte, natural killer (NK) cell and syncytiotrophoblast (SCT) cells [37] (Fig. 2A). We found that ADIPOQ was expressed in almost all cell types except granulocyte (Fig. 2B). In addition, we demonstrated the expression of other genes in the ceRNA network in cells of GDM, and we found that the expression of other genes at the cellular level was not significantly high compared with ADIPOQ (Fig. S2B–F, Fig. S3). We then calculated the expression-related genes of ADIPOQ and based on those genes cellchat analysis was operated. Cellchat analysis revealed strong interactions between these cells, and we hypothesized that ADIPOQ plays an important role in these interactions (Fig. 2C, Fig. S5). In addition, we used String database to construct the interaction relationship between ADIPOQ and important genes in ceRNA network, and we found that ADIPOQ and CASP3 gene had an interaction relationship (Fig. 2D). We used single-cell TF analysis to obtain TF interaction networks related to ADIPOQ gene, and conducted functional enrichment analysis to find that these interacting TFs are related to miRNA transcription, mononuclear cell differentiation, and eye development functional correlation (Fig. 2E, F). Subsequently, we found that VCT cells were located at the head of cell development, while SCT cells were located at the tail of cell development, and ADIPOQ was highly expressed in SCT cells through cell trajectory analysis (Fig. 2G). Finally, we conducted cell locus analysis of key genes in ADIPOQ-mediated ceRNA networks, and we found that ADIPOQ and CPEB4 were associated with cluster of cell development (Fig. 2H). In conclusion, through single-cell data analysis, we found that ADIPOQ was expressed in a variety of cell types in GDM, and there was strong interaction among these cell types. In addition, the important genes in the ceRNA network such as CPEB4 which ADIPOQ participation in were associated with the cell developmental trajectory. Therefore, ADIPOQ regulated cell interactions in GDM at the cellular level and had a corresponding regulatory role in cell locus development.
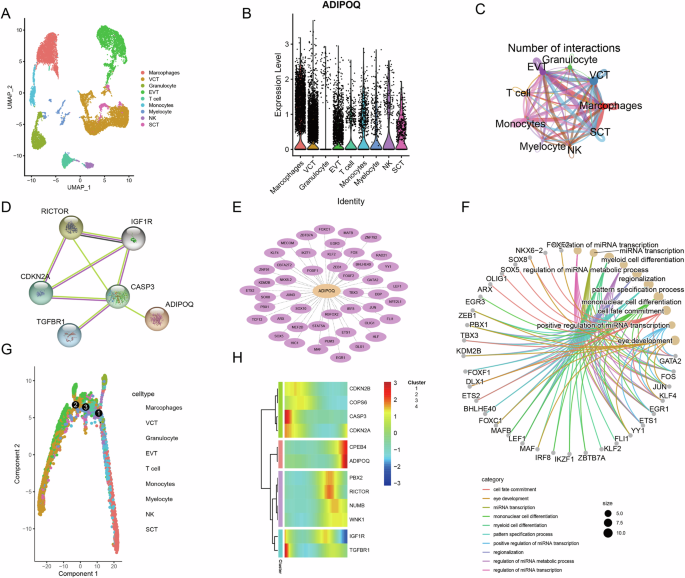
A Umap of cell types; B ADIPOQ expression in multiple cells; C diagram of the interaction network between cells; D ADIPOQ interaction network with important genes in the ceRNA network; E the network between ADIPOQ and TFs; F functional enrichment of ADIPOQ-related TFs; G cell locus map in GDM; H ADIPOQ mediates key genes in ceRNA networks for cell locus.
Construction of ceRNA network for regulating GDM
To investigate the role of ADIPOQ in the transcriptome of GDM, we analyzed data from the GEO database, including circRNA, miRNA, and lncRNA expression profiles. The differentially expressed circRNAs were calculated, and a total of 3276 differentially expressed circRNAs were identified. Heat map and volcanic map (Fig. 3A, B) were performed on the differentially expressed circRNAs. Additionally, we detected 23 differentially expressed miRNAs, which were also represented in heatmaps and volcano plots (Fig. S6A, B). For lncRNAs, 114 differentially expressed lncRNAs were identified and similarly visualized (Fig. S6C, D).
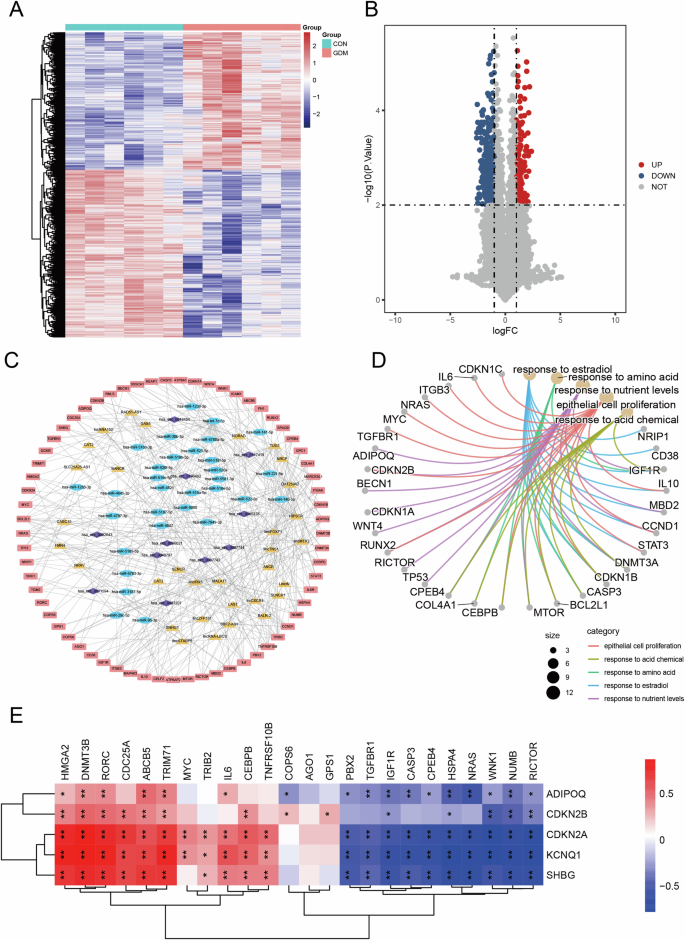
A The heatmap of differential expression circRNAs; B differentially expressed circRNAs volcanogram; C GDM related ceRNA networks include circRNA, miRNA, lncRNA and coding gene; D results of functional enrichment analysis of genes in network; E the genes involved in ceRNA correlate heat maps with the expression of genes associated with GDM.
To further explore the regulatory interactions, we retrieved human lncRNA-gene pairs from Lnc2TargetV2.0 and miRNA-target gene pairs from miRTarBase. The miRanda was used to predict the top 10 circRNA-targeted miRNAs with significant differential expression. We then constructed a disease-related ceRNA network specific to GDM, which comprised 11 circRNAs, 31 miRNAs, 32 lncRNAs, and 66 coding genes (Fig. 3C).
We conducted functional enrichment analysis of the genes in the ceRNA network based on the above results, and found that these genes were strongly correlated with response to estradiol, response to amino acid, epithelial cell proliferation and response to nutrient levels (Fig. 3D). These functions are associated with the development of GDM. Subsequently, we classified the functions into Biological Process (BP), (Cellular Component) CC and (Molecular Function) MF for display (Fig. S7A–C). We found that the ADIPOQ gene is associated with response to nutrient levels, fat cell differentiation. Adiponectin controls the metabolism of glucose and lipids and possesses insulin-sensitising effects [38]. Adiponectin deficiency is associated with GDM and low adiponectin levels in the first week of pregnancy are an independent predictor for the development of GDM in women [39, 40]. However, the causal mechanism is not yet completely understood and multi-omics research about ADIPOQ gene was not investigated. We obtained gene expression data of GDM from GEO database. We calculated the expression correlation between genes involved in ceRNA and ADIPOQ. We found that ADIPOQ gene is significantly positively correlated with 11 genes, such as HMGA2 and DNMT3B and significantly negatively correlated with 10 genes, such as FBX2 and TGFBR1 (Fig. 3E). We used String database to obtain the protein interaction network of ADIPOQ gene, and constructed the network by combining with gene expression correlation (Fig. S7D, E). The ceRNA network for GDM were constructed using a public database. We identified key genes involved in nutrient regulation that are associated with the onset and progression of GDM. Moreover, ADIPOQ was found to play a pivotal role in the ceRNA network of GDM, exerting significant regulatory influence on these crucial genes.
ADIPOQ network-mediated epigenetic regulation
We calculated the difference in DNA methylation sites between the control group and GDM group according to GEO2R in GEO database, and exhibited the differential DNA methylation sites (Fig. 4A). To further analyze ADIPOQ functional regulatory network mediated epigenetic regulation, we selected the top 5 DNA methylation sites (eg17986884, eg07667018, eg14694590, eg26688367, cg26528659) with significant differences for analysis, and the 5 most different sites were displayed. According to the sequence information of these 5 DNA methylation sites, miRanda was used to predict miRNAs targeted by methylation sites, and the network was constructed (Fig. S8). Next, we integrated the ceRNA network with the DNA methylation sites network, and finally constructed the ceRNA-mediated DNA-methylation sites network. The network contained 4 circRNAs, 3 DNA methylation sites, 23 miRNAs, and 39 related genes (Fig. 4B). We integrated the ADIPOQ gene related network and ceRNA network to construct a multi-factor mediated regulatory network for GDM. We found that there were more proteins interacting with ADIPOQ in both positive and negative regulatory networks (Fig. 4C, D). These results suggest ADIPOQ not only plays a regulatory role in the ceRNA network of GDM but significantly contributes to the methylation process involved in the progression of GDM.
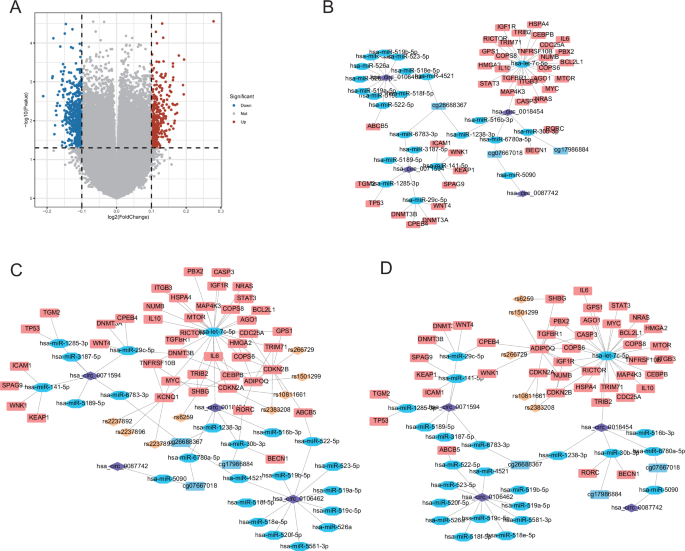
A Differential methylation sites in GDM Volcano map; B methylation sites involved in ceRNA network; C multifactor mediated positive regulatory network of GDM; D multifactor mediated negative regulatory network of GDM.
Construction of ADIPOQ functional regulation network
Through the above analysis, ADIPOQ was found to play an important role in transcriptional regulation and methylation progression of GDM. Following, we explored the functional regulation of ADIPOQ in GDM. We then obtained GDM-related pathways from the MSigDB database, including cellular response to insulin stimulus, fatty acid metabolism, biocarta nuclearrs pathway, and adipocytokine signaling pathway. In addition, we obtained gene expression data of GDM from GEO database, and used Pearson correlation calculation method to calculate the expression correlation between pathway-related genes and ADIPOQ. According to the expression correlation between genes, we analyzed the correlation of ADIPOQ in the pathway through the idea of GSEA enrichment. The results showed that ADIPOQ had significant negative regulation with cellular response to insulin stimulus (Fig. 5A), and the same phenomenon was observed in fatty acid metabolism (Fig. 5B). It has positive regulation in biocarta nuclearrs pathway and adipocytokine signaling pathway (Fig. S9A, B). We conducted correlation analysis between ADIPOQ and key genes in function for further validation. As shown in the results of GSEA, ADIPOQ was negatively correlated with the expression of MAPK9, NFκB1 and PRKAG1 (Fig. 5C, D, Fig. S9C). Subsequently, pathway genes related to ADIPOQ expression were screened out according to gene expression correlation, and ADIPOQ functional regulatory network was constructed (Fig. 5E). Cellular response to insulin stimulus, fatty acid metabolism, biocarta nuclearrs pathway, and adipocytokine signaling pathway played an important role in the occurrence and development of GDM. Our analysis found that ADIPOQ had a strong regulatory relationship in these functions. Therefore, we conclude that ADIPOQ gene also played an important role in the occurrence and progression of GDM.
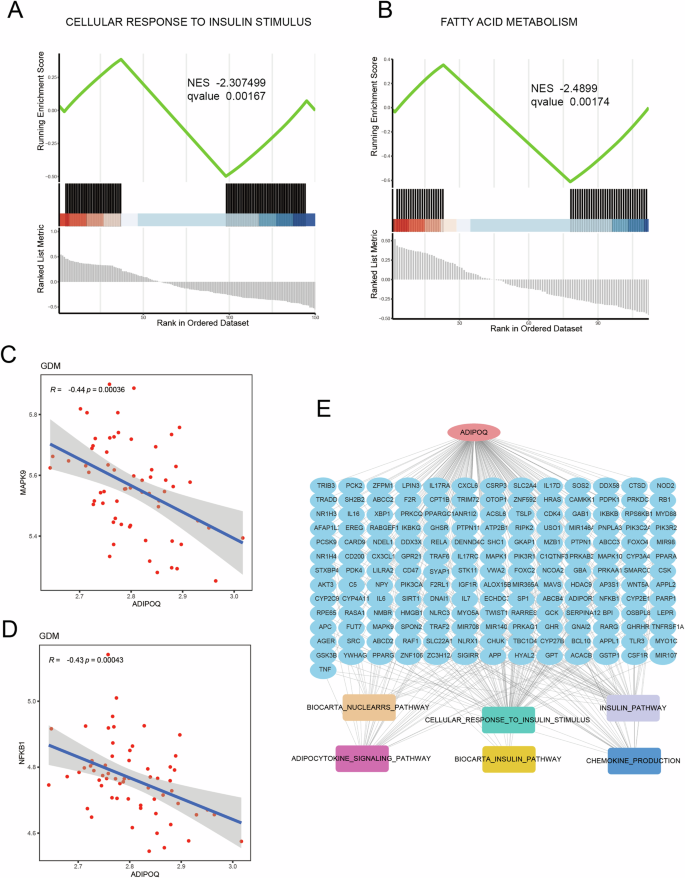
A ADIPOQ participates in GSEA enrichment of cellular response to insulin stimulus pathway; B ADIPOQ involved in GSEA enrichment of fatty acid metabolism Pathway; C correlation between ADIPOQ and MAPK9 expression; D correlation between ADIPOQ and NFKB1 expression; E functional control network of ADIPOQ.
Discussion
Pregnancy requires numerous metabolic adaptations to provide adequate energy for fetal growth and development. When maternal systems fail to adapt properly, metabolic disorders such as GDM can arise. GDM is a common pregnancy complication, and recent studies suggest that adiponectin is essential in regulating energy balance, supporting both a healthy pregnancy and the necessary metabolic adjustments following conception [41]. Systemic biological assessments using multi-omics analyses have demonstrated significant utility in identifying disease-associated molecules and their underlying mechanisms. However, to date, there has been a lack of comprehensive analysis examining the multi-dimensional molecular signatures of ADIPOQ in GDM. In this study, we examined the association between SNPs rs266729 and rs1501299 on ADIPOQ and the GDM cohort in the northern Han Chinese population. Furthermore, we investigated the ADIPOQ-mediated signaling pathways associated with GDM from a multi-omics perspective.
The ADIPOQ gene contains SNPs that potentially impact adiponectin expression in pregnancy through their influence on RNA splicing and stability [42]. Notably, the SNPs rs1501299 located in intron 2 and rs266729 in the promoter region have drawn attention in studies investigating the potential influence of genetic variability at this locus on the metabolic phenotypes of gestational diabetes mellitus (GDM). However, the conclusions from these studies were inconsistent, particularly regarding the extent to which GDM risk is affected by the aforementioned SNPs [43]. A previous meta-analysis has reported no significant associations between the rs1501299 polymorphism and the risk of GDM [44]. In our previous study, we observed an association between the genotypes of rs1501299 and rs266729 and blood pressure in GDM patients [36]. In the present study, we conducted further analysis to examine the relationship between the distribution characteristics of rs1501299 and rs266729 genotypes and fetal umbilical artery flow parameters. Our findings indicate that GDM patients with the CC genotype of rs266729 and the GG genotype of rs1501299 exhibited a higher S/D ratio compared to the control group. Additionally, GDM patients with the GG genotype of rs1501299 and the CC genotype of rs266729 showed a lower Vd. The results indicate that the genetic variations rs1501299 and rs266729 in the ADIPOQ gene may have an impact on the resistance of blood vessels. The research conducted by Christina et al. demonstrates that the rs1501299 and rs2241766 variants of the ADIPOQ gene play a significant role in determining the levels of interleukin 6 (IL-6), intercellular cell adhesion molecule-1 (ICAM-1), and vascular endothelial growth factor (VEGF) in individuals with type 2 diabetes mellitus. These findings suggest a potential interaction between adiponectin, proinflammatory factors, and angiogenesis pathways, which could be crucial in the progression of both macrovascular and microvascular diseases [45]. In this study, we aim to investigate the multifactorial nature of gestational diabetes mellitus (GDM) and its association with genetic and environmental factors. Specifically, we focus on the potential involvement of gene variants in the pathogenesis of GDM and their varying impact depending on other factors. To achieve this, we conducted further analyses to explore the role of the ADIPOQ gene in relation to GDM at various levels. It is worth noting that, to date, a complete set of transcriptome sequencing data encompassing circRNA, miRNA, lncRNA, and mRNA of GDM patients has not been identified. Therefore, in our analysis, we considered the changes in genes across different data sets and conducted a comprehensive multi-omics analysis.
The fundamental units of life are individual cells, and the analysis of single cells is a valuable approach for examining cellular heterogeneity in complex diseases. Prior research has shown that scRNA-seq can be employed to thoroughly characterize cellular heterogeneity, identify both known and unknown cell types and gene signatures specific to placental cells, uncover distinct cell subpopulations, and investigate transcription factors and potential intercellular communication patterns. Nevertheless, the majority of studies conducted thus far have not focused on diseases associated with pregnancy. In the present study, the expression of ADIPOQ was observed in nearly all cell types except for granulocytes in GDM. Cellchat analysis demonstrated robust interactions among these cells. Notably, the expression of ADIPOQ in granulocytes was relatively low, indicating a certain degree of cell specificity. Additionally, we conducted a comprehensive analysis of the cellular context in which ADIPOQ participated. Moreover, the cell locus analysis revealed that ADIPOQ and its mediated genes, including CPEB4, were associated with a cluster of cell development. In our single-cell analysis, ADIPOQ exhibited expression in nearly all cell types, with the exception of granulocytes. ADIPOQ, an anti-inflammatory adipokine [46], has been associated with the risk factors of GDM, which is characterized by chronic low-grade inflammation [47]. During pregnancy, ADIPOQ levels decrease, and this decrease is further pronounced in individuals with GDM [18]. Given the known involvement of granulocytes in inflammation, it is plausible that their role in the inflammatory process may explain the absence of ADIPOQ expression in these cells.
The regulation of ADIPOQ mRNA expression is a multifaceted process, involving the identification of various transcription factors [48]. Typically, the expression of ADIPOQ is governed through multiple regulatory steps, including transcriptional and post-translational regulation. Initially, ncRNAs, which constitute a significant portion of transcribed DNA, were considered evolutionary debris due to their inability to encode proteins. However, as the functional roles of ncRNAs have been progressively elucidated, it has become evident that these molecules play a crucial role in intricately controlling the underlying molecular mechanisms. The ceRNA network was constructed using the miRNA network involving the participation of ADIPOQ genes. Our analysis in this study revealed that ADIPOQ exerts regulatory control over numerous genes, proteins, and pathways in GDM. Functional enrichment analysis further demonstrated the association of the ADIPOQ gene with response to nutrient levels and fat cell differentiation. It is worth noting that adipose tissue dysfunction is a characteristic feature observed in diabetic patients, as research has indicated a decrease in adipogenesis of preadipocytes in individuals with type 2 diabetes mellitus, ultimately resulting in ectopic fat storage [49]. Adipose differentiation may be regulated by ADIPOQ in GDM.
DNA methylation plays a significant role in the epigenetic regulation of gene expression in eukaryotes, independent of DNA sequence modification [50]. A growing body of evidence suggests that DNA methylation acts as a mediator between environmental stimuli and cellular responses. Furthermore, recent research indicates that DNA methylation is crucial for ADIPOQ transcription, with hypermethylation of the adiponectin promoter inhibiting adiponectin transcription [51, 52]. In our study, we discovered that ADIPOQ exhibits significant interactions with various proteins in both positive and negative regulatory networks, indicating its crucial involvement in gestational diabetes mellitus. Specifically, our methylation analysis revealed a negative correlation between ADIPOQ and the expression of MAPK9, NFκB1, and PRKAG1. Furthermore, the detrimental effects of MAPK9 and NFκB1 on islet function were observed, while hypermethylation of PRKAG1 was found to potentially disrupt key pathways and biological processes essential for pancreatic β-cell physiology [53, 54]. These findings suggest that ADIPOQ may exert a positive influence on GDM through its regulation of MAPK9, NFκB1 and PRKAG1 methylation levels.
This study aimed to comprehensively analyze the role of ADIPOQ in GDM. Initially, the relationship between ADIPOQ-related sites and fetal umbilical artery flow parameters in GDM was examined in the Chinese Han population. Subsequently, a ceRNA network mediated by ADIPOQ was constructed for GDM. Additionally, multi-omics analysis, including transcriptome, epigenome, and single-cell data analysis, was conducted to investigate the regulation of GDM by ADIPOQ. The findings of this study demonstrate that ADIPOQ plays a crucial role in GDM by modulating inflammatory and adipose-metabolism-related pathways, genes, and cellular expression. Moreover, ADIPOQ may serve as a potentially protective gene in the context of GDM. The current study serves as a reference for elucidating the potential mechanisms of ADIPOQ in the context of GDM in future research. Furthermore, it may provide a theoretical framework for the early and adequate management of women at higher risk for GDM, such as diet guidance and lifestyle education for at-risk GDM in early pregnancy.


Responses