Multiomic quantification of the KRAS mutation dosage improves the preoperative prediction of survival and recurrence in patients with pancreatic ductal adenocarcinoma
Introduction
Pancreatic ductal adenocarcinoma (PDAC) is a major global health problem with a dismal prognosis1,2. Despite advances in surgery and chemotherapy over the past few decades, the 5-year survival rate of patients with PDAC is only over 10%3. This is because image-based diagnosis and nontargeted cytotoxic treatment are still mainly used without an understanding of the molecular profile of patients4,5. In breast and lung cancers, for whom survival rates have improved, personalized treatment has already been available depending on the molecular subtype6,7. Therefore, a biological understanding is essential for overcoming this devastating disease.
As part of efforts to increase biological understanding, multiomics profiling has been actively conducted in PDAC with improvements in sequencing technologies and computing power8,9,10,11. However, the vast majority of the results are not applicable to real clinical practice. This is because most multiomics approaches produce complex data and are not cost effective in real-world situations. However, clinical variables are relatively easy to obtain, and their clinical significance can be interpreted through correlations with previous clinical studies. For practical and clinical use of genomics, it is necessary to narrow down the key genes involved in PDAC and combine genomic data with clinical variables.
KRAS encodes a GTPase that acts as a molecular switch for various cellular processes12. Therefore, KRAS mutations are the most common driver mutations in the normal duct epithelium leading to the progression of pancreatic intraepithelial neoplasms13. In particular, KRAS mutations frequently occur at codon 12, and KRAS G12 mutations are reportedly associated with clinical phenotypes14,15. However, the correlation between the KRAS G12 mutation dosage and clinical phenotype remains unclear16. In addition, various mutant dosage ranges have been measured using different sequencing methodologies with varying detection sensitivities, but these have not been compared in relation to clinical outcomes. Therefore, we aimed to investigate the correlation between KRAS G12 mutation dosage from various sequencing datasets and clinical phenotypes in patients with PDAC. In addition, a comparison of the transcriptome data between the high- and low-KRAS-G12-mutant groups revealed gene expression signatures related to cell cycle activation. Finally, we established a clinically feasible prognostic scoring system by integrating the KRAS G12 mutation dosage with clinical information.
Materials and Methods
Patient cohort
This single-center, cohort study was approved by the Institutional Review Board of Seoul National University Hospital (H-1705-031-852) and was conducted in compliance with the 1975 Declaration of Helsinki and its later versions. Among patients who underwent pancreatectomy at Seoul National University Hospital between 2009 and 2016, 196 patients with sufficient tumor tissue for next-generation sequencing were included in this study. All samples used in this study were obtained with written informed consent, but participants did not receive compensation. The samples utilized in this study were provided by the biobank at Seoul National University Hospital (blood samples), which is a part of the Korea Biobank Network (KBN4_A03), and Seoul National University Hospital Cancer Tissue Bank (tissue samples). Patients who underwent pancreatectomy with a grossly positive resection margin (n = 3) were excluded from the analysis.
All surgical procedures were performed by a team specializing in pancreatic surgery, and tumor samples for next-generation sequencing were collected immediately after resection. Surgical specimens were then prepared and assessed by an experienced gastrointestinal pathologist. All patients were diagnosed with PDAC in the final pathology report. Patients were followed up at the outpatient clinic by either a surgeon or medical oncologist. Following the completion of adjuvant therapy, recurrence was evaluated using carbohydrate antigen (CA) 19-9 levels and computed tomography (CT) of the chest, abdomen, and pelvis every 3 months.
Estimating tumor purity
To assess tumor purity, qpure was used17. Samples from the tumor and matched blood were hybridized to an Infinium Global Screening Array (Illumina) and analyzed through GenomeStudio (version 2) to determine log R-ratio and B-allele frequency values. On the basis of these values, qpure was used to estimate tumor purity levels ranging from 0.15 to 1.
Analysis of RNA sequencing (RNA-seq) data
RNA exome capture sequencing was performed to overcome RNA degradation problems. After total RNA was quantified via Quant-IT RiboGreen (Thermo Fisher Scientific, Waltham, MA, USA), the proportion of RNA fragments with greater than 200 nucleotides was calculated per sample using TapeStation RNA screenTape (Agilent, Santa Clara, CA, USA). mRNA encoding the exome was isolated from total RNA via the TruSeq RNA exome (Illumina, San Diego, CA, USA). cDNA libraries were synthesized from the fragmented RNA via adapter ligation, and all the libraries were sequenced via the Illumina HiSeq 2500 platform to generate paired-end 101-base pair reads.
The data processing procedures were divided into three main steps. First, Trimmomatic (version 0.36) was used to trim reads with adapter sequences and low-quality bases18. Second, STAR (version 2.5.3a) was used to map the refined reads to the human reference genome (hg38)19. Third, reads bearing the KRAS G12 wild-type and mutant genotypes were directly extracted from the mapped BAM file. The KRAS G12 mutant dosage was defined as the mutant read count divided by the total read count.
We used aligned reads to measure the transcriptional levels in samples according to GENCODE v27 GTF annotation via RSEM (version 1.3.0) for the analysis20. A count table was used to identify differentially expressed genes (DEGs) in the high- and low-KRAS-mutant dosage groups via R/Bioconductor DESeq2 (version 1.40.1)21. Significantly upregulated DEGs were used to construct the protein–protein interaction (PPI) networks using STRING22. We extracted the interactors of the selected molecules ( > 0.5 STRING score), and the extracted nodes and edges were visualized via Cytoscape (version 3.10.0)23.
Analysis of whole-exome sequencing (WES) data
WES was performed with the SureSelect Human All Exon v5 probe set (Agilent, Santa Clara, CA, USA) according to the Agilent SureSelect Target Enrichment protocol (version B.3, June 2015). Libraries were sequenced with paired-end 101-base pair reads using the Illumina HiSeq 2500 platform. Considering the low tumor purity of PDAC, the sequencing coverage of blood and tumor samples was greater than 100× and 300×, respectively.
The data processing procedures were divided into three main steps. First, BWA (version 0.7.17) was used to map the reads of FASTQ files to hg3824. Second, the mapped BAM files were further preprocessed using the Genome Analysis Tool Kit (version 4.1.9)25. Third, Mutect2 was used for somatic variant calling by pairing the tumor and blood samples for each patient26. The KRAS G12 mutant dosage was defined as a variant allele frequency from the VCF file. VCF files annotated with ANNOVAR (version 2018Apr16) were used to generate a mutation profile27. The resulting ANNOVAR tables were converted to MAF files and visualized via R/Bioconductor maftools28.
Copy number variation (CNV) analysis
For CNV analysis, segmented copy data were obtained from WES data via a CNV kit (version 0.9.6)29. Segmentation data not aligning with the 22 major autosomes or sex chromosomes were excluded. The filtered data were analyzed via GISTIC 2.0 (version 2.0.22) to identify regions and genes with significant copy number changes30. Variants were annotated using SnpEff (version 4.3) into missense and nonsense mutations, in-frame insertions/deletions, and frameshift insertions/deletions31. Exome coverage was defined as the overlapping genomic regions between the capture probe areas and callable regions using the GATK CallableLoic tool32.
Analysis of KRAS-targeted sequencing (TS) data
KRAS amplicons were sequenced with > 1,000,000× depth for the G12 position (hg19, chromosome 12: 25,398,283-25,398,285) using customized primers11. All the libraries were sequenced using the Illumina NovaSeq platform to generate 151-base pair paired-end reads.
The data processing procedures were divided into 3 main steps. First, Trimmomatic (version 0.36) was employed to filter reads with adapters and low-quality bases18. Second, BWA (version 0.7.17) was used to map the filtered reads to the customized KRAS reference24. Third, reads were extracted from mapped BAM files as previously described for RNA-seq. Furthermore, the KRAS G12 mutation dosage was defined as the mutant read count divided by the total read count.
Thresholds for the high- and low-dose groups
The cutoffs for dividing patients into high- and low-KRAS-mutant groups were determined using the log-rank test. For RNA-seq and WES, the most significantly optimal values were employed, whereas two distinct local maxima in the bimodal distribution were utilized for TS (Supplementary Fig. 1).
Clinical data collection
Clinical variables were extracted from the prospectively collected institutional database. Preoperative information included age, sex, American Society of Anesthesiologists physical status classification, tumor location at baseline CT, maximal tumor diameter at baseline CT, and preoperative CA 19-9 level. The maximal tumor diameter ( ≤ 20 vs. > 20 mm) and CA 19-9 level ( ≤ 150 vs. > 150 U/mL) were converted into categorical variables according to the current American Joint Committee on Cancer 8th edition staging system and previous studies evaluating prognostic factors33,34,35. Follow-up data were also collected to evaluate patient prognosis. Overall survival (OS) was measured from the date of pancreatectomy until the patient’s death or the last visit to the hospital. Recurrence-free survival (RFS) was measured from the date of pancreatectomy until the detection of recurrence or death. With respect to the timing of recurrence, a RFS of less than 6 months was considered very early recurrence; a RFS between 6 and 12 months was considered early recurrence; and a RFS of greater than or equal to 12 months was considered late recurrence36,37.
Statistical analysis
Statistical analysis was performed via R software, version 4.2.1 (R Foundation for Statistical Computing). The maxstat package of R was used to determine the ideal cutoff values for the KRAS G12 mutation dosage, which distinguishes OS. To compare clinical variables between the high- and low-mutant dosage groups, the chi-square test and independent t test were used for categorical and continuous variables, respectively. Survival analysis was performed via Kaplan‒Meier curves and the log-rank test. Cox proportional hazards regression models were used to calculate hazard ratios (HRs) and 95% confidence intervals (CIs) of relevant variables. All P values were two-sided, and P < 0.05 was considered statistically significant.
Results
Quantification of the KRAS G12 mutation dosage in matched samples via multiple sequencing methods
This retrospective cohort study included 193 PDAC patients who underwent curative-intent pancreatectomy at Seoul National University Hospital between 2009 and 2016. To thoroughly quantify the dosage via multiple sequencing methods along with comprehensive genomic and transcriptomic profiling, the KRAS G12 mutation dosage was determined using RNA-seq, WES, and TS simultaneously from the same sample (Fig. 1a). In this study, the KRAS mutation dosage represents the variant allele frequency in the WES and TS data, whereas it indicates the number of KRAS mutations in the RNA-seq data. The median mutation dosage was significantly greater for RNA-seq than for WES and TS (P < 0.001) (Fig. 1b).

a Overview of WES, RNA-seq, and TS data generated from 193 patients with PDAC. b Differences in the KRAS mutation dosage according to sequencing method. The P value was calculated via an independent t test. NS not significant; RNA-seq RNA sequencing; WES whole-exome sequencing; TS KRAS-targeted sequencing.
Clinical implications of the KRAS mutation level
The mutational landscape of PDAC determined using WES, RNA-seq, and TS revealed mutation frequencies of significantly mutated genes (SMGs) similar to those reported in previous large-scale PDAC genomic studies10,11,38. Interestingly, visualization of the clinical information along with the landscape revealed a significant association between recurrence and the KRAS mutation level (Fig. 2). Patients who experienced recurrence had higher median mutation dosages (0.144 for TS data, 0.142 for WES data, and 0.283 for RNA-seq data) than patients who did not experience recurrence (0.093 for TS data, 0 for WES data, and 0.079 for RNA-seq data; Fig. 2b-d). These results suggest that the KRAS mutation dosage strongly correlates with clinical phenotypes.

a Mutation profiles of significantly mutated genes (SMGs) in pancreatic cancer. KRAS mutations were determined by combining WES, TS, and RNA-seq data, whereas mutations of six SMGs were extracted from WES data. The samples were sorted according to the KRAS dosage calculated from TS data. Patients exhibiting amplifications in the KRAS gene are highlighted in red. The bottom panel displays the clinical parameters for each patient. b–d Comparison of the KRAS mutation dosage between patients who experienced recurrence and those who did not. Higher mutation rates were observed in patients with recurrence than in patients without recurrence. The P value was calculated using the Wilcoxon signed-rank test. RNA-seq, RNA sequencing; TS KRAS-targeted sequencing; WES whole-exome sequencing; ASA American Society of Anesthesiologists; Adjuvant CTx adjuvant chemotherapy.
To examine the correlation between the KRAS G12 mutation dosage and the mutation frequencies of SMGs, we examined six SMGs, including TP53, CDKN2A, SMAD4, ARID1A, TGFBR2, and RB1, using WES data11. With increasing KRAS mutation dosage, mutations in SMGs tended to be more prevalent (Fig. 2a). Among the 20 patients with KRAS mutation dosages above 0.3, 17 (85%) presented mutations in SMGs. In contrast, of the patients with low mutation dosage less than 0.1, only 60.5% (49/81) had mutations in SMGs. Despite the high chance of SMG mutations in the high-dose group, no obvious statistical association was noted between clinical information and the mutation frequencies of the six SMGs (Supplementary Fig. 2, Supplementary Table 1). Thus, KRAS has particularly significant clinical implications compared with the other SMGs.
We divided patients into high- and low-KRAS-mutant groups and compared their baseline clinical characteristics (Table 1). Groups were defined differently according to sequencing methods; 63 patients (32.6%, dosage <0.163), 67 patients (34.7%, no KRAS G12 mutation), and 138 patients (71.5%, dosage <0.195) were assigned to the low-mutant dosage group according to RNA-seq, WES, and TS data, respectively. Compared with the high-dose group, the low-dose group presented a longer median OS (Fig. 3). In particular, TS data showed the greatest difference in OS between the mutant dosage groups (29.0 months, 95% CI, 15.0–72.0 months in the low-dose group; 15.0 months, 95% CI, 9.0–31.0 months in the high-dose group; P = 0.002; Fig. 3c). Moreover, the mutant dosage calculated from TS data exhibited the most clinical relevance. For example, TS showed a high proportion of patients with larger tumors ( > 20 mm) at baseline CT in the high-dose mutant group (89.1%) than in the low-dose mutant group (73.2%; P = 0.021). With respect to recurrence timing, TS revealed that more patients with a low mutation dosage (44.8%) experienced late recurrence than did those with a high mutation dosage (22.0%; P = 0.007). Notably, half of the patients with high mutation dosages experienced very early recurrence within six months after surgery, and the mutation dosage determined using TS data was also significantly inversely correlated with RFS (Table 2). These results suggest that TS data provided the most clinically relevant mutation dosage compared with RNA-seq and WES data.
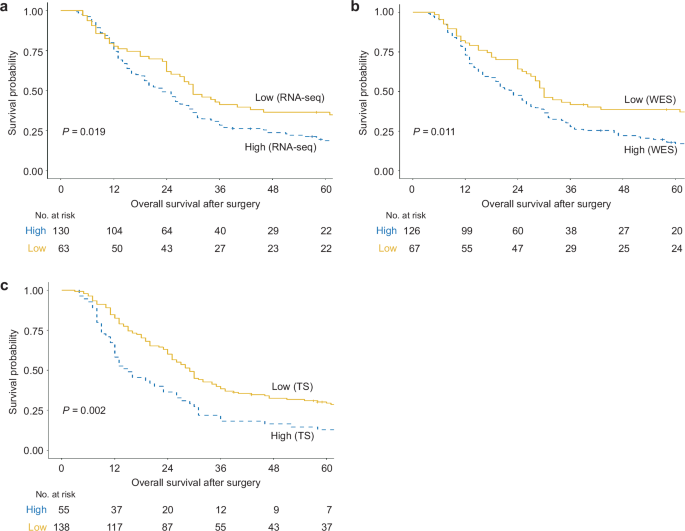
a Using TS data, the low-mutant-dose group (29.0 months, 95% CI, 15.0–72.0 months) had a longer median OS than did the high-mutant-dose group (15.0 months, 95% CI, 9.0–31.0 months). b Using WES data, the median OS was longer in the low-mutant-dose group (30.0 months, 95% CI, 17.0–97.0 months) than in the high-mutant-dose group (23.0 months, 95% CI, 12.0–46.0 months). c RNA-seq data revealed that patients treated with a low mutation dosage (30.0 months, 95% CI, 15.0–99.0 months) presented a longer median OS than did those treated with a high mutation dosage (23.0 months, 95% CI, 12.0–47.0 months). Survival analysis was performed via Kaplan‒Meier curves and the log-rank test. RNA-seq RNA sequencing; WES whole-exome sequencing; TS KRAS-targeted sequencing.
High KRAS mutation dosage accelerate tumor progression
To understand the biological characteristics of the tissues according to the mutation dosage, we compared the transcriptomic data between the high- and low-dose mutant groups determined by TS. Differentially expressed gene (DEG) analysis revealed that 194 and 327 genes were upregulated in the high- and low-dose mutant groups, respectively (Fig. 4a). The upregulated DEGs were able to distinguish the high-dose group from the low-dose group (Fig. 4b). The functional analysis of the DEGs revealed a significant increase in cell division and epidermis development processes within the high-dose mutant group (Fig. 4c). Notably, 16.5% (32/194) of the DEGs were related to cell division. Additionally, DEG network analysis results showed strong genetic interactions between genes involved in the cell cycle and DNA replication (Fig. 4e). The downstream genes related to the RAS pathway, including CCNA2, CDC6, CDC25A, BUB1, and MCM4, were significantly upregulated in the high-dose group (median CCNA2 1.90, CDC6 2.75, CDC25A 0.895, BUB1 2.02, MCM4 5.11 in the high-dose group; median CCNA2 1.19, CDC6 1.61, CDC25A 0.526, BUB1 1.37, MCM4 4.28 in the low-dose group; Fig. 4f). Furthermore, the high-dose group presented high expression levels of UBE2C, which induces the growth of tumors harboring the KRAS G12 mutation39, acting as one of the hubs for the cell cycle module (median 3.75 in the high-dose group; 2.67 in the low-dose group; Fig. 4e-f). On the other hand, the low-dose mutant group presented high expression of genes related to complement activation and axonogenesis, with weak statistical significance (Fig. 4d). These genes are mainly enriched in the immune system and immune cell migration (Supplementary Fig. 3). These results indicate that a high dosage of the KRAS mutant can aggravate clinical outcomes by facilitating tumor growth and progression.
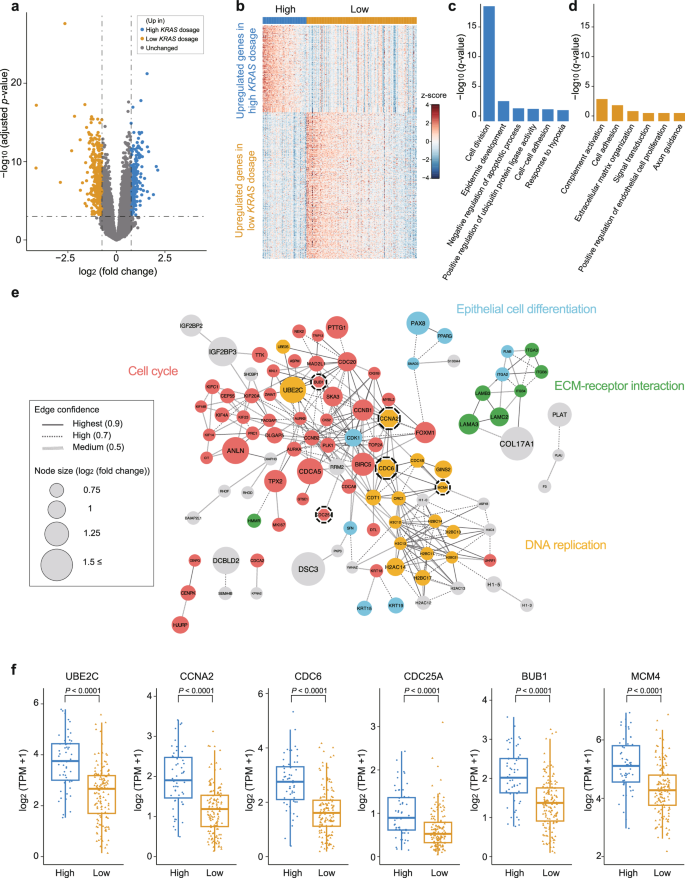
a Volcano plot showing differentially expressed genes (DEGs) between the high-KRAS-dose group and the low-KRAS-dose group. Significant DEGs satisfied the following criteria: -log10 (adjusted p value) <0.05 and an absolute value of log2 (fold change) ≥ 0.75. b Heatmap of 521 significant DEGs between the high- and low-KRAS-dose groups. c–d Gene Ontology (GO) enrichment analysis of DEGs upregulated in the high-KRAS dosage group or low-KRAS dosage group. e Network model describing interactions of DEGs upregulated in the high-KRAS-mutant group. The size of the circles (nodes) and thickness of the lines (edges) are proportional to log2(fold change) and the degree of protein‒protein interaction, respectively. Genes are color-coded according to their biological functions. Nodes with dashed lines are genes involved in the RAS pathway. f Expression levels of UBE2C and RAS pathway genes (CCNA2, CDC6, CDC25A, BUB1, and MCM4) in the high- and low-dose mutant groups. The high-dose mutant group presented higher expression levels of these genes than did the low-dose mutant group. The P value was calculated via Student’s t test. High indicates the high-KRAS-mutant dosage group; low indicates the low-KRAS-mutant dosage group; ECM extracellular matrix; TPM transcripts per million.
Comparison of survival prediction between the KRAS G12 mutation dosage and clinical variables
To expand the utility of the mutation dosage as a prognostic value, we explored candidate variables for use in a prognostic scoring system by performing Cox proportional hazards regression analysis with clinical variables (Supplementary Table 2). Among the statistically significant variables, maximal tumor diameter at baseline CT ≤ 20 mm (HR 0.56; 95% CI 0.38–0.84; P = 0.005 for OS, HR 0.55; 95% CI 0.37–0.82; P = 0.003 for RFS) and CA 19–9 levels ≤ 150 U/mL (HR 0.53; 95% CI 0.38–0.72; P < 0.001 for OS, HR 0.47; 95% CI 0.35–0.65; P < 0.001 for RFS) could be determined before surgery; hence, we selected these variables as candidates for a prognostic scoring system. The preoperative tumor size and CA 19-9 level were similar to those of the KRAS G12 mutation dosage for OS prediction (Fig. 5a-b). These results suggest that prognostic power can be improved by integrating genomic and clinical variables with similar performance in predicting survival.

a‒b OS according to the maximal tumor diameter at baseline CT (HR 0.56; 95% CI 0.38‒0.84; P = 0.005 for OS, HR 0.55; 95% CI 0.37‒0.82; P = 0.003 for RFS) and the preoperative CA 19‒9 level (HR 0.53; 95% CI 0.38‒0.72; P < 0.001 for OS, HR 0.47; 95% CI 0.35‒0.65; P < 0.001 for RFS). c–d OS and RFS according to the prognostic score obtained by integrating the KRAS G12 mutation dosage obtained from KRAS-targeted sequencing with clinical variables. Survival analysis was performed via Kaplan‒Meier curves and the log-rank test. *, P < 0.05; **, P < 0.01; ***, P < 0.001 according to the log-rank test. CA 19-9, carbohydrate.
Scoring system for survival prediction based on KRAS G12 mutation dosage and clinical variables
We established a scoring system by integrating three variables: maximal tumor diameter at baseline CT, CA 19-9 level, and KRAS G12 mutation dosage based on TS data. As per the devised categorical rating system, patients were given 1 point each for maximal tumor diameter at baseline CT > 20 mm, preoperative CA 19-9 levels > 150 U/mL, and KRAS G12 mutation dosage based on TS data > 0.195. All patients received a score ranging from a minimum of 0 to a maximum of 3 and were stratified by the prognostic score. Among the 193 patients, 24 (12.4%), 65 (33.7%), 81 (42.0%), and 23 (11.9%) scored 0, 1, 2, and 3 points, respectively. To evaluate the performance of this prognostic scoring system, we assessed OS and RFS for patients according to the prognostic scores (Fig. 5c,d, Table 3). Superior OS and RFS were observed in patients with 0 points, with gradual worsening noted as the points increased. We also found that the higher the prognostic score was, the significantly greater the HRs for OS and RFS. Patients with 0 points had superior median OS (RFS) of 97.0 (58.0) months and the 1-year, 3-year, and 5-year OS (RFS) rates were 97.0 (58.0) months, 95.8% (87.5%), 70.8% (54.2%), and 66.4% (49.2%), respectively. In contrast, patients with 3 points had a significantly worse median OS (RFS) of only 16.0 (8.0) months and the 1-year, 3-year, and 5-year OS (RFS) rates were 65.2% (17.4%), 8.7% (0.0%), and 8.7% (0.0%), respectively. In addition, for patients with scores of 0 and 1 point, 25.0% (3/12) and 51.0% (26/51) of patients, respectively, experienced very early or early recurrence, whereas 73.9% (68/92) of patients with scores of 2 or 3 points experienced very early or early recurrence (Supplementary Fig. 4).
The prognostic power of data from TS were superior to RNA-seq and WES data in a scoring system when the mutation dosages were integrated with clinical variables. In a scoring system with a single clinical variable, statistically significant differences in OS and RFS were noted between patients with 0 points and those with 1 point (Supplementary Fig. 5a,b). The addition of the mutant dosage obtained from RNA-seq data mitigated differences in OS and RFS between patients with 0 points and those with 1 point according to the clinical variable score, but these differences were maintained when the mutant dosage was obtained using WES or TS data (Supplementary Fig. 5c–f, Fig. 5c, d). Interestingly, with the inclusion of the mutant dosage from TS, all patients with 3 points experienced recurrence within 2 years (Fig. 5d), indicating that the integration of the mutant dosage allowed for the identification of the exceptionally poor prognostic group. In contrast, the mutant dosage obtained from RNA-seq and WES data marginally contributed to differences in OS and RFS between patients with 2 points and those with 3 points in contrast that obtained using TS. Taken together, these findings indicate that the KRAS mutation dosage derived from TS data improved the prognostic power of existing clinical variables.
Discussion
Molecular PDAC subtypes were successfully established through these studies, and their prognostic value was confirmed8,9,10,11. However, these results remain on the bench owing to high data complexity and low cost-effectiveness. In this study, we resolved this issue by exclusively utilizing the KRAS G12 mutation along with preoperative clinical variables to evaluate PDAC prognosis, resulting in a clinically feasible prognostic scoring system.
To determine the threshold value for high and low dosage classification, two optimal values were identified for TS through the log-rank test: 0.139 (log-rank test p value = 0.0019) and 0.195 (log-rank test p value = 0.002) (Supplementary Fig. 1). Both cutoffs yielded reproducible conclusions in genomic analysis and clinical interpretation (Supplementary Figs. 6-9, Supplementary Table 3). A threshold of 0.195 was used for the main figures because it has slightly better predictive power, and supplementary data included all the analysis results using a cutoff of 0.139 (Supplementary Fig. 10, Supplementary Tables 4, 5).
The KRAS G12 mutation has been used as a clinically applicable variable given its high frequency and targetability in PDAC14,15. However, the prognostic power of mutation dosage remains unclear. In our improved prognostic scoring system, the mutation dosage variable could contribute to the prognostic value of clinical variables as a molecular measurement of tumor purity and/or tumor size because the dosage is likely correlated with purity rather than size (Supplementary Fig. 11d). A comparison of the purity of the microarray data between the high- and low-dose mutant groups revealed that the mutation dose was positively correlated with tumor purity (Supplementary Fig. 11). Notably, TS data yielded the greatest difference in purity between the high- and low-dose groups among the sequencing methods, which is consistent with the superior performance of TS for prognosis. Because the mutation dosage obtained using TS data represents the variant allele frequency of the KRAS mutation, it is significantly associated with tumor purity. Another rationale for the relevance of the KRAS mutation dose and tumor purity is that KRASG12mut regulates cell proliferation by activating the RAS signaling pathway. For example, in patients with a high KRAS mutation dosage, there is increased expression of key regulators of DNA replication and the cell cycle, such as CCNA2 and CDC6, inducing rapid cell proliferation. Additionally, UBE2C, a gene required for mutant KRAS-induced lung tumorigenesis and associated with malignant transformation39, was highly upregulated in the high-dose mutant group, further increasing malignant cell growth.
The KRAS mutation dosage has greater clinical relevance than the KRAS mutation copy number and tumor cellularity, which are correlated with dosage. High-level amplifications ( ≥ 2 copies) of KRAS were detected in five (2.6%) patients, whereas no patient exhibited homozygous KRAS deletions (Fig. 2a). Consistent with our data, analyzes of pancreatic adenocarcinoma in The Cancer Genome Atlas (TCGA) and Australian Pancreatic Genome Initiative (APGI) revealed that copy number variations of the KRAS gene were only attributed to amplification, with a low incidence38,40.
When the KRAS mutation dosage was adjusted for CNVs, a marginal change in survival differences between dosage groups by CNV adjustment was observed, leading to the same interpretation of the clinical data (Supplementary Fig. 12). In addition, the KRAS mutation dose demonstrated a stronger clinical association than did tumor cellularity. When survival was compared between the KRAS mutation dosage groups with similar tumor purity levels, patients with a high KRAS mutation dosage experienced shorter RFS than those with a low dosage (Supplementary Fig. 13). These findings indicate that the mutation dosage provides significant prognostic power compared with CNVs and tumor purity.
PDAC is a type of cancer with low tumor purity (median tumor purity determined using microarray data, 0.265). The biologically low tumor purity of PDAC and technically inconsistent variant calling for TS data pose analytical difficulties41,42. To overcome the low sensitivity in detecting mutations in cancers with low tumor purity, TS is an optimal method among available sequencing technologies43,44. The KRAS G12 mutation detection rate was similar across the sequencing technologies in the samples with high tumor purity ( > 50th percentile) (RNA-seq, 78.1%; WES, 79.2%; TS, 83.3%). However, for samples with low tumor purity, TS showed superior detection sensitivity (RNA-seq, 67.0%; WES, 51.5%; TS, 75.3%). These results suggest that TS is a practical and accurate method for quantifying the correlation between mutation dosage and the proportions of malignant cells.
We found that high KRAS G12 mutation dosage from the TS data were strongly associated with high recurrence rates and short time intervals from surgery to recurrence. Given that recurrence, especially within 12 months, is associated with poor prognosis, many clinicians have attempted to prevent recurrence after surgery36. In addition to recommending adjuvant chemotherapy after surgery for all patients, many studies evaluating the effect of neoadjuvant chemotherapy on recurrence have been conducted45,46. According to a recent meta-analysis, neoadjuvant chemotherapy can reduce overall recurrence rates and delay the timing of recurrence in patients with PDAC47. Therefore, predicting the likelihood and timing of recurrence at the time of diagnosis is an important medical issue that can affect the overall treatment strategy. On the basis of the findings of our study, we can predict the occurrence and timing of recurrence and develop an individualized treatment strategy for each patient by performing TS and using existing CT and CA 19-9 level data.
Most KRAS mutations occur at codon 12, and clonal mutations are prevalent. In the pancreatic adenocarcinoma dataset of TCGA consortium, 131 of 140 patients harboring KRAS mutations were clonal (KRASG12mut), whereas others (9/140; 6.4%) had subclonal mutations at codons 12 and 6138. In this study, 7.3% (14/191) of the patients had subclonal mutations (KRASG12mut/Q61mut), whereas the remaining 92.7% (177/191) had clonal mutations (KRASG12mut) (Supplementary Table 6). All patients with subclonal mutations were in the low-KRAS-mutant subgroup. When the KRAS Q61 mutation dosage was considered for the classification of high- and low-dosage groups, four patients with high Q61 VAF values (> 0.195) experienced transitions in group membership, resulting in a more significant survival difference (Supplementary Fig. 14). Therefore, although KRASG12mut is used in this study to represent the mutation dosage, additional subclonal mutations could improve the scoring system.
This study has several limitations. First, the KRAS mutation dosage obtained from RNA-seq was computed exclusively on the basis of read counts, without considering biological factors such as posttranscriptional editing. Although the RNA-seq-based dosage included various confounding factors, its significance originated from the dosage directly preceding translation. Second, our results were exclusively based on samples from patients with PDAC who underwent resection; therefore, selection bias was unavoidable. Third, although consistent sequencing results between preoperative biopsy samples and surgical samples have been reported, verification of biopsy samples with TS will be needed for a prognostic scoring system that is completely based on preoperative variables. Finally, validation of the prognostic scoring system for an independent cohort is needed prior to clinical use. Therefore, follow-up studies should be conducted with endoscopic ultrasound biopsy samples from patients with unresectable PDAC to ensure a more versatile application.
In conclusion, our research indicates that the KRAS G12 mutation dosage obtained from the TS data is a reliable prognostic factor for PDAC, with comparable predictive power to that of other clinical variables. Additionally, high KRAS mutation rates were associated with the overexpression of genes related to the cell cycle. Furthermore, we established a prognostic scoring system that can predict survival outcomes and is highly feasible because it integrates preoperative clinical variables and the KRAS mutation dosage from the TS.
Availability of data and materials
The RNA and whole-exome sequencing data used in this study are available from dbGaP (https://www.ncbi.nlm.nih.gov/gap/; accession ID: phs002347.v1.p1).
Responses