Myeloid neoplasms with PHF6 mutations: context-dependent genomic and prognostic characterization in 176 informative cases
Introduction
Plant homeodomain finger protein 6 (PHF6) gene located at the 26.2 locus of the long arm of chromosome X, encodes for a chromatin-binding protein, which contains four nuclear localization signals, and two distinct zinc finger domains known as plant homeodomain (PHD) 1, and 2 [1, 2]. The protein is postulated to regulate gene expression through chromatin modification, functioning as a tumor suppressor and impacting hematopoietic lineage differentiation [1]. PHF6 is abundantly expressed in the central nervous and hematopoietic systems [1,2,3,4] and was first described in 2002 by Lower et al. as the gene responsible for the Börjeson‐Forssman‐Lehmann syndrome (BFLS). The latter is an X-linked neurodevelopmental disorder [3] characterized by short stature, mental retardation, epilepsy, distinctive facial features, hypogonadism, and obesity [2]. Somatic PHF6 mutations have since been described in various hematological malignancies, particularly in T-cell acute lymphoblastic leukemia (16% and 38% incidence in pediatric-age and adult patients, respectively) [1, 3].
A spectrum of myeloid neoplasms, including acute myeloid leukemia (AML), myelodysplastic syndromes (MDS), chronic myeloid leukemia (CML), myeloproliferative neoplasms (MPN), chronic myelomonocytic leukemia (CMML), and MDS/MPN have all been associated with PHF6 mutations with incidence figures ranging between 0.7 to 5% [5,6,7,8]. Bataller et al. studied 1699 patients with myeloid neoplasms including 56 with PHF6MUT and found no prognostic associations [6]. By contrast, Kubota et al. studied 8443 patients with myeloid neoplasms, including 147 with PHF6MUT, and reported shortened survival in the latter versus those without the mutation (28% vs. 42% at 3 years; p < 0.01), especially when PHF6MUT and RUNX1MUT were concurrently mutated [9]. The study also suggested that PHF6MUT was a second hit phenomenon occurring at the time of disease progression and clonal evolution [9]. In another study of 801 AML patients, including 22 with PHF6MUT, Huang et al. identified PHF6MUT as a predictor of poor outcome associated with poor chemosensitivity resulting in a lower complete remission (CR) rate (41% vs. 69%; p = 0.04) and shorter overall survival (OS; 6.0 vs. 39.0 months; p < 0.01) [10].
In a recent study [7], we identified PHF6MUT in CMML to be associated with (i) superior OS and blast transformation-free survival (BTFS), (ii) thrombocytopenia, and (iii) isolated loss of Y chromosome (LoY) [7]. In the current study, we have extended the scope of our investigation by including additional informative cases with other myeloid neoplasms.
Methods
The current study was conducted under an institutional review board approved minimum risk protocol that authorized retrospective extraction and analysis of data from records of patients seen across all Mayo Clinic campuses including Rochester, Minnesota; Jacksonville, Florida; and Scottsdale, Arizona sites (USA). Mutations were detected on peripheral blood or bone marrow samples by multi-gene next-generation sequencing (NGS) performed on clinical indications as per institutional protocol. Specific diagnoses were assigned in accordance with the International Consensus Classification (ICC) of myeloid neoplasms [11]. Patient demographics, co-mutations, and follow-up information were extracted from electronic medical records. Receiver operating characteristic (ROC) plots were used to identify significant cutoff levels for continuous variables. Conventional statistical methods including the Kaplan-Meier method for survival outcomes and univariate/multivariable Cox proportional hazards regression were employed to identify associations between variables and outcomes. Calculations of OS and BTFS were censored for allogeneic hematopoietic stem cell transplantation (AHSCT). All analyses were performed on JMP Pro 17.0.0 software (SAS Institute, Cary, NC, USA).
Results
Overall comparative analysis
A Mayo Clinic enterprise-wide database search using the terms PHF6MUT and morphologically annotated myeloid neoplasms identified a total of 196 patients; 20 patients were excluded because of re-assignment of mutations as variants of unknown significance (VUS; n = 12), diagnosis other than myeloid neoplasm (n = 6), or mutation detection at time of post-chemotherapy remission for AML. Specific diagnoses in the remainder 176 patients with PHF6MUT included AML (n = 67, 38%), CMML (n = 49, 28%), MDS (n = 36, 20%), MPN (n = 16, 9%) and MDS/MPN (n = 8, 5%).
The clinical characteristics, laboratory parameters, and cytogenetic and mutation data are comprehensively outlined in Tables 1 and 2, stratified by the aforementioned morphologic subtype designations. The median age at the time of PHF6MUT detection for the entire study group was 73 years (range: 22–92) with younger age distribution in patients with AML and MDS/MPN (Table 1). Several types of PHF6 mutations were identified and classified as nonsense (n = 61, 43%), frameshift (n = 43,30%), missense (n = 18,13%) and those affecting splice sites (n = 16, 11%). Most mutations affected the PHD2 region (n = 92, 64%) followed by PHD1 region (n = 37, 26%). The median PHF6 variant allele fraction (VAF) was 30%. The PHF6MUT VAF, types and locations were similar across the disease subgroups (Table 2).
Isolated LoY was observed only in patients with CMML (16%) or MDS (8%) while complex/monosomal karyotype (MK/CK) or chromosome 7 abnormalities were most frequent in AML (22%). Ninety six percent of the patients had at least one concurrent mutation in other myeloid genes (n = 169; Table 2). The median number of co-mutations was 3 (range 0–7); patients with AML (42%), MPN (35%), MDS/MPN (31%) were more likely to have >3 co-mutations, compared to CMML (24%) or MDS (17%; P = 0.04). The most frequent co-mutations and those with significant diagnostic or prognostic relevance are shown in Table 2; TET2 mutation was the most prevalent concurrent mutation (47%) followed by ASXL1 (39%) and RUNX1 (28%).
Figure 1 illustrates transplant-censored OS from time of PHF6MUT detection, stratified by morphologic subtypes (median follow-up 25 months). OS was significantly longer in CMML (median 81 months; 3/5-year survival 70%/63%) compared to all other myeloid neoplasms including AML (median 15 months; 3/5-year survival 27%/5%, HR 5.0, 95% CI 2.7–9.4), MDS (median 26 months; 3/5-year survival 35%/0%, HR 3.4, 95% CI 1.7–6.8), MDS/MPN (median 10 months; 3/5-year survival 47%/0%, HR 4.4, 95% CI 1.6–612.1), and MPN (median 17 months; 3/5-year survival 14%/14%, HR, 3.6, 95% CI 1.6–8.4). The same was true for BTFS with corresponding BT rates of 10% in CMML, 17% in MDS, 38% in MDS/MPN, and 25% in MPN (p < 0.01; Fig. 2). Accordingly, CMML was excluded from subsequent univariate and multivariable analysis for OS and BTFS.

Kaplan–Meier curve illustrates the overall survival censored at transplant of patients stratified by myeloid neoplasm subtype at the time of PHF6 mutation detection. Patients with chronic myelomonocytic leukemia had a significantly superior survival in comparison to other myeloid neoplasms.
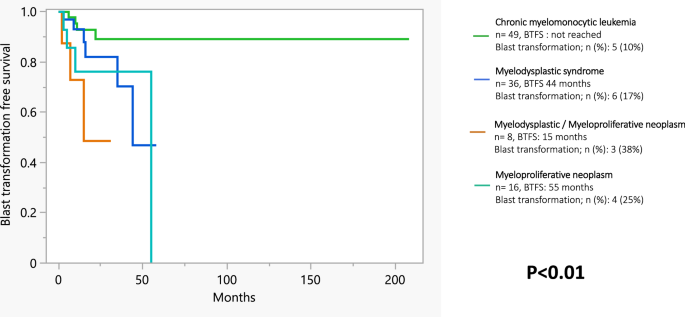
Kaplan–Meier curve illustrates the blast transformation free survival censored at transplant of patients stratified by myeloid neoplasm subtype at the time of PHF6 mutation detection. Patients with chronic myelomonocytic leukemia had a significantly superior BTFS in comparison to other myeloid neoplasms.
PHF6MUT VAF as a continuous variable was found to have a significant unfavorable impact on OS and ROC analysis identified an optimal cut off VAF of >20%. Univariate analysis excluding patients with CMML identified hemoglobin <10 g/dl, CK/MK/chromosome 7 abnormalities, DNMT3AMUT, U2AF1MUT, and PHF6MUT VAF > 20% as predictors of OS with corresponding HR (95% CI, p-value) of 1.8 (1.1–2.9, 0.03), 2.6 (1.4–4.8, <0.01), 1.9 (1.0–3.6, 0.04), 1.9 (1.1–3.4, 0.02) and 2.1 (1.2–3.6, <0.01) (Table 3). In multivariable analysis, karyotype, PHF6MUT VAF > 20%, and U2AF1MUT sustained their significance with corresponding HR (95% CI, p-value) of 2.5 (1.3–4.8, <0.01), 1.8 (1.1–3.1, 0.02) and 1.9 (1.1–3.5, 0.02). Another multivariable analysis excluding AML patients, identified circulating blast >2% (HR 5.9, p = 0.01) as the most significant predictor of BTFS (Table 3).
PHF6
MUT in chronic myelomonocytic leukemia
Twenty eight percent of the study cohort comprised patients with PHF6MUT CMML (n = 49). In comparison to other PHF6MUT myeloid neoplasms, taken as a comparator group, patients with CMML were more likely to have isolated LoY (16% vs. 2%, p < 0.01), a higher hemoglobin level (median 12 vs. 9 g/dL, p < 0.01), concurrent TET2MUT (84% vs. 32%, P < 0.01), and were less likely to have MK/CK (0% vs. 9%, p < 0.01) or concurrent DNMT3 MUT (6% vs. 18%, p = 0.03). According to the CMML-specific prognostic scoring system molecular (CPSS Mol) risk-model [12], patients were classified into low (n = 6, 15%), intermediate-1 (n = 11, 27.5%), intermediate-2 (n = 19, 47.5%), and high (n = 4, 10%) risk groups (Supplementary Table 1).
At a median follow up of 25 months for patients with CMML, 25 (51%) deaths, 10 (20%) AHSCTs and 7 (14%) BTs were documented; among the latter, two patients developed AML post AHSCT and were censored for survival analyses. In univariate analysis; hemoglobin <10 g/dl, CK/MK/chromosome 7 abnormalities, DNMT3AMUT, NRASMUT, age ≥80 years, and ASXL1MUT were predictive of OS with corresponding HR (95% CI, p-value) of 5.6 (1.8–16.8, <0.01), 5.9 (1.3–27.5, 0.02), 5.1 (1.1–24.8, 0.04), 0.09 (0.01–0.7, 0.02),2.5 (1.0–6.0, 0.04) and 2.5 (1.1–5.8, 0.03) respectively. In multivariable analysis, only hemoglobin <10 g/dl, CK/MK/chromosome 7 abnormalities and DNMT3AMUT retained their significance with corresponding HR (95% CI, p-value) of 9.8 (2.4–39.9, <0.01), 14.9 (2.3–94.8, <0.01) and 13.8 (2.1–91.8, <0.01). BTFS was independently predicted by CK/MK/chromosome 7 abnormalities (median not reached vs. 8 months, p < 0.01) and ASXL1MUT (p < 0.01) (Table 3).
PHF6
MUT in acute myeloid leukemia
Five patients with PHF6MUT mixed phenotypic/undifferentiated acute leukemia were included among the sixty-seven patients with PHF6-mutated AML. In comparison to other PHF6MUT myeloid neoplasms, patients with PHF6MUT AML were more likely to have concurrent RUNX1MUT (39% vs. 21%, p = 0.01), CK/MK/chromosome 7 abnormalities (22% vs. 7%, p < 0.01), and concurrent IDH2 MUT (21% vs. 3%, p < 0.01) or DNMT3AMUT (26% vs. 8%, p < 0.01). Based on the European Leukemia Net (ELN) 2022 risk stratification [13], the AML patients with PHF6MUT were categorized into favorable (n = 3, 9%), intermediate (n = 7, 20%), or adverse (n = 25, 71%) risk groups (Supplementary Table 1); the prevalence of recurrent AML mutations were 12%, 7% and 6% respectively, for FLT3MUT, CEBPAMUT, and NPM1MUT (Table 2). In univariate analysis, risk factors for OS in patients with PHF6-mutated AML included CK/MK/chromosome 7 abnormalities (HR 2.1; p = 0.05) and U2AF1MUT (HR 2.8; p = 0.04). In multivariable analysis, ELN adverse risk stratification was the only significant risk factor (HR 5.6, p < 0.01).
PHF6
MUT in myelodysplastic syndrome
Compared to their counterparts with other myeloid neoplasms, PHF6-mutated patients with MDS were more likely to display concurrent U2AF1MUT (28% vs. 11%, p = 0.01) and PHF6MUT at PHD1 region (39% vs. 21%, p = 0.01), and less likely to co-express TET2 MUT (22% vs. 53%, p < 0.01). ICC designated MDS classifications [11] were MDS, NOS with single lineage dysplasia (n = 3, 8%), MDS, NOS with multilineage dysplasia (n = 19, 53%), MDS with mutated SF3B1(n = 1, 3%), MDS with excess blasts (MDS-EB) (n = 5, 14%), and MDS/AML(n = 8, 22%). Based on the revised International Prognostic Scoring System (IPSS-R) [14], patients were categorized into low (n = 9, 28%), intermediate (n = 11, 34%), high (n = 7, 22%) or very high (n = 5,16%) risk groups. In multivariable analysis, CK/MK/chromosome 7 abnormalities, PHF6MUT VAF > 20% (Fig. 3a) and hemoglobin <10 g/dL were associated with inferior OS with corresponding HR (95% CI, p-value) of 5.1 (1.2–20.9, 0.02), 3.0 (1.1–8.1, 0.02) and 2.7 (1.0–7.2, 0.04), while female gender was associated with inferior BTFS with HR 26.8, 95% CI 1.9–368.3 (p = 0.01; Supplementary Fig. 1).
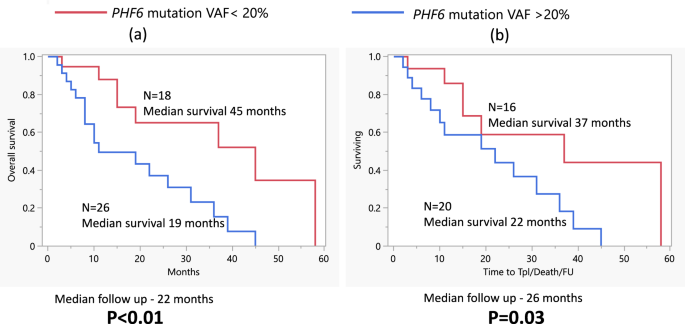
Kaplan-Meier curves illustrate inferior OS in patients with MDS or MDS/MPN in patients with PHF6 mutation VAF more than 20% at diagnosis.
PHF6
MUT in myeloproliferative neoplasms
Among the 16 patients with PHF6MUT MPNs, specific diagnosis was myelofibrosis (MF; 62% secondary MF) in 13 and essential thrombocythemia (ET) in 3; driver mutation distribution included JAK2 in 68%, CALR 12%, and MPL 12%. MPN patients with PHF6MUT were more likely to display concurrent ASXL1MUT (63% vs. 36%, p = 0.04) and less likely to have a MK/CK/chromosome 7 abnormalities (0% vs. 14%, p = 0.03) or a PHF6MUT VAF > 20% (37% vs 64%, p = 0.04). Among the 3 patients with ET, all were older with a median age of 79 years, none had a prior history of thrombosis, 2 had a JAK2MUT, and 1 had MPLMUT as the driver mutation. Interestingly, all 3 had concurrent ASXL1MUT while 2 had a at least one known high-risk mutations [15] including IDH2MUT and TP53MUT. Dynamic International Prognostic Scoring System (DIPSS) plus [16] categorized the patients with MF into intermediate-1 (n = 2, 15%), intermediate-2 (n = 6, 46%), and high (n = 5, 38%) risk groups. The median OS in patients with ET was 16 months like those with secondary MF (OS 17 months) and primary MF (OS 25 months, p = 0.3). No predictors of OS or BTFS could be identified due to small number of patients.
PHF6
MUT in myelodysplastic/myeloproliferative neoplasms
Only eight patients were diagnosed with MDS/MPN, of these six were diagnosed with MDS/MPN, NOS and 2 with MDS/MPN with thrombocytosis and SF3B1 mutation. In comparison to patients with other myeloid neoplasms they were more likely to have SF3B1MUT (25% vs.3%, P = 0.02), and JAK2MUT (62% vs 11%, p < 0.01). The small number of informative cases did not allow statistically credible survival analysis but their inclusion with patients with MDS enhanced the prognostic impact of PHF6MUT VAF > 20% (Fig. 3b).
Sequential PHF6 mutational analysis
A repeat subsequent NGS was available in 50 patients, at a median interval of 14.5 months between the first and second NGS examination (range 1-200 months); on the second NGS testing, PHF6MUT no longer detected in 22 (44%) patients and persisted in 28 (56%). In the former, 5 had received symptom directed therapy, 4 intensive chemotherapy, 5 low-intensity chemotherapy, 7 AHSCT, and one no treatment (Supplementary Table 2). Among the 28 patients with persistence of the mutation on repeat testing, PHF6MUT VAF remained unchanged in 50% (n = 14), increased in 32% (n = 9, median increase 36%, range 6–60%) and decreased in 20% (n = 5, median decrease of 9% range 1–96%).
Post-transplant survival
A total of 44 patients underwent AHSCT including 23 with AML, 10 with CMML, 6 with MDS, 2 with MDS/MPN, and 3 with MPN; median post-transplant survival considering all 44 patients was 46 months with 3/5-year survival rate of 55%/42%. Post-transplant survival was not affected by PHF6 VAF (p = 0.7) or morphologic subcategory (p = 0.35) with medians at 60 months for AML, 46 months for CMML, “not reached” for either MDS or MPN, and 6.5 months for MDS/MPN. Post-transplant survival was favorably affected by ASXL1 mutation (N = 11; median not reached vs. 38 months in patients with wild-type ASXL1 (n = 33); HR 0.13, 95% CI 0.02–1.0; p = 0.05).
Discussion
Several observational studies have explored the clinical and prognostic correlations of PHF6MUT in myeloid malignancies, with inconsistent observations [6,7,8,9,10, 17, 18]. Similarly, laboratory studies on PHF6MUT have yielded conflicting results; knockdown mouse models have demonstrated both a tumor suppressor and an oncogenic effect of the mutation in hematological neoplasms [19,20,21]; suggesting a complex cell lineage and co-mutational context dependent action of the mutation [7, 20]. Kubota et al. conducted a comprehensive proteomic analysis of PHF6 protein and reported a significant functional interaction with RUNX1 [9]. Both co-localize to active enhancer regions and influence lineage differentiation of hematopoietic cells [9]. Another study demonstrated reduced recruitment of methyltransferase SUV39H1 to the nucleolar region in cancer cells with PHF6MUT that led to increased DNA transcription and proliferation. This mechanism was shown to be a potential therapeutic target to overcome cytarabine resistance [22]. However exact function and interaction with concurrent mutations remains unknown.
In the current study, the majority of the patients were males (76%), which is consistent with the described male predilection in PHF6-mutated neoplasms [1, 8, 9]. The observed differences in the laboratory parameters among the different disease groups were largely as expected from the underlying disease morphology; a notable exception was the higher hemoglobin levels seen in patients with CMML, similar to that reported in our recent publication [7]. Most patients had a normal karyotype; of interest, a higher-than-expected frequency of LoY occurred in the setting of CMML (16% vs. expected 6% [23]) and MDS (8% vs expected 2.5% [24]).
The PHD2 domain was the most frequently affected region across all myeloid neoplasms, consistent with previous reports [5, 7]. Nonsense and frameshift mutations were most the common mutation types. The site or type of mutation did not influence prognosis in our patient cohort. Majority of the patients (96%) had at least one concurrent mutation in other myeloid genes, with 55% harboring 3 or more concurrent mutations, making it challenging in ascertaining mutation-specific prognostic impact. The co-mutation pattern was similar to previous reports with TET2 [6, 7], ASXL1 [6, 7, 9], RUNX1 [6, 7, 9], SRSF2 [7], U2AF1 [6, 7, 9], and DNMT3A [6, 7] mutations being frequent.
Other notable observations from the current study include a significantly superior OS and BTFS in patients with PHF6-mutated CMML vs. in those with other myeloid neoplasms harboring PHF6MUT. In patients with PHF6-mutated CMML, the CPSS-Mol risk categorization failed to predict prognosis, mandating the consideration of the PHF6 mutation in CMML risk scoring systems [7]. We have recently elaborated on the prognostic interaction of PHF6MUT with other mutations [7], as also shown in the current study where univariate analysis showed a favorable impact of concurrent NRASMUT, contrary to the adverse risk attributed with it, in previous studies [12, 25, 26].
In the current study, most patients with PHF6MUT AML were stratified into the ELN adverse risk category (71%), with an observed median survival of 13 months vs. expected at 9 months [27]. In ELN intermediate-risk group, the observed OS was 44 months vs. expected at 16 months [27]. The frequency of RUNX1MUT co-mutation was higher in the setting of AML [9], as previously described but, unlike the latter, the current study did not show a significant impact on prognosis. On the other hand, the favorable impact of NPM1 mutations in AML was also recognized in the current study, in the setting of PHF6MUT.
Another novel finding in the current study was the significant associations between PHF6MUT VAF > 20% and inferior OS and female gender and inferior BTFS, in patients with MDS. The IPSS-R risk model performed as expected in our MDS patients with PHF6MUT, for the risk categories of very low, intermediate, high, and very high; OS in PHF6MUT MDS vs. expected OS, in months, were not reached vs. 90 in very low-risk [28], 36 vs. 34 intermediate [28], 19 vs. 21 high [28], and 10 vs.13 very high-risk groups [28]. However, in patients categorized as having low-risk MDS, the observed median OS of 19 months was substantially shorter than the expected estimate at 54 months [28]. The apparent discrepancy might be partly attributed to the higher frequency of SRSF2MUT in our cohort of PHF6-mutated low-risk MDS (40% vs.4%) [29, 30]. Also, the inferior BTFS noted in female patients with MDS, could potentially be related to increased prevalence of DNMT3A,MUT which is known for its adverse prognostic impact [31].
Finally, we were encouraged by the favorable post-transplant outcome of our patients with PHF6-mutated myeloid neoplasms, irrespective of morphologic subcategory or PHF6 VAF. Additional key observations from the current study, including the favorable prognostic impact in CMML which can help guide transplant decisions in these patients [7], the unique association with isolated LoY in the setting of CMML and MDS, the association between PHF6 VAF > 20% and inferior survival in MDS all require additional studies for confirmation.
Responses