Nanomaterial enhanced photoelectrocatalysis and photocatalysis for chemical oxygen demand sensing a comprehensive review

Introduction
The management of organic load in industrial effluents plays a crucial role in environmental remediation1,2,3. Indeed, as mandated by the International Organization for Standardization (ISO) and the US Environmental Protection Agency, chemical oxygen demand (COD) concentrations in effluents must be lower than 150 mg L−1 before discharge into water bodies4. However, certain sectors, including the petroleum, carwash, agrochemical, and pharmaceutical industries, often produce effluents with COD concentrations ranging from 3000 to 6000 mg L−13,5,6,7,8,9,10,11. Given these high concentrations, it is imperative to control and monitor the total organic load in effluents to mitigate environmental pollution. This practice helps prevent negative impacts on aquatic ecosystems related to the accumulation of organic pollutants, such as species migration due to oxygen depletion, increased acidity, eutrophication, and the accumulation of endocrine – disrupting chemicals12.
Conventional COD quantification methods are based on the oxidation of organic matter (OM) using strong oxidizing agents in an acidic medium, as permanganates (({E}_{{{Mn}}^{7+}/{{Mn}}^{2+}}^{0}=1.51{rm{V}})) or dichromates (({E}_{{{Cr}}^{6+}/{{Cr}}^{3+}}^{0}=1.36{rm{V}})) in sulfuric acid2,13, and employ either volumetric or spectrophotometric techniques. However, they have several limitations, including i) the long analysis time required (2–5 h, which is often extended by systematic errors introduced by analyst interference); ii) errors related to the matrix effect; and iii) limited oxidizing capacity from costly (e.g., Ag2SO4), detection limits for each one of the apparatuses, and corrosive (e.g., H2SO4) reagents. Further, these reagents release toxic ions such as Hg2+, Ag+, and Ce4+ from electron scavengers, whose uncontrolled waste generates cross- and secondary contamination. Consequently, these methods are counterproductive, with low economic feasibility and viability2,13,14,15,16,17. Mainly, these issues contradict Sustainable Development Goals (SDGs) 6 and 14 and the green chemistry principles.
In contrast, COD sensors based on electrochemical18 and/or electrochemical advanced oxidation processes (EAOPs), particularly photoelectrocatalytic (PEC) systems, offer a promising and sustainable alternative for precise and accurate organic detection in automated, short-duration analyses (1–5 min)16,19,20,21,22,23,24,25,26. PEC-COD sensors have gained popularity in recent years owing to their high mineralization efficiencies achieved through the photoelectrogeneration of hydroxyl radicals (({{{bullet }atop}}{rm{OH}})) from water, which are among the strongest green oxidants in nature with a half-life of about nanoseconds. The PEC principle behind these sensors involves developing and validating structurally functional nanomaterials that can absorb a broad-spectrum of visible light, enhancing their viability in line with SDG 712,27,28,29,30,31,32,33,34,35,36,37,38. In practice, the working electrodes for PEC-COD sensors have been developed primarily using TiO239,40,41,42,43,44,45,46,47, with variations in its morphology and structure achieved through alternative synthesis methods, doping with metals48,49,50,51, or forming heterostructures with binary and ternary oxides29,52,53, or other binary semiconductors such as nitrogen carbides54 and cadmium sulfide55.
Then, this investigation in the existing literature provides a comprehensive review of research on PEC-COD sensors. It examines the nanomaterials used as working electrodes thus far and analyzes their photocatalytic (PC) performance, focusing on how morphological and structural manipulations through various synthesis and doping strategies affect their efficiency. It also explores the analytical principles of signal generation, as well as the optimization of the operational variables for both PC-COD and PEC-COD sensors. Lastly, it proposes a set of promising PC nanomaterials for future development in PEC-COD sensor research which have wide applicability as innovative environmental tools, and the materials science promotes the development of new energy advanced resources.
Nanomaterials employed in PEC-COD sensors
A key focus in EAOPs is optimizing the PC performance of semiconductors through controlled morphological and structural construction, achieved via nanomaterial synthesis and its modifications12,56,57,58. Research is thus centered on fabricating and validating novel materials with effective oxidation capabilities, stability, and low cost, ensuring reproducible and scalable results59.
PC activity
PC and PEC processes primarily depend on the efficiency of photogenerated charge transfer and the degree of separation of the electron-hole recombination. Specifically, the kinetics of photoinduced charge transfer ((k)) from the valence band to the conduction band must be much higher than the kinetics of the electron-hole pair recombination, (({k}_{{(e}_{{VB}}^{-}to {h}_{{CB}}^{+})}gg ,{k}_{{(e}_{{CB}}^{-}to {h}_{{VB}}^{+})})) 23,33,57,60,61,62,63,64,65,66. Several strategies can optimize this behavior in quantum confinement, including efficient “charge extraction“ by an external electric field in PC processes (PEC method) and modifying charge transfer mechanisms through material doping30,57,61,62,63,64,67. At the macro level, this translates to the precise manipulation and control of nanomaterial synthesis methodologies, considering the type and nature of the conductive substrate and the conditions of precursor preparation, deposition, and calcination, as summarized in Table 1.
TiO2 in PEC-COD sensors
Over 80% of PEC-COD sensors employ TiO2 semiconductors as working electrodes. These materials to COD sensors were primarily developed by Li et al.15, Wang et al.53, and Zhang et al.68. These research groups have utilized TiO2 in both anatase and rutile phases, as well as their mixtures. The preference for TiO2 stems from these phases’ beneficial PC characteristics, which have established it as a benchmark in EAOPs. The effectiveness of TiO2 is attributed to several key factors, including the morphology (Fig. 1), energy edge depth on the valence band, oxygen vacancy defects, and the arrangement of tetragonal structure holes on the surface. These features significantly enhance oxidation processes by promoting the high mobility of photoinduced charge carriers and are currently being actively studied28,69.

a Top and (b) cross-sectional views of TNTs (reprinted from Zhang et al.74). c Cross-sectional view of amorphous spheres of TiO2/boron-doped diamond (reprinted with permission from Han et al.43 copyright 2011 Royal Society of Chemistry). d Top and cross-sectional (inset) views of TNTs (reprinted from Liang et al.51). e Top view of TiO2 nanofibers with their respective interactions inserted (adapted from Mu et al.39). f Top view of TiO2 nanopores (reprinted from Zhang et al.68). g Top view of TiO2 nanorods (TNRs), h hydrogenated-TNRs, and i anatase-branch@hydrogenated-TiO2-rutile nanorod (reprinted from Zu et al.28).
Rutile and anatase phases of TiO2 have tetragonal structures with octahedral geometry, where each titanium atom coordinates with six oxygen atoms per unit cell within the crystal lattice (Fig. 2a); however, their properties slightly differ in terms of octahedral distortion56,69,70. These phases are thermodynamically modifiable through variations in calcination treatments, such as temperature range and ramp. For instance, single-crystalline TiO2-anatase nanofunctionals can be achieved at average temperatures of 400 °C28,42, while rutile-phase TiO2 is formed at about 700 °C40,53,69.

a Unit cells of anatase and rutile crystal structures (crystallographic parameters extracted from Materials database76). b Photocurrent density profile (Insert: Nyquist plots). c Tauc plots for various surface modifications of rutile-TiO2 nanorods (RTNRs) (adapted from Zu et al.28). d Photocurrent responses and e cyclic voltammetry of reduced effect for TiO2 nanopores (TNPs) (adapted from Zhang et al.68).
Similarly, controlling the material’s morphology and homogeneity can enhance conductivity, photoinduced electronic transitions, and particle size by increasing the contact surface area. Studies have used various strategies to develop single-dimensional TiO2 (1D-TiO2) nanostructures, as nanorods and nanotubes; among these, TiO2 nanotubes (TNTs) are the most frequently used as working electrodes for PEC-COD sensors40,68,71. For instance, highly ordered TNTs were arranged (see Fig. 1a, b, and d) using electrochemical anodization in fluoride and citrate electrolytes under different experimental conditions (Table 1)72. In another example, 1D-TiO2 amorphous spheres were obtained via hydrolysis of a titanium alkoxide precursor using the sol-gel method, followed by deposition on a conductive substrate like boron-doped diamond (BDD) (see Fig. 1c and Table 1)43. TNTs have also been generated through the electrochemical anodization of titanium metal. The use of citrate, diol, or fluoride electrolytes at a pH of 4.0 has been found to significantly contribute to the growth of ordered, long- and small-diameter nanotubes, which can be further controlled by adjusting the applied potential and anodization time, as shown in Table 137,49,54,55,73.
Dimensional optimization of TNTs is exemplified by comparing the work of Zhang et al.74, and Liang et al.51. The former applied 20 V for 5 min, producing nanotubes with an inner diameter of 100 nm and a length of 350 nm (Fig. 1a and b). A decade later, the latter applied 60 V for 10 min, achieving vertically ordered nanotubes with an inner diameter of 65 nm and a length of 3 µm under the same calcination conditions (Fig. 1d).
TiO2 nanorods (TNRs) are typically prepared using hydrothermal synthesis, a widely adopted method for achieving their crystalline structure28,42,53,75 (Table 1). Both hydrothermal and solvothermal methods promote nanorod formation by facilitating the diffusion of titanium cations to the oxide surface, where their d-orbitals coordinate with n-electrons photoinduced from heteroatoms originating from either amine or carboxylic groups17,40. Zu et al.28 synthetized rutile-TNRs (RTNRs) using the hydrothermal method, followed by a hydrogenated process (H-RTNRs) and further modified the surface to create an anatase-branched/hydrogenated rutile-TiO2 nanorod photoelectrode (AB@H-RTNR). Figure 1g–i shows the morphological changes for each modification carried out by Zu et al.28: the hydrogenation and phase coupling affected charge distribution channels, increasing the photocurrent density at least threefold from RTNR to AB@H-RTNR and decreasing the energetic depth of the valence band density states during each modification step (Fig. 2b). Indeed, the valence band potential (({E}_{{VB}})) decreased from 1.69 eV for RTNR to 0.69 eV to AB@H-RTNR, and consequently lowering the band gap potential (({E}_{{BG}})) from 3.20 eV to 2.46 eV (Fig. 2c), thereby improving photoinduced electron transfer.
The PEC performance of TNT-based working electrodes has also been improved by surface hydrogenation28,41,42. This process generates oxygen vacancies in the crystal lattice by introducing hydrogen, which acts as surface charge density donors, thereby improving the electrical conductivity of TNTs. Consequently, less energetic wavelengths are required for the PC processes to occur28,41,42. Similarly, Mu et al.39 synthesized TiO2 nanofibers (TNFs) under hydrothermal conditions in an alkaline medium (see Fig. 1e), known as “template-free“ synthesis. Ion exchange and titanium oxidation lead to the formation of anatase TNFs. Unlike the other nanostructures shown in Fig. 1, the long TNFs provide a larger contact area, resulting in higher PC efficiency, as evidenced by the molecular interaction scheme for OM on TiO2 nanoparticles and TNFs in Fig. 1e.
TiO2 nanopores (TNPs) with a uniform structure, as shown in Fig. 1, represent another innovative morphological approach68. These nanopores are produced through the electrochemical reduction of TNPs. This method enhances capacitance and increases delta photocurrent density by approximately 20 mA cm−2 compared to photocurrents generated from non-reduced TNPs produced via electrochemical anodization (Fig. 2f).
Doped-TNTs and other nanomaterials in PEC-COD sensors
Nanomaterial doping is another strategy for improving the PEC performance of semiconductors. This approach produces composites that promote charge distribution by increasing their density of states (DOS) at specific energetic band-edge positions65. Most of the dopings applied as working electrodes for PEC-COD-sensors involve modified TNTs with metals, metal oxides, and ternary oxides48,50,51,57. For instance, TNTs modified with conductive nanomaterials such as gold, platinum, and tellurium (AuNPs, PtNPs, and TeNPs, respectively) form a dielectric barrier known as a “Schottky contact”. This barrier acts as an “electron trap,“ extending the photoinduced charged channels and facilitating more complex charge carrier transfer mechanisms (CTMs) between AuNPs, PtNPs, TeNPs with TNTs. The morphological modification of the TNTs can be seen under these conditions can be observed in Fig. 3a and is detailed in Table 137,48,51,77.

Top views of TiO2 nanotubes (TNTs) before modification with inserts of: a AuNPs/TNTs/Ti (adapted from Si et al.50), b Cu2O/TNTs/Ti (adapted from C. Wang et al.52), c α-Bi2Mo3O12/TNTs/Ti (adapted from Pang et al.29) and d mBiVO4/FTO (cross-sectional inset; adapted from Alves et al.78).
One previous study52 developed a PEC-COD sensor by electrodepositing Cu2O (({{E}_{{BG}}}_{C{u}_{2}O}=2.0{eV})) on TNTs, as shown in Fig. 3b, resulting in the Cu2O/TNT/Ti composite. The octahedral Cu2O coating on the TNTs improves the PEC properties, as indicated in Fig. 4a and b. This modification increases photocurrent density by 60% and stabilizes the electrode over time at a constant value of approximately 0.25 mA under light-ON conditions (Fig. 4a) while decreasing the charge transfer resistance (RCT) of delta by ~700 Ω (see diagram in Fig. 4b). Accordingly, the Cu2O/TNT/Ti photoanode has more efficient electron-hole pair separation compared to TNTs alone, allowing simultaneous processes (Eqs. 1 – 6) to occur under visible light (Fig. 4b)52.

a Photocurrent profiles and b ultraviolet–visible absorption spectrum of TNTs/Ti and loaded-Cu2O TNTs/Ti with a Nyquist plot (inset; adapted from Wang et al.52). c Nyquist plot (Insert: zoomed plot, reprinted from Pang et al.29) and d geometric disposition of α-Bi2Mo3O12/TNTs/Ti (crystallographic parameters extracted from Pang et al.29). e Crystal structure (crystallographic parameters extracted from Crystallography Open database), f band structure, and density of states for BiVO4 (Ding et al.82). g Linear sweep voltammetry profile and h acid stability curves from cyclic voltammetry for TiO2/BDD and TiO2/ITO (adapted from Han et al.43). i Hypochlorite anion concentration based on advanced oxidation process treatments using BDD and dimensionally stable anodes (DSA) (reprinted from Sánchez-Montes et al.83).
Moreover, the applicability of PEC-COD sensors using nanomaterials extends to bismuth-based ternary oxides such as molybdates29 and vanadates78, which show good PC behavior under visible light, high stability, and non-toxicity. Bismuth molybdates, with the formula Bi2O3.nMoO, differ in terms of the composition of their α, β, or γ phases (if “n” is 3, 2, or 1, respectively), depending on the proportions of Bi and Mo79. For instance, high Mo concentrations at acidic pH produce scheelite nanostructures of the α-Bi2Mo3O12 phase, characterized by molybdates with tetrahedral geometry (see Fig. 4d). In contrast, high Bi concentrations and alkaline pH yield fluorite and Aurivillius structures of the β- and γ-Bi2Mo3O12 phases80,81. During synthesis, particle size, structure, and morphological homogeneity can be strategically controlled using surfactants like polyvinylpyrrolidone and cetyltrimethylammonium bromide, which enhance the PC activity of alpha bismuth molybdate. It is also possible to create one-dimensional structures like nanorods, nanotubes, or nanobelts and two-dimensional structures like nanosheets or nanoplates via hydrothermal, solvothermal, or glycothermal methods at low temperatures. For these nanomaterials, higher calcination temperatures between 450 and 550 °C result in lower ({E}_{{BG}}) 79,80.
For instance, the PEC-COD sensor developed by Pang et al.29 improved the properties of the TNTs/Ti via α-Bi2Mo3O12 immersion deposition, resulting in the working electrode α-Bi2Mo3O12/TNTs/Ti (see Table 1 for more specific parameters). This modification improved the photoinduced charge separation, reducing the RCT from over 1000 Ω for TNTs/Ti under light to ~100 Ω for α-Bi2Mo3O12/TNTs/Ti under light (Fig. 4c). This improvement is attributed to the decrease in ({E}_{{BG}}) from 3.43 eV to 3.23 eV from the modification, with the ({E}_{{VB}}) becoming less positive, shifting from 3.09 eV to 2.41 eV29. This shift is due to the ({E}_{{VB}}) being formed by the 4 d and 6p orbitals of Mo and Bi, respectively, and the CB by the O 2p orbital29,80.
In another study78, the n-type semiconductor BiVO4, with 2.4 eV of ({E}_{{BG}}) in its monoclinic scheelite nanostructure and a ({E}_{{VB}}) of 2.86 eV, was applied to fluorine-doped tin oxide (FTO). BiVO4 is notable for its broad-spectrum PEC oxidative ability under visible light, exhibiting high charge transfer separation efficiencies, which facilitates its use as a working electrode for photochemiresistors70,78. The high photoinduced charge carrier separation efficiency of mBiVO4 is also due to the spatial arrangement on the nanomaterials’ crystal surfaces. Additionally, Ding et al.82 theoretically showed that the water adsorption and photoelectrooxidation mechanisms for mBiVO4 are promoted on the crystalline surfaces {100} and {110}.
The mBiVO4 structure consists of dodecahedral BiO8 units surrounded by tetrahedral VO4 units, connected by a shared vertex oxygen (see Fig. 4e). The band structure and DOS are illustrated in Fig. 4f, which shows the theoretical energetic edge positions of mBiVO4 boundary bands. These positions correlate with the corresponding chemical bonds, where the oxygen 2p orbital is the primary charge donor in the VB, overlapping the total DOS. Additionally, the distribution of orbitals with the electronic band structures reveals V-O and Bi-O bonding mechanisms located in the 6 s, 2p, and 3 d orbitals for Bi, O, and V, respectively82.
In the context of COD detection using nanomaterials, the choice of conductive substrates also plays an important role in sensor stability and reproducibility. BDDs have demonstrated numerous advantages over other conductive materials such as iridium tin oxide (ITO), FTO, and metals such as Ti. These advantages include a wide electrochemical working potential window, high mechanical strength, corrosion resistance, and stability. The performance of BDDs depends on factors including the amount of impurities in the doping process, particularly the amount of boron and the presence of Csp2 in the crystalline structure. These characteristics can be examined using Raman spectroscopy, where the characteristic absorption intensity of BDDs is approximately 1333 cm−144,85,86,87,88,89.
For instance, Han et al.43 demonstrated the superior charge separation efficiency of BDD over ITO through a comparative photocurrent and potential curve analysis between TiO2/BDD and TiO2/ITO. They obtained the Iph – E curve (Fig. 4g), which showed a more positive slope in the rising zone for BDD, indicating BDD requires less energy than ITO to separate photoinduced electrons. This results in a more efficient extraction of photogenerated electrons from TiO2, as well as high stability of the TiO2/BDD combination, as shown in Fig. 4h43,84. Furthermore, Sánchez-Montes et al.83 compared the production of active chloride species (ACSs) under UV-C light between BDD and dimensionally stable anodes (DSAs). Figure 4i shows that BDD produces fewer ACSs compared to DSAs because of BDD’s larger overpotential window83,88,89.
PC-COD and PEC-COD sensors
The applicability of PC-COD and PEC-COD sensors is contingent upon their stability and reproducibility. To be considered valid and comparable to conventional methods such as spectrophotometry, these sensors must have relative standard deviation percentages (%RSD) of less than 5%. Achieving this necessitates the consideration of the PC properties of nanomaterials, the operational variables in sensors, and the production of active species.
For PC-COD-sensors, spontaneous (left(triangle G < 0right)) PC oxidation processes occur only if the photogenerated ({E}_{{VB}}) or its hole potential (({{rm{h}}}_{{VB}}^{+})) is more positive than the standard oxidation potential of the species of interest. In the case of water, a ({{rm{h}}}_{{VB}}^{+}) more energetic than +2.40 eV is required to produce hydroxyl radicals, which are considered effective and sustainable oxidants given their highly non-selective and exhaustive reactivity.
Regarding PEC activity in PEC-COD sensors, the PC condition is not essential for achieving the desired outcome. Through electrochemical charge polarization, the band alignments within the depletion region can be sufficiently bent to facilitate the redox process; in other words, while the position of the catalyst’s potential in the band energy diagram does not limit the method, it serves as a valid criterion for minimizing energy consumption, particularly when using solar energy as the primary source.
Further, fine-tuning the operating variables enables accurate and reliable results across a broad sensing range. For instance, variations in system temperature from light sources or electron-hole recombination can lead to fluctuations in current densities due to semiconductor overload, potentially compromising method reproducibility. Therefore, maintaining stable room temperature conditions is advisable.
The presence of ACSs such as ({rm{HClO}},,{{rm{Cl}}}^{cdot },{rm{and}}; {rm{Cl}}{{rm{O}}}^{cdot }) 74,88 and active sulfate species (ASSs) such as (S{O}_{4}^{2-},{S}{O}_{4}^{-cdot } {y} {S}_{2}{O}_{8}^{2-}) 12,86,92 affect sensors’ detection performance. ACSs can be produced through C-type ultraviolet radiation induced homolysis of HClO and subsequent oxidation via ({{rm{HO}}}^{cdot }) and ({{rm{Cl}}}^{cdot }) (Eqs. 7 and 8)74. On the other hand, ASSs are produced via direct and indirect electrooxidation of sulfuric acid or sodium sulfate (Eqs. 9–12)86,92. In fact, Zhang et al.74 demonstrated that when Cl− and NH4+ ion concentrations exceed 500 mg L−1, the results are not reproducible, whereas concentrations below this level allow for feasible and reproducible quantification.
It is important to note that sensor limits and ranges of detection are influenced by the extent of water contamination16. Additionally, the reproducibility and repeatability of sensor measurements are also affected by the presence or absence of macromolecules such as suspended solids; thus, it is recommended that wastewater be filtered prior to COD measurements27.
PC-COD sensors
Analytical principle
PC-COD sensors operate on the principle of photocatalysis, which has been extensively studied16,19,20,21. Research has demonstrated that the mineralization of organic pollutants and their quantitative determination via photocatalysis relies on the coupling of the anatase TiO2 semiconductor (({{E}_{{BG}}}_{({Ti}{O}_{2})}=,3.2{rm{eV}})) with oxidizing agents such as K2Cr2O719, Ce(SO4)221, and KMnO416. These agents act as electron scavengers, capturing photoinduced electrons from the CB (({{rm{e}}}_{{rm{CB}}}^{-})) and simultaneously reducing to Cr3+, Ce3+, and Mn2+, respectively (Eqs. 13–15)69. This synergistic interaction produces an analytical signal that correlates with the absorbance and COD, thereby minimizing electron-hole recombination kinetics19,21,69.
Cesium sulfate acts as an effective electron scavenger with a stronger oxidizing capacity compared to permanganate and dichromate, following the trend ({E}_{C{e}^{4+}/C{e}^{3+}}^{0} > ,{E}_{M{n}^{7+}/M{n}^{2+}}^{0} > ,{E}_{C{r}^{6+}/C{r}^{3+}}^{0}), (cf. Eqs. 13–15). When coupled with TiO2, Ce(SO4)2 demonstrates superior detection performance in PC-COD sensors compared to TiO2-KMnO4 or TiO2-K2Cr2O7 couplings. Specifically, TiO2-Ce(SO4)2 coupling is up to five times more effective in oxidizing OM during the initial minutes compared to individual TiO2 or Ce(SO4)2 under the same conditions21. This coupling improves testing times and expands the electron scavenger’s applicability21. Additionally, Zhu et al.16 proposed the surface fluorination of TiO2 ((equiv {rm{Ti}}-{rm{F}})), which improves oxidation rates by promoting strong interactions between hydroxyls and fluorides, thereby increasing hydroxyl radical production (Eqs. 16 and 17).
Operational variables that affect PC-COD sensors
The selection of an appropriate pH range is crucial and depends on the point of zero charge (PZC) of photocatalysts and the standard oxidation-reduction potential (({E}_{{REDOX}}^{0})) of the oxidizing agent (electron scavenger). When PZC < pH, the surface of the material becomes electropositively charged, promoting PC oxidation. Research has demonstrated that a pH ≤ 2 increases PC oxidation capacity16,19,20,21. For instance, the absorbance and pH correlation for K2Cr2O7 shows an increasing trend in the range of 0.5 ≤ pH ≤ 1.5, with a notable concavity change observed beyond this range, attributed to the distribution of ({rm{C}}{{rm{r}}}_{2}{{rm{O}}}_{7}^{2-}) and ({rm{HCr}}{{rm{O}}}_{4}^{-}) 19. In another study20, a pH of 5.6 was selected for the ({left({{rm{MnO}}}_{4}right)}^{2-}) anion, aligning with the PZC values of ZnO and TiO2 (6.0 and 5.8, respectively); the study found that at a pH < 5, ZnO does not act as an amphoteric oxide, promoting homogeneous catalysis reactions dominated by KMnO4. Further, Zhu et al.19 examined the PZC of TiO2 and the degree of fluorination, determining that at pH < 3, fluoride anion concentration decreases owing to the weak acidity of fluoric acid, consequently reducing the fluorination degree of titanium ((equiv {rm{Ti}}-{rm{F}})). Additionally, pH values above 3 decrease the concentration of permanganate16,20.
Control over the photocatalyst and electron scavenger dose optimizes oxidation processes and PC quantification; an excessive quantity of nanoparticles in suspension may introduce interferences during ultraviolet–visible spectrum generation, attributed to the Tyndall effect. For example, Ai et al.19 demonstrated a directly proportional correlation between absorbance and TiO2 dose up to an inflection point of 0.04 mg L−1, after which the curve became pseudo-constant or asymptotic. This critical concentration of 0.04 mg L−1 has been identified as optimal, and higher concentrations have been shown to decrease detection effectiveness due to an excess of suspended nanoparticles16,19,20,21.
The dosage of permanganate also influences the limits and ranges of detection according to the degree of water pollution16,20. For instance, Zhu et al.16 observed that increasing permanganate concentrations from 1 to 10 mmol L−1 altered detection limits from 0.02 to 20 mg L−1, respectively, achieving average efficiencies of 99% in both cases. Similarly, the amount of KMnO4 reduced also depends on UV exposure time, which diminishes after the initial 10 min20. Regarding TiO2 fluorination, Zhu et al.16 achieved maximum absorption when fluoride concentration reached 5 mmol L−1, with negligible chloride interference at concentrations below 1000 mg L−1.
PEC-COD sensors
The pioneers in PEC-COD sensors are the research groups led by Zhang and Zhao in 200444,91,93. Currently, PEC oxidation processes are well-established in this field given their high efficiencies and substantial impact, combining electrochemical assistance with photocatalysis. Recent advancements in PEC-COD sensors are depicted in Fig. 5a–f, showcasing various distinguishing characteristics. These sensors aim to convert electrochemical variables into OM quantities, providing real-time COD values that are applicable across diverse practical scenarios.

a UV-LED portable thin-layer sensor (reprinted from Zhang et al.94). b Portable setup (reprinted from Zhang, Li, and Zhao72). c Microfluidic device (reprinted from Mu et al.39). d Electrochemical transistor (adapted from Liao et al.77. e Extended-gate field-effect transistor sensor (reprinted from Si et al.37). f prototype of a real cell for real-time determination by PEC-COD-sensor, which includes: 1. UV lamp, 2. electrode compartment, 3. flow inlet, 4. flow outlet (reprinted from Si et al.50).
Analytical principle
COD quantification through PEC processes is based on the combustion of OM, where the 1:1 stoichiometric relationship between OM ({({rm{C}}}_{{rm{y}}}{H}_{m}{O}_{j}{N}_{k}{X}_{q})) and consumed oxygen (left(4y-2j+m-3k-qright)) transfers electrons, as described in (Eq. 18). As illustrated in Fig. 6a2, these photoinduced electrons can be extracted and detected using electrochemical methods such as voltammetry, impedance, or chronoamperometry; the photocurrent signal is mathematically correlated to the amount of mineralized OM by Faraday’s law, expressed in terms of oxygen (Eqs. 19 and 20)44,91.
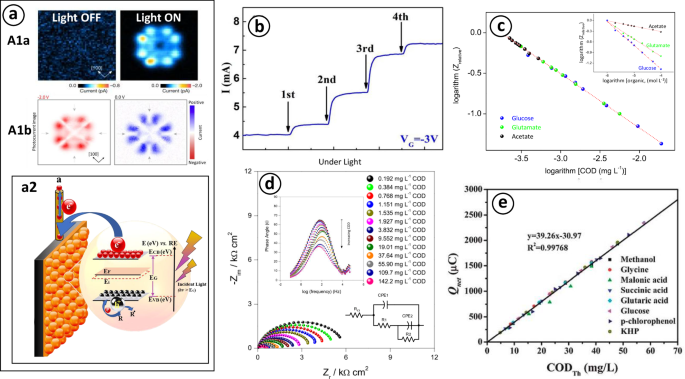
a1 Images of photoinduced molecular excitation effect (reproduced from Imai-Imada et al.65 and a2 Schematic diagram of photocurrent generation. b Photocurrent response using the amperometry method with COD addition (reprinted from Si et al.37). c calibration curve from photochemiresistor sensor (Insert: analytical curves with different organic analytes, adapted from Alves et al.78). d Nyquist plot with inset of Bode diagram with different COD aliquots (adapted from Alves et al.78). e validation curve between conventional and PEC-COD sensor (adapted from Han et al.43).
Based on these analyses, Alves et al.78 developed a photochemiresistor sensor using impedance spectroscopy. This technique allowed them to correlate changes in the capacitive and resistive behavior of the material, specifically the resistance to organic charge transport at the mBiVO4/FTO solution interface, under both light and dark conditions. Nyquist and Bode plots revealed a decrease in resistance and phase angle, respectively, with increasing COD concentrations, which was described using electrical equivalent circuit (EEC) (Fig. 6d). They further established a mathematical correlation (Eq. 21) between the relative impedance ({Z}_{{Relative}}) and the logarithm of COD concentrations (Fig. 6b, c). This correlation normalized the impedance response with light (({Z}_{m})) and without OM (({Z}_{o})), at a frequency of 0.1 Hz, covering organic doses between 4 and 20 mg L−1. This approach aimed to improve sensitivity and response time during the validation stage (Table 2).
Similarly, other studies37,50,77 have developed online PEC detectors based on the extended-gate field-effect transistor sensor (see Fig. 5d–f). These studies correlated the channel potential of the transient (left({{rm{V}}}_{{rm{G}}-{rm{chanel}}}right)), gate electrode (left({{rm{V}}}_{{rm{G}}}right)), and molal organic concentration, as described in (Eq. 22), to determine the charge quantity Q in the transient channel. Here, C is the material capacitance, k is Boltzmann’s constant, T is temperature, n is the number of electrons transferred, and A and α are compilations of constants37,50. Zhang et al.94 further improved the feasibility of PEC-COD sensors by integrating them with computer software, allowing analysts to control all process variables (Fig. 5b). This setup enabled the generation of amperograms, as shown in Fig. 6b, demonstrating the linear behavior of the Iph-COD (Fig. 6c and e).
Influence of operational variables on PEC-COD sensors
Bias potential is inversely proportional to the electron-hole recombination rate. According to the theoretical principles, necessary energy supply enables the detection of photogenerated electrons. Applying a suitably positive charge bias potential thus theoretically allows the quantification of (left(4y-2j+m-3k-qright){e}^{-}) in the oxidation of one mole of ({{rm{C}}}_{{rm{y}}}{H}_{m}{O}_{j}{N}_{k}{X}_{q}), as described in (Eq. 18)72. A sufficiently positive potential is defined as a value or range of applied potentials in which a set of processes occur (Fig. 6d). In the case of PEC-COD sensors, it is crucial to consider the potential characteristic of hydroxyl radical evolution, which varies depending to the intrinsic and extrinsic properties of the material used. For instance, the applied oxidation potential for water on a BDD substrate is higher than that on Pt. The trend of the I-E curve is directly proportional51. However, based on the behavior of the points in Fig. 7a, the following should be considered:
-
i.
When working in an increasing potential range within −0.4 < E (V vs. Ag/AgCl) < 0.2, collecting photogenerated electrons in the oxidation process is the determining step.
-
ii.
When the I-E curve behavior is approximately constant between 0.4 < E (V vs. Ag/AgCl) < 0.8, interfacial oxidation is the determining step. This step controls the rate of the PEC oxidation process, suggesting that all photogenerated electrons are extracted, detected, and quantified.
-
iii.
High potentials can generate surface interferences because of possible photocorrosion or gas evolution46,91.

a Analyte concentration (Glucose). Adapted from Zhang et al.72, b pH. Adapted from ref. Zhang et al.44, c sample flow rate from ref. Zhang et al.45, d light intensity for different glucose concentrations. Adapted from Zhang et el.72 f light intensity from ref.44, e Impedance under light. Reprinted from Alves et al.78.
The acid resistance of PEC-COD sensors is key for monitoring wastewater with acidic matrices. Changes in acidity at the working electrode can modify the flat band potential and the band-edge, impacting the reproducibility of the sensor. At specific acidic pHs, substrates such as ITO and Ti exhibit low acid resistance owing to their chemical nature, limiting their application and reliability. In contrast, BDD has excellent acid resistance, as shown in the comparative curves in Fig. 7b, c43.
According to the Fig. 7c, when pH < 2, conductive substrates such as ITO and FTO lose conductivity; at 2 < pH < 4, the current and pH correlation increases, indicating that the electrode is not yet stable, and results are not reproducible in this pH range. Indeed, the organic charge obtained in this range is lower than theoretically calculated. However, when pH > 10, the ({Q}_{{blank}}) increases and the ({Q}_{{net}}) decreases because of the photoelectrooxidation of water, which is facilitated at alkaline pH84. Thus, when 4 < pH < 10, the charges are approximately constant and equal to the theoretical value44,72.
During the calibration stage, the organic load concentration influences the sensitivity of PEC-COD sensors. Zhang et al.45 used a flow system for quantification and calibration with their COD sensor, finding that the correlation between organic load and concentration at different flow rates was linear during the degradation of the organic analyte, such as glucose. At lower flow rates, the slope of the correlation was higher, indicating the method becomes less sensitive as the mass transfer rates to the interface increase. Conversely, higher injection volumes of the analyte improved the detection limit and sensitivity, although this reduced the detection range (Fig. 7c and d)45.
The photocurrent is the result of charge transfer due to photoinduced electron movement over time40. This phenomenon was examined by Imai-Imada et al.65, who used a scanning tunneling microscope to observe atomic-level charge distribution and photocurrent channels between orbital lobes and nodes in light and dark conditions (Fig. 6a1a, inset graph). The dependence of charge flow and the charge’s spatial distribution on the polarization potential is also observed (Fig. 6a1b, inset graph). Under darkness, the current density tends to zero or remains negligible compared to the photocurrent under UV light (Fig. 7e). This increase in current, known as the photocurrent or net charge (left({Q}_{{net}}right)), is mathematically represented as the area under the total current curve (({Q}_{{total}})) minus the blank (left({Q}_{{blank}}right)) (Eqs. 19–20). Here, ({Q}_{{Blank}}) is the result of water oxidation, while ({Q}_{{total}}) includes the charge contribution from both PEC-COD light and OM oxidation. Therefore, ({Q}_{{total}}) has a direct relationship with OM concentration and light intensity, influenced by the altered kinetics of negative carrier transfer during the process of organic photoelectrooxidation91.
As illustrated in Fig. 7d, Zhang et al.44 determined that an increase in light intensity proportionally increases both ({Q}_{{total}}) and ({Q}_{{blank}}) while simultaneously increasing the linear detection range and maintaining a constant ({Q}_{{net}}) interval. This indicates that light intensity does not interfere with OM analyte detection and helps reduce assay times. However, if the linear range increases with higher light intensities, reproducibility can decrease because of possible interference from gas photogeneration or photocorrosion, which can affect electrode stability. Consequently, light intensity is a key experimental variable (see Table 2); the optimal intensity is determined by the inflection point of the analyte concentration and photocurrent curve at different light intensities. For example, Zhang, Li, Zhao94 recommended using an intensity of 9 mW cm−2 for TiO2, as they found lower light intensities are preferable to maintain a constant linear range between ({Q}_{{net}}) and ({Q}_{{blank}}) 44,91.
As previously mentioned, Alves et al.78 investigated the variation in resistance and capacitance of a photoelectrochemiresistive device under visible light during COD quantification, using an EEC (Fig. 6e) with material adsorption. They found that both visible light and the organic charge adsorption added to the photoelectrochemiresistive system decreased the Nyquist semicircle radius in a linear manner; this indicates that light and analytes reduce charge recombination rates, resulting in longer electron-hole separation times and a lower RCT at the vanadate-solution interface78,95.
Furthermore, the resistance of both charge trapping (R1) and charge transfer (R2) depends on the amount of OM; as COD increases, R2 decreases78,95, while capacitance is directly proportional to COD and conductivity, which is determined by the phase angle decrease in the Bode plots78. Under dark conditions, the semicircles overlap almost completely, signifying that their time constants are approximately equal. The EEC modeling in this scenario consists of two parallel resistance/capacitance (R/CPE) circuits, where R1 and CPE1 represent the RCT and double-layer capacitance, respectively, while CPE2/R2 is attributed to the porosity of BiVO4 over FTO (({R}_{1}{CP}{E}_{1}/{R}_{2}{CP}{E}_{2},approx ,1)) 78,95. At 63 Hz, the phase angle is constant for all COD concentrations, indicating no significant relationship between RCT and COD, implying that RCT is limited by BiVO4 active sites in absence of light78.
Conclusions and future perspectives
The development of PC-COD sensors and PEC-COD sensors involves facing and overcoming several challenges, including portability, low cost, easy automation, sensitivity, rapid detection, on-site detection, and fast response time. These challenges encompass analytical, instrumental, environmental, and economic aspects. For PEC-COD sensors, overcoming these challenges primarily depends on the optical, mechanical, and electrical properties of the electrode used.
This review examined that, the morphological and structural control of nanomaterials, through different synthetic pathways and modifications, influences the efficiency of PC activity in PC-COD and PEC-COD sensors. Fabricating mono- and heterostructured nanomaterials has demonstrated the ability to enhance the signal of quantification, stability, conductivity, and reproducibility, as well as optimize particle size, contact area, oxygen vacancy generation, surface hydrogenation, and doping levels. These improvements help overcome the limitations of charge separation mechanisms. The performance of PEC-COD sensors—including sensitivity, detection limits, reproducibility, stability, accuracy, and precision—depends on the material used in the working electrode, as well as on operating variables such as applied polarization current or potential, reactor type, light intensity and pH, which significantly influence the sensor’s effectiveness and reproducibility.
Over 80% of nanomaterials that have been utilized in PC-COD and PEC-COD sensors to date are based on titanium dioxide. Below, we detail a series of semiconductors that have demonstrated excellent experimental and theoretical performance in PEC oxidations. These materials have shown advancements in the design and engineering of crystallinity and heterojunction, making them suitable for COD sensors with catalytic activity under visible light, thereby guiding future research development. The recommended PC materials contrast with several characteristics and properties emphasized in this review, include:
-
Bi-based nanomaterials, such as oxyhalides (left({BiOX;X}=F,{Cl},{Br},{I}right)), molybdates (e.g., (B{i}_{2}M{{oO}}_{6})), wolframite (e.g., (B{i}_{2}W{O}_{6})), and vanadates (e.g., ({BiV}{O}_{4})), are potentially used in PEC systems, where in overall their stable structural arrangement, low toxicity, and narrow band gap make them ideal for the separation and transport of photogenerated charges, even in heterostructured systems they improve the stability and final conductivity of the electrodes.
-
Metal-organic frameworks (MOFs)—Structurally bulky and porous, they are typically metals coordinated or sub-coordinated with heteroatoms from organic ligands. Becomes interesting for these applications due to their high surface area, which allows for the efficient detection and quantification of organic compounds. Further, their structural versatility enables, for instance, the metal incorporations or the hybrid formations with semiconductors, enhancing their PC activity, stability, and conductivity.
-
Piezoelectric, pyroelectric, and single-phase magnetic materials, such as mixed magnetic oxides like cobalt ferrite doped with binary titanium or niobium oxide, as well as those based on perovskites. These materials possess mechanical, thermal, electrical, and magnetic properties that are highly advantageous, enhancing the performance of PEC processes and sensors. The synergy of these characteristics would optimize the charge distribution, detection time, reproducibility, and stability of the system.
It is important to consider that the continuous attempts to miniaturize various processes at the nanoscale level have led to nanoscience being regarded as one of the most important areas of scientific study nowadays. These processes include the development of materials and devices such as optoelectronics, sensing, driven molecules, and catalysts. In order to use nanomaterials as selective and effective homogeneous and heterogeneous (photo)catalysts, scientists, including chemists and engineers, have been working closely together thanks to the advancements in nanoscience. This has led to a meteoric rise in the popularity of catalysis involving COD sensors over the past few years.
This review draws the reader in by combining fundamental theoretical concepts with plenty of relevant examples. The area of sensors by photocatalysts with nanoparticles is currently growing, and it is expected that important obstacles will soon be overcome, leading to nanoparticle catalysis finding many more uses. Therefore, this review will be great impact in academic and industrial fields in the chemical sciences.


Responses