Nanoscale in silico and in vitro modeling of lipid bilayers for curvature induction and sensing

Introduction
The cellular membrane, a complex and dynamic structure mainly composed of lipids, proteins, and carbohydrates, serves as a crucial interface between intracellular and extracellular environments in prokaryotic and eukaryotic cells. The lipids composing cellular membranes are generally grouped into three categories: phospholipids, glycolipids, and sterols. Phospholipids are the major components of cells, greatly influencing their physio-chemical properties. The mammalian cell often contains phosphatidylcholine (PC), phosphatidylethanolamine, phosphatidylinositol, phosphatidylserine (PS), and phosphatidylglycerol1. Membrane proteins are often defined with respect to their location or binding mode; hence, they can be integral, peripheral, or lipid-anchored2. Carbohydrates are often localized on the outer surface of membranes and bound to lipids or proteins forming glycolipids or glycoproteins respectively.
Besides being a physical barrier for the cell, cellular membranes are important in cell signaling1, apoptosis, transcriptional and post-translational regulation3, membrane trafficking and cytoskeletal dynamics4, and energy homeostasis5, to name a few. To perform these key functions, membranes often must undergo reshaping events involving a change in protein compositions. Biochemical changes can affect membrane geometry/curvature and a change in membrane geometry can in turn regulate reaction rates6. Thus, membrane curvature is crucial for cellular processes such as endocytosis, exocytosis, and filopodia formation7,8. Furthermore, understanding and predicting the impact of membrane curvature on cell processes can be essential for a controlled and efficient design of novel liposome-based drug delivery vehicles, which are some of the most successful delivery methods9,10. Positive (concave down) and negative (concave up) membrane curvatures can be induced by the insertion of N-terminal amphipathic helices11,12 or by intrinsically curved proteins and oligomers13,14.
Among curvature-inducing proteins, Bin/Amphiphysin/Rvs (BAR) domain containing ones are central. The BAR domain is a ~200–280 amino-acids long helical bundle which forms dimers of different shapes in an antiparallel manner15. The BAR domain superfamily is composed of numerous types of proteins which all possess a BAR domain. Generally, the BAR domain superfamily is subdivided into three subfamilies: classical/N-BAR domain13,16, F-BAR17,18, and I-BAR19,20. These three subfamilies differ mainly by their structural shape (Fig. 1a). The F-BAR is more elongated and less curved than the N-BAR, and the I-BAR domain is referred to as the Inverse BAR due to the outward shape of its helices. BAR domain proteins are involved in a wide range of plasma membrane reshaping events including endocytosis21,22,23, exocytosis24,25, and filopodia formation26,27,28, thanks to their membrane curvature inducing properties29,30,31. They interact with lipid bilayers through electrostatic interactions. In addition to inducing membrane curvature, BAR domain proteins can also sense curvature as they show a preference for highly curved lipid bilayers32,33. The three subfamilies also differ by the type of membrane curvature they sense: N-BAR and F-BAR sense positive curvatures while I-BAR senses negative curvature34.

a Representation of the Bar domain superfamilies. From left to right, we have an N-Bar domain protein (human bridging integrator 2), an F-Bar domain protein (Rgd1p), and an I-Bar domain protein (Pinkbar). b Representation of FBP17. The main domains of the full length of FBP17 are shown along with a cartoon representation of the F-Bar domain.
Although the membrane sensing and inducing properties of BAR domain proteins in general have been established, the precise molecular mechanism of these interactions as well as the range of curvature sensed, and the maximum curvature induced remain unknown. Various in-vitro methods have been developed over the years to study membrane curvatures, each with their respective shortcomings. The liposome curvature assay tests for the size and positive curvature dependance of proteins, but not negative curvature35,36,37,38. The single nanotube experiment allows one to compare the protein curvature sensitivity along sharp lipid nanotube curvature to minimal giant unilamellar vesicle (GUV) curvatures. It involves pulling a single lipid nanotube from a GUV using optical tweezers or a micropipette-trapped bead39,40,41,42. This method was used to study both positive and negative curvatures in BAR domain proteins; however, it is a relatively low throughput method. Another method which solves this shortcoming is the supported membrane tube assay but allows for relatively sharp curvatures and positive curvature sensitivity43. Recently, a nanostructure-based curvature sensing (NanoCurvS) platform allowing for high throughput study of both positive and negative curvatures simultaneously with a wide range of curvatures was introduced44.
Several computational studies were also conducted investigating both spontaneous and nonspontaneous curvature formation of membranes45. Cooke and Deserno demonstrated the self-assembly of individual lipids in random starting configuration into curved lipid bilayers through coarse-grained molecular dynamics (MD) simulations46. Other studies also employed curvature-inducing proteins such as BAR domain proteins to generate curved lipids bilayers in all-atoms47,48,49 and coarse-grained50 simulations. To study the curvature sensitivity of proteins, generating a stable pre-curved membrane is often necessary. Recently, several tools have been developed for in silico generation of curved lipid bilayers. These methods include using dummy particles on various parts of the membrane to adapt a certain shape, or applying virtual forces on the membrane51,52,53,54,55,56,57. Most of the computational studies involved coarse grained molecular dynamics simulations as opposed to all-atoms simulations and they usually test a single lipid composition. While coarse grained MD provides speed, efficiency, and the ability to run simulations for a longer period, it lacks the chemical details necessary to fully understand the binding mechanisms. Nonetheless, these previous work in the membrane curvature space provide us invaluable insights that motivated this work.
In this study, we investigated the curvature sensing and inducing properties of an F-BAR domain protein, Formin Binding Protein 17 (Fig. 1b), at the nanoscale through the combination of an in-vitro platform with lipid coated nanobars and all-atoms molecular dynamics simulations (Fig. 2). First, we made in silico membranes of different shapes, sizes, and composition using a proposed simple pipeline (Fig. 2a–d). We also designed curved nanobars of different sizes which are coated with lipid bilayers of different compositions (Fig. 2e). Then, we examined the extent to which a single FBP17 molecule can bend flat lipid bilayers of different composition using all-atoms molecular dynamics simulations. We showed that a single FBP17 can bend a flat bilayer up to a 60–100 nm range of radius of curvature. Furthermore, we studied the range of curvature sensed by FBP17 in-vitro using the nanobars that were coated with lipids of different composition. We demonstrated that FBP17 prefers curvatures in the 200–500 nm diameter range. Finally, we were able to determine the key residues involved in the binding interactions and propose a mechanism for these interactions. These results give an insight into the role of BAR domain protein in general, and FBP17 in particular in the context of membrane structural fluctuations.
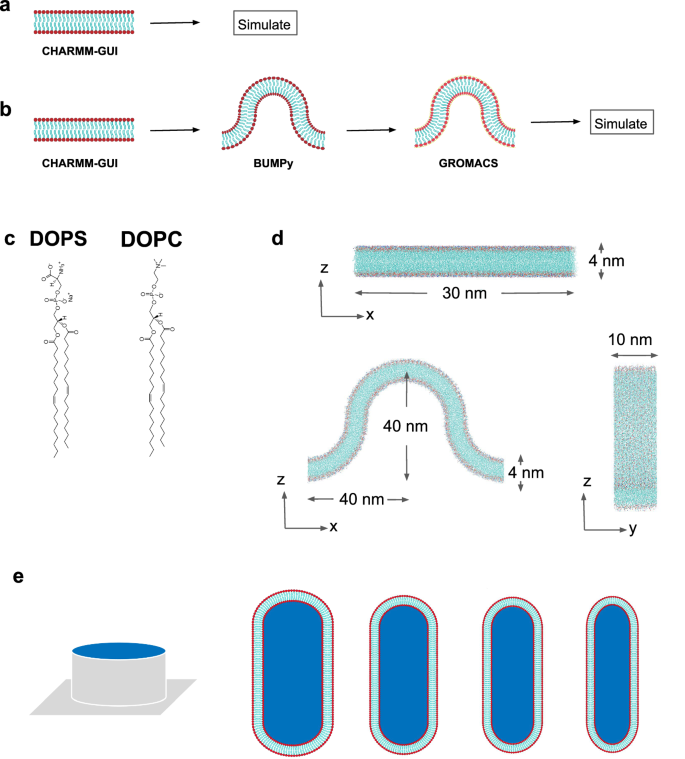
a In silico flat membrane design procedure. b In silico curved membrane design procedure. c Representation of the lipids. DOPS stands for dioleoyl phosphatidylserine and DOPC dioleoylphosphatidylcholine. d Schematics of the two membrane shapes in silico. Top figure shows a flat lipid bilayer and bottom figure shows a curved lipid bilayer. e Representation of the in vitro lipid coated nano-bars of different sizes.
Results
Single FBP17 molecules induce nanoscale curvature on flat lipid bilayers
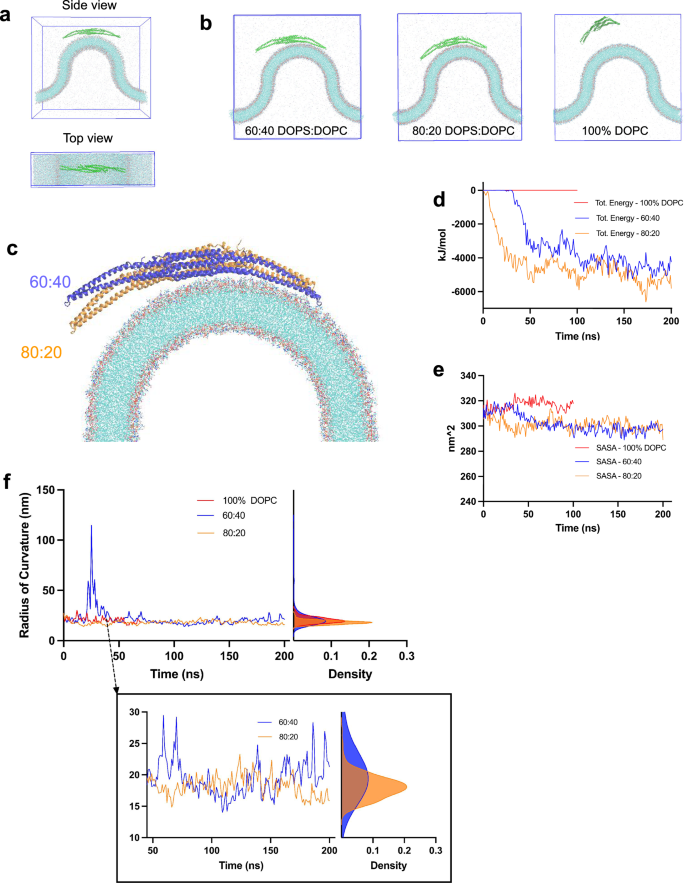
To determine whether a single FBP17 molecule can induce local curvature on a flat membrane bilayer, we exposed the binding surface of FBP17 to the flat membranes using molecular dynamics simulations (Fig. 3a). Three membrane compositions were tested to account for the charge dependency of binding between FBP17 and the membranes. We tested membranes having a composition of 80% DOPS/20% DOPC, 60% DOPS/40% DOPC, which are negatively charged and 100% DOPC which is neutral. After a 200 ns simulation, FBP17 induced curvature on the negatively charged membranes and did not interact with the neutral membrane as expected (Fig. 3b). To quantify these interactions, we calculated the sum of the Coulombic and Lennard-Jones energies between FBP17 and the three flat membrane compositions (Fig. 3c). As shown in Fig. 3c, a strong and progressive interaction occurs between the protein and the negatively charged membranes during the first 50 ns of simulation before reaching a steady state throughout the rest of the simulation. On the other hand, the interaction between FBP17 and the 100% DOPC membrane remains zero. To further quantify these differences, we obtained the solvent accessible surface area (SASA) of FBP17 in the three membrane compositions (Fig. 3d). Similar to the previous result, the SASA of FBP17 when in contact with the negatively charged membranes decreases, showing that more of the surface is instead interacting with the membranes. For the neutral membrane, the SASA increases slightly indicating the repulsion between the protein and the membrane. To quantify the local curvature of the three membranes, we plotted the x and z coordinates of the phosphorus atoms of the 10 nm by 30 nm central membrane piece leaflets and performed a least square fit through them to obtain a radius of curvature (Fig. 3e and Supplementary Fig. 1). Both the 80% DOPS/20% DOPC and 60% DOPS/40% DOPC membranes reach a minimum radius of curvature of ~60 nm, which corresponds to 120 nm diameter as plotted on Fig. 3e. The terminal curvature of both membranes concentrates in the 120–200 nm diameter range. On the other hand, the radius of curvature for the control membrane oscillates between smaller and larger values (~100–800 nm), indicating minimal sustained membrane curvature or random fluctuations as expected. Because the protein does not bind, this result is consistent with the 60% DOPS/40% DOPC membrane in absence of a protein in the simulation box (Supplementary Fig. 1).
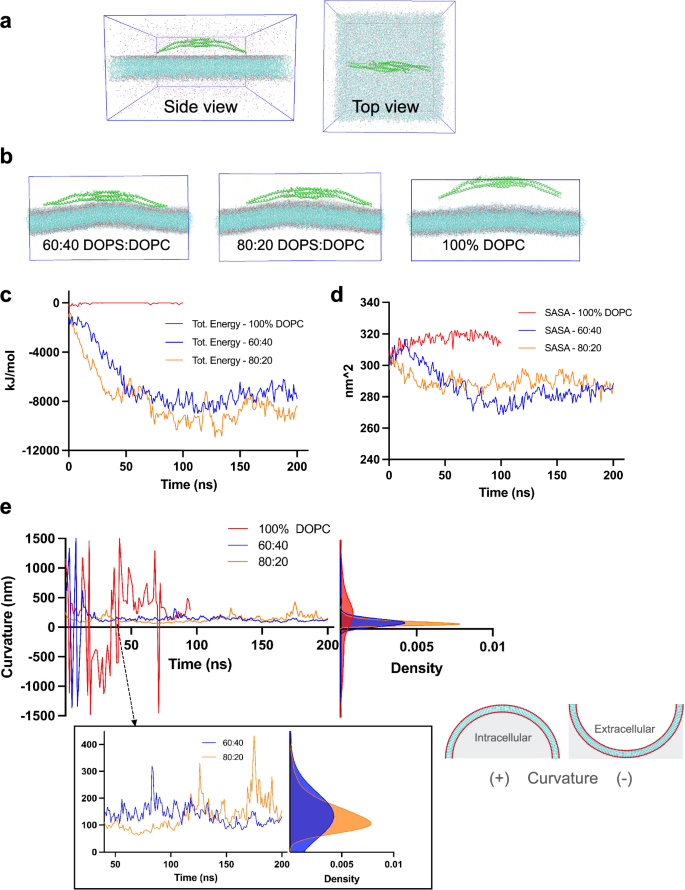
a Schematics of the simulation box. Left image shows a side view of the simulation box containing the flat membrane, the protein, ions, and water. The right image shows a top view. b Final frames of the simulations. From left to right, we have the final frame of the 60% DOPS 40% DOPC membrane, the 80% DOPS 20% DOPC membrane, and the 100% DOPC membrane. c Interaction energies between FBP17 and the three membrane compositions. The y-axis shows the total energy in KJ/mol and the x-axis the simulation time in ns. The blue curve depicts the energy between FBP17 and the 60:40 DOPS:DOPC membrane, the brown curve for the 80:20 DOPS:DOPC membrane, and the red curve for the 100% DOPC membrane. d Solvent accessible surface area (SASA) of protein in the 3 membrane cases. The y-axis shows the surface area in nm^2, and the x-axis represents the time in ns. The blue curve depicts the accessible area of FBP17 when simulated with the 60:40 DOPS:DOPC membrane; the brown curve represents the area for the 80:20 DOPS:DOPC membrane case, and the red curve for the 100% DOPC membrane case. e Curvature quantification. The left plot shows the curvature induced by FBP17 over time for the three membrane compositions: blue curve for the 60:40 DOPS:DOPC, brow curve for the 80:20 DOPS:DOPC, and red curve for the 100% DOPC. The y-axis depicts twice the radius of curvature in nm and the x-axis the simulation time in ns. The right plot shows the kernel density estimation of twice the radius of curvature per membrane type with the same color codes. Positive values show concave down curvature and negative values concave up as illustrated on the schematics on the right.
FBP17 exhibits a membrane curvature preference
Starting from the terminal curvature obtained from our in silico experiment using a single FBP17, we investigated the curvature preference and sensing range of the full length FBP17 (FBP17(FL)) using our custom-designed nanostructured platforms. Employing previously-established gradient nanobar arrays (with widths ranging from 200 nm to 1000 nm, all measuring 1 μm in height, 2 μm in length, and spaced 5 μm apart) as a solid support (Fig. 4a), we assessed the curvature sensing capabilities of FBP17(FL) on the 60% DOPS/40% DOPC lipid composition. Full-length FBP17 exhibited a preference for accumulating at nanobar ends where positive curvatures are induced (Fig. 4b). Averaged images and quantifications confirmed the preference of EGFP-FBP17(FL) for high positive curvature, with a curvature sensing range similar to that found on gradient nanoU44 arrays (Fig. 4c, d). The normalized FBP17(FL) intensity to background shows a significant difference in binding affinity between nanobar end (curved) and nanobar sides (flat) as shown in supplementary fig. 2. These findings align with previous cell-based studies58 and a related in vitro SLB-based investigation utilizing purified FBP1736.
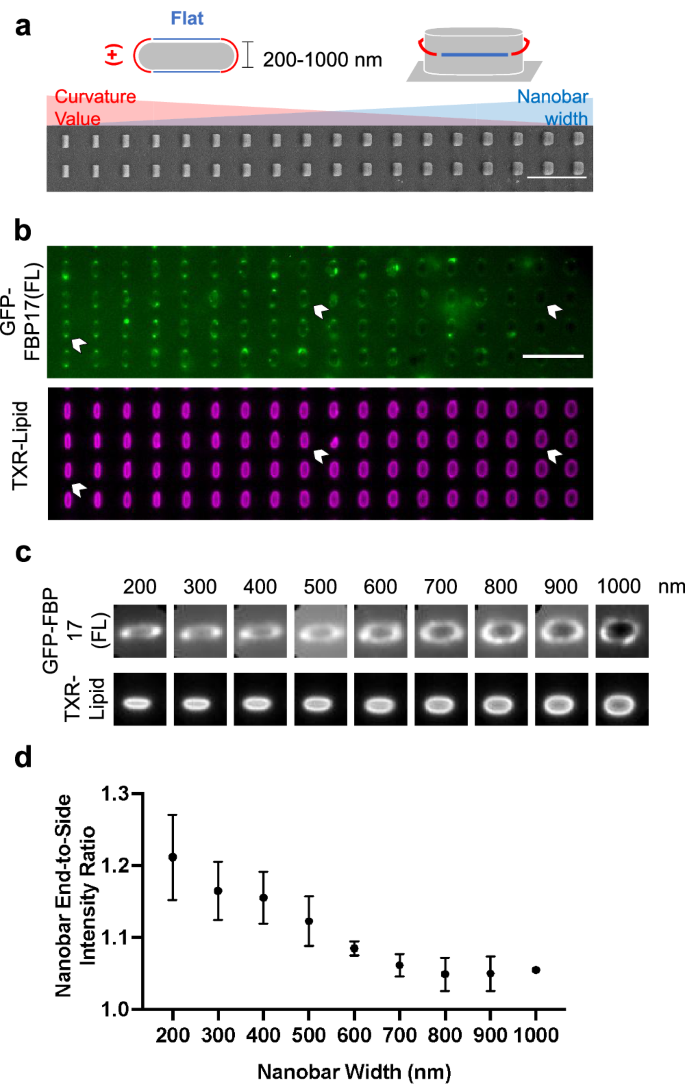
a Schematic illustration of a nanobar which induces two types of curvature and a scanning electron macroscopy image of a gradient nanobar array with nanobar width ranging from 200 (left) to 1000 nm (right). All nanobars are 1 µm in height and 5 µm in spacing. Nanobar width increment: 100 nm. Scale bar: 10 µm. b Representative fluorescence images of GFP-FBP17(FL) lysates on a SLB-coated gradient nanobar array. The lipid bilayer is composed of 60% DOPS, 40% DOPC and doped with ~1% Texas Red-DHPE for bilayer visualization. Scale bar: 5 µm. c Averaged images of GFP-FBP17(FL) lysates and TXR-lipid bilayer fluorescence signals on a gradient nanobar substrate. d Quantification of nanobar end-to-side intensity ratio of GFP-FBP17(FL) on SLB-coated gradient nanobar substrates. Error bars represent SEM.
The HR1 domain might be important for recruiting FBP17 to curved membranes
Furthermore, a liposome co-sedimentation assay was conducted to investigate the impact of lipid charges on the membrane affinity of FBP17 (Fig. 5). Texas Red-labeled liposomes, varying in their ratios of DOPS (anionic) to DOPC (zwitterion) and with an average diameter of ~130–200 nm, were prepared. These liposomes were then mixed with EGFP-labeled lysates of FBP17 variants and subsequently subjected to ultracentrifugation to quantify the binding of EGFP-FBP17 variants to the liposomes (Fig. 5a, b). The results indicate that both FBP17(FL) and FBP17(ΔSH3) exhibit high affinities for liposomes containing more than 60% negative charges (predominantly DOPS), while FBP17(BAR) shows no evident binding to liposomes, regardless of the lipid charge composition (Fig. 5c). These findings underscore the necessity of sufficient quantities of anionic phospholipids for the in vitro lipid binding of FBP17, consistent with prior observations30,59. Furthermore, our results suggest that the deletion of the SH3 domain does not affect the curvature sensitivity and sensing range of FBP17 in vitro, while the deletion of HR1 does. This result suggests the importance of the HR1 domain in recruiting FBP17 to curved membranes.
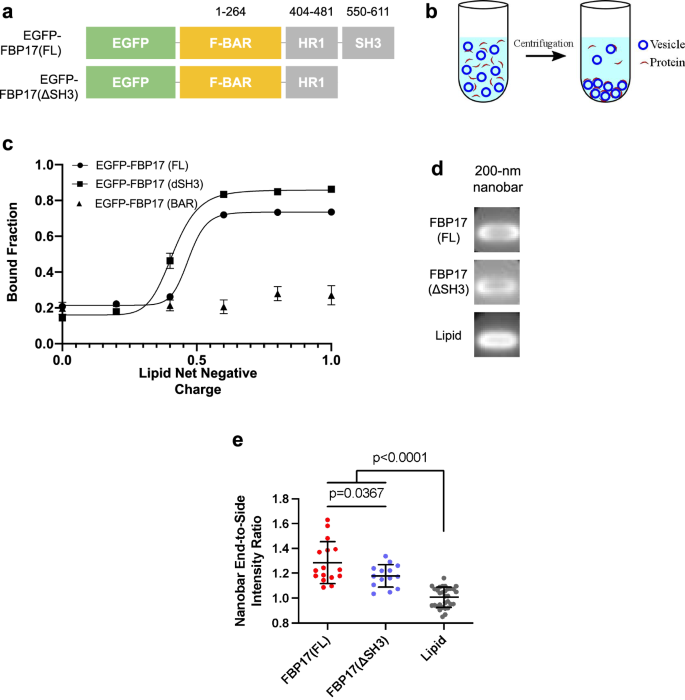
a The constructs of GFP-FBP17(FL) and GFP-FBP17(ΔSH3). b Schematic illustration of co-sedimentation assay used for assessing liposome-FBP17 interaction. c Quantifications of the lipid-bound fraction of GFP-FBP17 variant as a function of lipid net charge. Liposomes are composed of various ratios of DOPS/DOPC. Error bars represent SD. d Averaged images of GFP-FBP17(ΔSH3) fluorescence signals on the 200-nm nanobar substrate. e Quantifications of nanobar end-to-side intensity ratio of GFP-FBP17(FL) and GFP-FBP17(ΔSH3 on SLB-coated 200-nm nanobar substrates. Error bars represent SD.
The curvature sensitivity of FBP17 depends on the membrane composition
Subsequently, the curvature sensitivity of both EGFP-FBP17(FL) and EGFP-FBP17(ΔSH3) was assessed on 200-nm nanobar arrays. Considering the results from the co-sedimentation experiments, 200-nm nanobar arrays were coated with a 60% anionic supported lipid bilayer (SLB) (40% DOPC and 60% DOPS) to ensure stable binding of FBP17 lysates to the lipid bilayer. Averaged fluorescence images and quantifications reveal that both EGFP-FBP17(FL) and EGFP-FBP17(ΔSH3) exhibit a preference for positive curvature, as evidenced by higher nanobar end-to-side ratios compared to the lipid bilayer alone, consistent with previous cell-based findings (refer to Fig. 5d–e)58.
Following the in-vitro experiments, we investigated the molecular mechanisms of interactions between FBP17 and curved lipid bilayers of different composition (Fig. 6). We made curved lipid bilayers of 20 nm radius with 80% DOPS/20% DOPC, 60% DOPS/40% DOPC, and 100% DOPC, and positioned FBP17 within 10 Å of them (Fig. 6a). After 200 ns of simulation, FBP17 interacted with the negatively charged but not with the neutral membrane (Fig. 6b) as shown through interaction energies (Fig. 6d) and solvent accessible surface areas (Fig. 6e). However, during simulation, FBP17 did not completely interact with the entire curvature of the negatively charged membranes (Fig. 6c). Rather, one arm and the center of the protein interacted with the membrane. Figure 6c shows that FBP17 non-interacting arm was closer to the more negatively charged membrane (80% DOPS/20% DOPC) than the other one (60% DOPS/40% DOPC). As evidenced in Fig. 6f, the radius of curvature for FBP17 with the more negatively charged membrane was lower. This may indicate that the curvature sensitivity of FBP17 depends on membrane composition. Moreover, it may confirm that the 20 nm radius would be too curved to be sensed by FBP17. Also, this result can give us an insight into the binding mechanism of FBP17. It may suggest that one monomer is first recruited to the curved membrane, before the center and the other monomer interact with the curved bilayer.
a Schematics of the simulation box. Top image shows the side view of the simulation box containing the curved membrane, the protein, ions, and water. The bottom image shows a top view. b Final frames of the simulations. From left to right, we have the final frame of the 60% DOPS 40% DOPC membrane, the 80% DOPS 20% DOPC membrane and the 100% DOPC membrane. c Overlay of the final frames of the two negatively charged membrane conditions, showing the conformational differences of FBP17. d Interaction energies between FBP17 and the 3 membrane compositions. The y-axis shows the total energy in KJ/mol and the x-axis the simulation time in ns. The energy between FBP17 and the 60:40 DOPS:DOPC membrane (blue), 80:20 DOPS:DOPC membrane (brown), and 100% DOPC membrane (red) are shown. e Solvent accessible surface area (SASA) of FBP17. SASA is shown for the three membrane conditions: 60:40 DOPS:DOPC (blue), 80:20 DOPS:DOPC (brown), and 100% DOPC (red). The y-axis shows the surface area in nm^2 and the x-axis the simulation time in ns. f Curvature quantification. The left plot shows the radius of curvature of FBP17 over time for the three membrane compositions: 60:40 DOPS:DOPC membrane (blue), 80:20 DOPS:DOPC membrane (brown), and 100% DOPC membrane (red). The right plot shows the kernel density estimation of the radius of curvature per membrane type with the same color codes.
Key residues contribute to the binding between FBP17 and the membranes
To investigate the most important residues in the interaction between FBP17 and the lipid bilayers, we conducted a binding free-energy decomposition analysis using the Molecular Mechanics Poisson Boltzmann Surface Area (MMPBSA) method. For each membrane shape system, we analyzed the residues and lipids interacting as defined by a 6 Å cut-off distance and considered the free energy deltas lower than −4 kcal/mol (Fig. 7). As expected, our results revealed key lysine and arginine residues, as they are positively charged. More importantly, a few of these residues seem to be consistently important for each membrane shape. For the flat membrane setups, these key residues are: K52, R113, K132, R139, R143, and R150 (Fig. 7a). In the curved bilayer conditions, K52, K132, R139, R143 and R150 seem to contribute more to the interactions (Fig. 7b). Interestingly, five residues are involved for both flat and curved membrane interactions: K52, K132, R139, R143 and R150. K52 is located in the middle part of the protein while the other four residues are located on the side helices (Fig. 7c). This may suggest the importance of these helices in the membrane binding mechanisms.
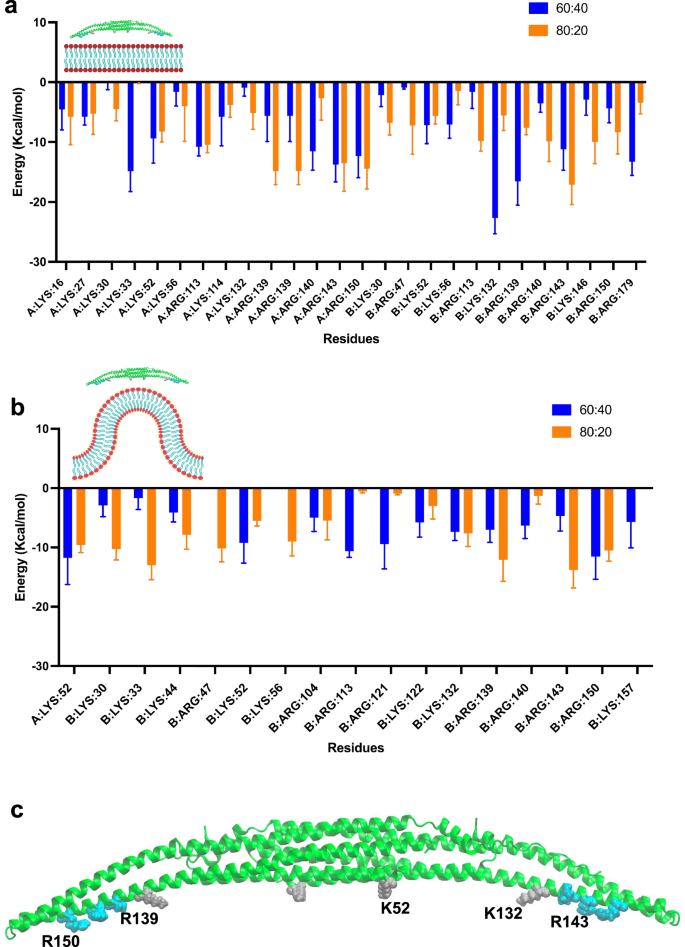
a Decomposition analysis of FBP17 for the charged flat membranes systems for the last 20 ns of simulation. b Decomposition analysis of FBP17 for the charged curved membranes systems for the last 20 ns of simulation. The y axis represents the free energy and the x axis the residues. A, B refer to the two protomers of the protein. The blue bars pertain to the 60:40 DOPS:DOPC membrane while the orange bars correspond to the 80:20 DOPS:DOPC membrane. c Crystal structure of the BAR domain of FBP17 with the key residues depicted in gray for lysine and cyan for arginine.
Discussion
BAR domain proteins are known to induce curvature in lipid bilayers through electrostatic interactions. FBP17, an F-BAR domain protein which possesses positively charged residues on its interacting surface, namely arginine, and lysine, would require a membrane to have a net negative charge to bind to it. This was shown by our molecular dynamics simulations, where the BAR domain of FBP17 interacts and induces curvature on the negatively charged membranes, while it is repelled from the neutral one. Our results agree with Yu and Schulten who show that a single F-BAR domain protein is capable of inducing curvature on a flat bilayer47. However, our results suggest that the degree of curvature induced by the protein is not heavily dependent on how negative the membrane is. In fact, the two flat bilayers of different compositions achieve almost the same maximum curvature during our 200 ns simulations. The more negative membrane promoted, however, a faster binding of FBP17.
To determine the curvature sensitivity of our protein of interest in vitro, we designed a lipid coated nanobar assay with diameters ranging from 200 to 1000 nm. The starting diameter of 200 nm matched the preferred terminal curvature of the flat membranes in simulation. These results showed that FBP17 has a curvature sensitivity ranging from a diameter of 200 to 500 nm. Beyond this point, the binding of the protein to the lipids decreases significantly. To further investigate the effect of different variants and lipid compositions on the curvature sensitivity in vitro, we used a co-sedimentation assay with the 200 nm diameter nanobars. This showed that the BAR domain on its own was not enough for curvature sensitivity; the HR1 and SH3 domains play a significant role. These results are consistent with Taylor et al. who identified a polybasic region between the BAR domain and HR1, which is required for membrane sensing and curvature induction60.
However, through our curved molecular dynamics simulations, we found that the BAR domain alone could sense a curved membrane. As shown in Fig. 6, FBP17 could sense and bind to the negatively charged curved membranes, while it was repelled from the neutral one as expected. As opposed to the in-vitro experiments, FBP17 is brought close enough to the curved membranes to interact with them. This may indicate that the HR1 and SH3 domain play a role in the recruitment of FBP17 to the membranes, however they may not be crucial for the interaction of FBP17 with the curved membrane. Furthermore, we noticed that FBP17 could not bind completely to the curvature tested during the 200 ns simulation. However, a clear charge-based preference was shown by the protein as its interaction was stronger in the more negatively charged membrane.
A binding mechanism can also be inferred from our MD simulations. Although the center of the protein was relatively closer to the membrane than the sides, it’s through one of the helices that the protein interacts with the curved bilayer first. Following this, the middle is recruited, and the other side likely follows, although this was not seen in our simulations. This may suggest that the curvature tested was too sharp for a single FBP17. However, due to computational costs constraints, we were not able to test larger radii of curvature. Although the method used for generating curved bilayers and the process for maintaining the curvature are relatively simple and convenient, they suffer from the high computational cost for all-atoms simulations at lower curvatures. Thus, new clever ways for reducing the computational burden of running longer all-atoms simulations with larger radii of curvature must be investigated.
Nevertheless, our all-atoms curved bilayers allowed us to determine some of the key residues in the interactions between FBP17 and curved bilayers through free energy-based calculations. These key residues were K52, K132, R139, R143, and R150. Our results are consistent with Tsujita et al. where a double mutation K51Q + K52Q reduced the membrane tubulations induced by FBP17 in cells as compared to the wild type59. Further mutation studies with all-atom simulations might confirm these findings and provide useful insights on detrimental mutations for FBP17.
Membrane curvature remains an important part of cellular functions. Understanding the mechanisms and interactions between proteins and lipid bilayers at nanoscale is crucial for elucidating the most important cell functions in health and disease and potentially designing therapeutics. We showed that a single FBP17, an F-BAR domain protein, can induce local curvature on flat bilayers. It also shows a clear preference for a range of curvature that it can sense, which is mediated by the membrane composition. Finally, our results revealed some key residues for the binding between FBP17 and lipid bilayers. Nonetheless, more work needs to be done at nanoscale with lower membrane curvatures and various BAR-domain proteins via longer all-atoms molecular dynamics simulations. Thus, more efficient membranes or simulation protocols need to be investigated for scaling the methods presented in this paper. Our future work will extend these methods to clusters of proteins which are relevant for membrane curvature.
Methods
In silico flat membranes modeling procedures
Flat lipid bilayers were constructed using the CHARMM-GUI membrane builder61,62,63,64,65, which allows for choosing a desired size and a precise lipid composition (Fig. 2a).
In silico curved membranes modeling procedures
To obtain the curved lipid membranes, we first generate a small flat lipid bilayer with the CHARMM-GUI membrane builder, which is subsequently used as a patch for the Building Unique Membranes in Python (BUMPy)57 package. We used the buckled option of BUMPy with a desired radius of curvature. To avoid the collapse of the membrane, we applied position restraints to the phosphorus atoms of the lipids with GROMACS, effectively bracketing and stabilizing the membrane without disrupting its fluidity (Fig. 2b).
In vitro curved membrane preparation: nanostructure fabrication
The 200-nm nanobar and gradient nanobar arrays (Figs. 2e and 4a) were made using electron-beam lithography (EBL) and reactive ion etching (RIE), as previously described66,67. Quartz wafers were coated with electron-beam resist and conductive material, and then nanobar patterns were etched using EBL. A chromium mask was applied, and nanostructures were formed with RIE. After cleaning and coating the wafers, patterns were exposed to UV light, and nanostructures were created using a similar process. The final shapes and sizes of the nanostructures were examined using scanning electron microscopy.
In vitro curved membrane preparation: lipid preparation
Commercially available lipids including DOPC, DOPS, and 18:1 PI(4,5)P2 were purchased from Avanti Polar Lipids. To prepare the SLB with various lipid compositions, ~1 mol% of Texas Red-labeled lipid (DHPE-TXR) from Thermo Fisher Scientific was incorporated into the mixture. Lipid components were dissolved and mixed in chloroform, dried under nitrogen, and desiccated for 30 min. The resulting lipid pellets were then dissolved in isopropyl alcohol (IPA) to create a 0.5 mg/mL lipid mixture, which was sonicated for 5–10 min at room temperature.
The SLB was formed using a solvent-assisted lipid bilayer (SALB) method as described previously68. In brief, nanostructured substrates were cleaned with piranha and plasma treatments and sealed with custom-made PDMS wells. IPA was added to the wells and incubated for 5 min at room temperature. Afterward, the IPA was replaced with 50 μL of 0.5 mg/mL lipid mixture and incubated for 10 min. Subsequently, 1X PBS was added to complete the SALB formation. After a 5-min incubation, residual vesicles were removed by gentle washing with 1X PBS. EGFP-labeled BAR-family protein lysates in 1X PBS were then added to the SLB-coated nanostructured substrates and incubated for 10–15 min (for full-length FBP17 and its variants). Prior to fluorescence imaging, samples were gently washed with 1X PBS 5–6 times.
Molecular dynamics simulations
The crystal structure of the EFC domain of FBP17 (PDB Code: 2EFL) was obtained from the protein data bank and used for all simulation setups (Fig. 1b). Two lipid types, DOPS and DOPC (Fig. 2c) with different ratios, were used to construct two types of lipid bilayers: flat and curved (Fig. 2d). CHARMM-GUI membrane builder61,62,63,64,65 was used to build flat bilayers of three compositions: 60% DOPS/40% DOPC, 80% DOPS/20% DOPC, and 100% DOPC. Each flat membrane was 30 nm by 30 nm wide and 4 nm thick with equal lipid distribution in upper and lower leaflets (Fig. 2d).
Flat lipid bilayer simulations
FBP17 was positioned at 1 nm distance on top of the membranes using CHARMM-GUI (Fig. 3a). This ensured that the two systems (protein-membrane) were close enough to interact with each other during the simulation with maximal efficiency. All simulations were performed with GROMACS and the CHARMM36 Force Field. The protein-membrane systems along with TIP3P water model and a neutralizing salt-concentration of 0.15 M NaCl were contained in a simulation box that was 30 nm by 30 nm wide and 15 nm high. The systems were energy minimized using 500,000 steps with an energy tolerance of 1000 kJ/mol/nm and equilibrated in five NVT steps and three NPT steps with a time step of 1 fs for a total length of 4.5 ns while progressively removing constraints. The constant temperature for all runs was 310 K and the Berendsen pressure coupling was used for equilibration. Production steps were then run with a 2 fs timestep for 200 ns for negatively charged membranes with FBP17, and 100 ns for the neutral membrane, and 50 ns for the 60% DOPS/40% DOPC membrane without FBP17 using the Parrinello-Rahman barostat.
Curved lipid bilayer simulations
The curved lipid bilayers were obtained by using the python code BUMPy with small flat membrane models constructed with the CHARMM-GUI Membrane Builder tool. Three membrane composition ratios were made: 60% DOPS/40% DOPC, 80% DOPS/20% DOPC, and 100% DOPC. These buckled bilayers have a radius of 20 nm, a width of 10 nm, and a thickness of 4 nm (Fig. 2d). The protein, FBP17, was centered and placed at 1 nm distance from the top of the curved bilayers. The simulation boxes which were 80 nm long, 10 nm wide, and 50 nm high were completed by TIP3P water molecules and 0.15 M NaCl neutralizing concentration. GROMACS and the CHARMM-36 force field were used to run the simulations. The systems were energy minimized using 500,000 steps with an energy tolerance of 1000 kJ/mol/nm and equilibrated in 5 NVT steps and 3 NPT steps with a time step of 1 fs for a total of 4.5 ns while progressively releasing constraints. The constant temperature for all runs was 310 K and the Berendsen pressure coupling was used for equilibration. Production steps were then run for 200 ns for the negatively charged membranes and 100 ns for the neutral one with a 2 fs timestep using the Parrinello-Rahman barostat.
Interaction energy
The short range nonbonded interaction energies which comprise both Coulombic and Lennard-Jones interactions between the membrane and FBP17 were calculated using GROMACS69 free software.
Solvent accessible surface area
SASA of the protein was calculated using GROMACS69 free software.
Membrane curvature quantification
The x and z coordinates of the phosphorus atoms of the central 10 nm by 30 nm wide piece of the membrane leaflets were used. The radius of curvature was obtained via least squares fit through them using Python70. Twice the radius of curvature was plotted.
FBP17 curvature quantification
The x and z coordinates of the atoms of FBP17 residues were used and the radius of curvature was obtained via least squares fit through them using Python70.
Per residue free energy calculation
The free energy decomposition analysis was done for the last 20 ns of the simulation using the gmx_MMPBSA71,72 package with the generalized Born method. The entropic term was not considered. The residues and lipids within 6 Å were selected for the calculation. The residues with a delta inferior to −4 kcal/mol for each system were plotted as well as the corresponding residues for the other system for comparison.
Visualization
All visualizations were made using the Visual Molecular Dynamics software73.
Co-sedimentation assay
Vesicles were extruded using a mini-extruder (Avanti Polar Lipids) through polycarbonate filters with 0.1 μm pore sizes to prevent potential aggregates and produce liposomes with an average diameter of ~130–200 nm. These liposomes were then combined with EGFP-labeled lysates of FBP17 variants. Afterward, the mixtures were subjected to ultracentrifugation to quantify the amount of EGFP-FBP17 variant-bound liposomes.


Responses