Nearly quantum-limited microwave amplification via interfering degenerate stimulated emission in a single artificial atom

Introduction
Stimulated emission1, a fundamental phenomenon that is at the heart of modern laser and maser technology, plays a key role in amplifiers2. This process occurs when an incident photon interacts with a fully excited (population inversion) two-level atom, resulting in the emission of an additional photon, leading to a power gain G of 2, with added noise of one quantum. The quantum limit for the noise is3
i.e., 0.25 quanta for the gain in this example. To achieve quantum-limited added noise, this mechanism can be extended to a multi-level atom with a multi-photon pump. In such a system, it is possible to have emissions with the same energy from two different dressed-state transitions with population inversion. If these emissions do not interfere, the total emitted intensity I will be the sum of the individual intensities, i.e., (I=| overrightarrow{{E}_{1}}{| }^{2}+| overrightarrow{{E}_{2}}{| }^{2}approx 2| E{| }^{2}), where E ≡ E1 ≈ E2 is the electric field of individual emission. With quantum interference, the maximum intensity becomes (I={(overrightarrow{{E}_{1}}+overrightarrow{{E}_{2}})}^{2}=| overrightarrow{{E}_{1}}{| }^{2}+| overrightarrow{{E}_{2}}{| }^{2}+2overrightarrow{{E}_{1}}cdot overrightarrow{{E}_{2}}approx 4{| E| }^{2}) when (overrightarrow{{E}_{1}}) and (overrightarrow{{E}_{2}}) are in phase. The dot-product term represents the contribution from the interference. Thus, the emission intensity, and thus the gain, with quantum constructive interference can be twice that of emission without quantum interference. Crucially, the added noise is the same for both cases. Here, we utilize these properties to achieve nearly quantum-limited added noise in amplification with a single artificial multi-level atom.
To explore amplification by stimulated emission from atoms in a three-dimensional open space is challenging since atoms and electromagnetic fields only interact weakly there, due to spatial mode mismatch4. However, the interaction can be increased by confining an atom to interact with the continuum field in a one-dimensional open waveguide5,6; one realization of such a setup is with a single artificial atom in an open transmission line7. The study of numerous quantum optical effects in such setups has paved the way for the emerging field of waveguide quantum electrodynamics (QED)8,9,10,11,12,13,14,15,16,17,18,19,20.
Existing amplification schemes in waveguide QED have employed various mechanisms, such as population inversion between bare states7, population inversion between dressed states21, and amplification without population inversion due to higher-order processes between dressed states22. However, none of those schemes have led to experimentally measured amplitude (power) amplification of more than 1.09 (1.19), nor noise close to the quantum limit. Here, we demonstrate a significant improvement in the amplification of the probe field using quantum coherence between the Rabi sidebands of a strongly driven superconducting artificial atom at the end of a semi-infinite transmission line; at the same time, we also achieve nearly quantum-limited noise. The mechanism, which builds on top of an essentially half-waveguide-QED system, differs from previous work21, where the artificial atom was coupled to an open transmission line and only a two-photon pump was investigated. Due to the weak anharmonicity of the artificial atom, the strong pump field not only generates stable dressed states but also produces population inversion across them. The key difference between this work and others7,21,22 is the degenerate stimulated emission.
We investigate the cases of two-photon, three-photon, and four-photon pumping, which result in multiple Rabi sidebands that lead to either amplification or attenuation of the weak probe. When two amplification Rabi sidebands cross, the emitted photons from one sideband interfere constructively with those from the other sideband to further enhance amplification. In addition, the one-dimensional and unidirectional output ensures perfect interference between the two amplification Rabi sidebands and eliminates the disadvantage of losing half of the stimulated emission due to the bidirectional output in a waveguide-QED system23. We also engineer the artificial atom to have a relaxation rate much faster than its pure dephasing rate, which further improves amplification. With all these effects combined, we obtain a maximum power amplification of G = 1.402 ± 0.025, higher than any previous work with a single artificial atom7,21,22. At the same time, our experiment is the first in such a setup to achieve nearly quantum-limited added noise. By analyzing the spectrum of spontaneous emission, we find that the added noise in our amplification is 0.157 ± 0.003 quanta. This is very close to the quantum limit of 0.143 ± 0.006 quanta for our power gain G, as given by Eq. (1). The bandwidth and saturation power of the amplification is 4 MHz and −131 dBm, respectively.
Results and discussion
Theoretical model and experiment
The theoretical model is illustrated in Fig. 1a, b. We consider a superconducting artificial atom, an M-level transmon24, at the end of a semi-infinite transmission line16,22. A strong resonant pump field is fed into the atom from the open end, exciting the transmon from its ground state (leftvert 0rightrangle) to a particular excited state (leftvert Nrightrangle) by absorbing N photons. In order to probe the transmon dressed by the pump, we apply a weak probe field, whose Rabi frequency Ωp is much smaller than the transmon decoherence rate γ10, and analyze the power reflectance ∣r∣2 of this probe. The results show that amplification (∣r∣2 > 1) is caused by the probe photons being resonant with the dressed states exhibiting population inversion. Additionally, due to the multiple levels of the transmon, near-resonant transitions from different sidebands constructively contribute to the reflected signal, resulting in an enhancement of the amplification. Conversely, attenuation (∣r∣2 < 1) occurs when the population between dressed states is not inverted. The theoretical description of the system’s dynamics and the calculation of reflectance are discussed in the “Methods” section.

a An M-level transmon is pumped by a strong resonant field with Rabi (carrier) frequency Ωpump (ωpump). The Rabi frequency is related to the radio-frequency (RF) power through (Omega =ksqrt{P}), where k is a coupling constant and P is the RF power14. The transmon is pumped from (leftvert 0rightrangle) to (leftvert Nrightrangle) by an N-photon absorption process. A weak probe with frequency ωp is applied to the system. The relaxation rate between adjacent states (leftvert Nrightrangle) and (leftvert N-1rightrangle) is denoted by ΓN,N−1. b Energy diagram of the dressed states in the rotating frame of a pump frequency ωpump. Here Di (i = 0, 1, …, M−1) is the ith eigenstate (with energy (hslash {omega }_{i}^{{rm {D}}})) of the system with Hamiltonian ({H}_{{rm {a}}}^{{prime} }={H}_{{rm {a}}}+{H}_{{rm {d}}}) (Ha and Hd are defined in Eqs. (4) and (5), respectively, in the “Methods” section) and F denotes the photon number. The dashed purple line represents the pump frequency ωpump and the solid blue double-sided arrow indicates the transition between dressed states (see Supplementary Information Note 6 for more details). c A simplified circuit diagram of the experimental setup where a probe field (green) and a pump field (purple) are combined by an RF combiner at room temperature with attenuation (red rectangle) and fed into the sample (optical micrograph inside the red dashed box). The micrograph shows an artificial atom (transmon), formed by a large cross-shaped island, capacitively coupled to the end of a semi-infinite transmission line, with a characteristic impedance of Z0 ≃ 50 Ω. The reflected output field is measured in a vector network analyzer (VNA). The position of the superconducting quantum interference device (SQUID) loop of the transmon is shown in the scanning electron micrograph on the right. The yellow dashed box shows the cryogenic environment of the dilution refrigerator. Further details on the experimental setup are given in Supplementary Information Note 1.
We characterize the basic properties of the artificial atom through single-tone scattering14,20. We employ two-tone, three-tone, and four-tone spectroscopies to characterize the energy structure of the transmon (see Supplementary Information Note 2 for details). All the extracted parameters are summarized in Table 1. Note that we, throughout the manuscript, calibrate the incident field by measuring the reflected field when the qubit is far detuned. In the measurements of amplification, we focus on the case of three-photon pumping, in which we observe quantum coherence between Rabi sidebands. We also investigate the two- and four-photon pumping cases in Supplementary Information Notes 3 and 5, respectively. The maximum power amplification obtained for all three pumping cases is given in Supplementary Information Table 2.
In the three-photon-pumping experiment, we pump the (leftvert 0rightrangle to leftvert 3rightrangle) transition of the transmon with the experimental setup in Fig. 1c. When this pump is resonant, the frequencies of three pump photons sum up to ω30 = ω10 + ω21 + ω32. Therefore, we set the pump frequency to ωpump/2π = ω30/6π = 4.530 GHz, indicated by the purple arrow in Fig. 2a, b, and sweep the pump power Ppump from −125 to −85 dBm. To probe the driven system, we simultaneously sweep a weak continuous probe field at frequency ωp over a wide range of frequencies, including higher transitions. The experimental data for the reflectance ∣r∣2 of the probe field are shown in Fig. 2a and the corresponding numerical simulation is shown in Fig. 2b.
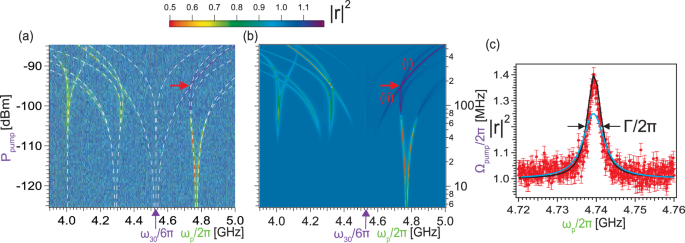
a Measured reflectance spectra ∣r∣2 of the weak probe field (Pp = −161 dBm) as a function of probe frequency ωp (x-axis) and pump power Ppump (y-axis). The pump frequency is ωpump = ω30/3 = 2π × 4.530 GHz. b Numerical simulation of the experiment. The left y-axis is the pump power; the right y-axis is the Rabi frequency Ωpump. We set M = 6 and use the relaxation rates Γn,n−1/2π = nΓ10/2π = 2.264n MHz, where n = 1, 2, …, 5. There are no free fitting parameters for the simulation. c A linecut taken at Ppump = −95 dBm from Supplementary Information Fig. 4, where the two amplified Rabi sidebands cross each other at ωp/2π ≈ 4.739 GHz (indicated by a red arrow in Fig. 2a, b), shows a maximum reflectance 1.402 ± 0.025. The black arrows indicate the width of the reflectance spectrum (Γ/2π ~ 4 MHz). The solid red dots are the experimental data with standard deviation, the solid black curve is the linecut of the numerical simulation from b, and the solid blue curve is the theoretical result without quantum coherence between the amplified Rabi sidebands26. The excess gain (black) is about twice that of the case without quantum interference (blue). The roughly 2% difference between data and theory from 4.72 to 4.73 GHz is most likely due to the gain drift of the HEMT amplifier (see Supplementary Information Fig. 1) measured with the background (reference) reflectance.
In Fig. 2a, the dashed curves show the numerically calculated Rabi sidebands resulting from transitions between dressed states in Fig. 1b (see Supplementary Information Note 6 for details). Note that the number of Rabi sidebands is predicted to be (Nleft(N+1right)) in ref. 23. Taking N = 3 as in ref. 23 would yield 12 sidebands, which is inconsistent with the measured results (14 sidebands). This disagreement is due to the effect of higher transmon levels than those considered in ref. 23, which become important here due to our strong pumping leading to three-photon processes. The strong pumping in our experiments leads to the emergence of additional transitions, some of which lie outside the measured frequency range. For Ppump > −95 dBm, transitions involving dressed states, (vert {D}_{i},F+1rangle leftrightarrow vert {D}_{j},Frangle), where i > j (i < j), lead to amplification (attenuation) when ωp > ωpump (ωp < ωpump). This observation can be explained by the population distribution of the dressed states in Supplementary Information Fig. 9. Amplification (attenuation) occurs when population inversion (non-inversion) takes place among the dressed states.
At low pump powers, when Ppump ~ −120 dBm, only a single response is visible in the reflectance spectrum in Fig. 2a, b, around the (leftvert 0rightrangle leftrightarrow leftvert 1rightrangle) transition frequency, in the form of split bright stripes. As the pump power increases, we observe a clear and increasing splitting around the resonance frequency ω10/2π = 4.766 GHz. This effect is detuned Autler–Townes splitting25 (detuning Δ = ωpump−ω21 = −2π × 8 MHz), suggesting that there are dressed states formed by the bare states (leftvert 1rightrangle) and (leftvert 2rightrangle) with the pumping field. Details are shown in Supplementary Information Fig. 12. When the pump power increases further, beyond −110 dBm, we observe multiple Rabi sidebands, which correspond to various transitions between the dressed states. The Rabi sidebands appear as amplification or attenuation of the weak probe field.
The maximum amplification occurs when the signals of the two amplified Rabi sidebands (leftvert {D}_{3},Frightrangle leftrightarrow leftvert {D}_{4},F+1rightrangle) [label (i)] and (leftvert {D}_{4},Frightrangle leftrightarrow leftvert {D}_{5},F+1rightrangle) [label (ii)] in Fig. 2b cross at frequency ωp/2π ≈ 4.739 GHz and pump power −95 dBm, interfering constructively. As the near-resonant transitions involving two different transition paths can take place at the same time, an emitted photon from one path triggers the emission of both transitions, thus contributing to the amplification in a collective way. The degree of enhancement can be calculated more accurately by explicitly considering multiple sideband cross-coherences, as shown in ref. 26. Figure 2c shows the experimental measurement (dots) and numerical simulation (black solid curve) of a horizontal linecut at maximum amplification (indicated by red arrows in Fig. 2a, b). A zoomed-in view of the amplified Rabi sidebands crossing, where we observe quantum coherence, is provided in Supplementary Information Note 4. The solid blue curve represents the theoretical curve without quantum coherence between the amplified Rabi sidebands26. The amplified peak has a full width at half maximum (FWHM) of 4 MHz, revealing a maximum power amplification of 1.402 ± 0.025. The data and the simulations are in excellent agreement without any free-fitting parameters.
It is important to further examine the amplification properties of the system. Figure 3a shows the measured saturation of the amplification process as a function of probe power Pp (Rabi frequency Ωp) at the maximum amplification point. The details of the measurements, including more data, are provided in Supplementary Information Note 7. We observe a maximum power amplification of 1.405 ± 0.072 in the regime of weak probe power. As we increase Pp (Ωp) beyond the saturation power Psat, the amplification begins to saturate towards unity. We also studied gain limitations; see Supplementary Information Note 4A for more details. Approximately half of the excess maximum reflectance is ∣r∣2 ≃ 1.2. The probe power and Rabi frequency at this reflectance correspond to the saturation power Psat and linewidth Γ/2π, respectively, as indicated by the markers. The saturation power Psat is related to the linewidth of the dressed state by Psat = ℏωcΓ ≃ −131 dBm, where ωc and Γ are the resonance frequency and the linewidth of the dressed state, respectively.
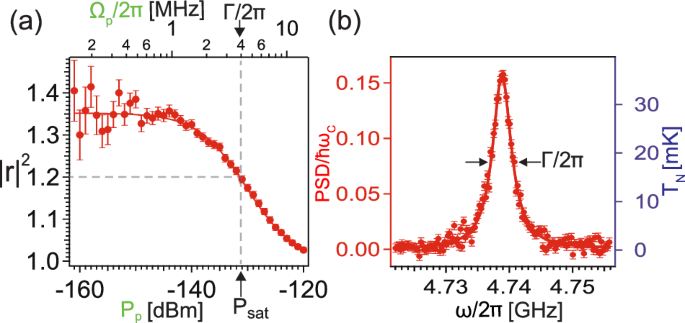
Solid dots represent experimental data with standard deviation; solid red curves show the results of numerical simulations. We set the pump frequency to a fixed value of ω30/6π = 4.530 GHz, and the pump power to Ppump = −96.5 dBm. a Measured reflectance ∣r∣2 as a function of probe power Pp (bottom x-axis) at the point where we observed the maximum power amplification (1.405 ± 0.072) at weak probe power. The top x-axis shows the Rabi frequency Ωp. b At the maximum amplification point, the pump field induces a population inversion between the states (leftvert {D}_{3},Frightrangle leftrightarrow leftvert {D}_{4},F+1rightrangle) [label (i)] and (leftvert {D}_{4},Frightrangle leftrightarrow leftvert {D}_{5},F+1rightrangle) [label (ii)]. This population inversion leads to the spontaneous emission of photons, as depicted in the measured spectrum in red on the left y-axis as a function of frequency ω. The spectrum reveals the characteristic emission profile corresponding to these states. The noise temperature, crucial for amplifier operation, is shown in blue on the right y-axis. The arrows indicate the width of the spectrum (Γ/2π ~ 4 MHz).
To further understand the noise properties at the point of maximum amplification, we drove the transmon at a resonant three-photon pump frequency. We then measured the inelastic (incoherent) spectrum of spontaneous emission at frequencies near the maximum amplification point using the experimental setup shown in Supplementary Information Fig. 1b, with a resolution bandwidth of 910 kHz. We also measured this spectrum with the pump turned off. The power spectral density (PSD), normalized to a single photon energy quantum, shown in red on the left y-axis in Fig. 3b, is obtained by subtracting the pump-off from the pump-on spectral curve and calibrating the absolute power (see Supplementary Information Note 8). The inelastic (incoherent) spectrum reveals a peak due to the finite population of excited states among the dressed states.
The PSD quantifies the intensity of the noise at the frequency of the maximum amplification point produced by the spontaneous emission. Since PSD can be directly converted to a noise temperature TN, we determined the noise temperature of the amplification from this data. The resulting curve (blue, right y-axis) in Fig. 3b corresponds to the horizontal linecut from Supplementary Information Fig. 11a, b at Ppump = −96.5 dBm (see Supplementary Information Note 8 for details) and shows good agreement with the numerical simulation. We summarize the peaks of gain, noise, and quantum-limited noise in the cases without and with interference in Table 2, suggesting that nearly quantum-limited microwave amplification is achieved by interfering with degenerate stimulated emission in a single artificial atom.
The observed linewidth Γ/2π in Figs. 2c and 3b is due to the minimal effect of pure dephasing (2γ ≃ Γ, where γ is the decoherence rate and Γ is the linewidth of the dressed state at the crossing point). Figure 2c shows the measurements conducted using a vector network analyzer (VNA) employing two fields (pump and probe), which primarily explore elastic (coherent) scattering of the probe, aiming at measuring stimulated emission among dressed states. In contrast, Fig. 3b shows the measurement of spontaneous emission with a spectrum analyzer (SA) utilizing a single RF source as a pump field. This configuration captures the spontaneous emission of the atom, directly related to inelastic (incoherent) scattering6. The use of both instruments enabled the exploration of different quantum processes occurring among the dressed states.
In conclusion, we investigated the amplification of a weak probe field by a single artificial atom at the end of a semi-infinite transmission line due to multi-photon excitations in dressed states induced by a strong pump field. The reflectance of the weak probe displayed multiple Rabi sidebands, which were either amplified or attenuated. We observed a particularly strong amplification when two amplified Rabi sidebands crossed, leading to constructive interference between the emitted photons. In one such case, we observed a power amplification of 1.402 ± 0.025. About half of the excess gain there can be attributed to quantum interference. We found, by analyzing the spectrum of spontaneous emission, that the added noise of the amplification process was nearly quantum-limited at 0.157 ± 0.003 quanta; the quantum limit was 0.143 ± 0.006 quanta for this level of amplification. We thus demonstrated that nearly quantum-limited microwave amplification can be achieved by interferingwith degenerate stimulated emission in a single artificial atom.
Methods
System dynamics and calculation of reflectance
The dynamics of an artificial atom at the end of a semi-infinite transmission line under a multi-photon drive can be described by the Born–Markov quantum master equation24,27,28,29,
where the system Hamiltonian is given by
with
Here, ({sigma }_{n,n}=leftvert nrightrangle leftlangle nrightvert) is the projection operator for the nth energy level with atomic energy ℏωn and ({sigma }_{n,n-1}=leftvert nrightrangle leftlangle n-1rightvert) is the atomic ladder operator between the nth and (n−1)th level of the transmon. The Rabi frequency and the carrier frequency of the pump (probe) field are denoted by Ωpump (Ωp) and ωpump (ωp), respectively. The pump frequency ωpump for N-photon pumping is obtained by dividing the relevant transition frequency by N. For instance, in the cases N = 2, 3, and 4, the pump frequencies are ω20/2, ω30/3, and ω40/4, respectively. Here, ω20, ω30, and ω40 are the transition frequencies for the (leftvert 0rightrangle leftrightarrow leftvert 2rightrangle ,leftvert 0rightrangle leftrightarrow leftvert 3rightrangle), and (leftvert 0rightrangle leftrightarrow leftvert 4rightrangle) transitions, respectively (see Fig. 1a in the main text). The Lindblad superoperator is defined as ({mathcal{D}}left[A,Bright]rho =Brho A-frac{1}{2}ABrho -frac{1}{2}rho AB). The relaxation rate from the level (leftvert nrightrangle) to (leftvert n-1rightrangle) is given by Γn,n−1. The last term in Eq. (2) is added to account for the pure dephasing process with the dephasing rate ({Gamma }_{n}^{phi }) for the nth level. Finally, H.c. stands for Hermitian conjugate.
The reflectance is determined by (| r{| }^{2}={leftvert frac{leftlangle {a}_{{rm{out}}}rightrangle }{leftlangle {a}_{{rm{in}}}rightrangle }rightvert }^{2}), where the output and input signals are the output annihilation operator aout and the input annihilation operator ain, respectively30. The output signal can be determined from the input signal and the atomic response via the input–output relation31
In our setup, we apply a single-mode classical probe field as an input signal. Then, the input operator can be approximated by a classical field32,33:
Hence, the reflectance due to the weak probe beam is given by
Note that we limited the number of energy levels to M = 6, considering the population in the state (leftvert 5rightrangle) to be negligible. In numerical calculations, we thus considered the sum of five atomic transitions (leftlangle {sigma }_{n-1,n}rightrangle) for n = 1, 2, …, 5.


Responses