Network pharmacology study on the mechanism of berberine in Alzheimer’s disease model

Introduction
Alzheimer’s disease (AD) is a most frequent and slowly developing neurodegenerative disease characterized by progressive cognitive impairment and memory decline. According to the report by the International Alzheimer’s Association, there are 44 million people affected with AD worldwide till now. The estimated number of new AD cases will be ~135 million by 20501,2. The main pathological features of Alzheimer’s disease (AD) are amyloid plaques and neurofibrillary tangles, reactive gliosis, neuroinflammation, and synaptic and neuronal dysfunction3. The activation of microglia and astrocytes is an important pathological feature of AD and releases cytokines, chemokines, and other molecules to participate in immune and inflammatory responses4. Currently, effective treatment for AD is lacking and it is urgent to explore its pathogenesis and treatment strategies. For this, natural plant extracts have received increasing attention and research indicated that many components isolated from herbs in traditional Chinese medicine have good therapeutic effects on AD with little side effect5,6. For example, Ginkgo biloba extract EGB761 improved the cognitive function and mental state of AD patients7. Tanshinone8 and Baicalin9 extracted from herbs have also been proven to have certain therapeutic effects on AD. Therefore, a natural product derived from traditional Chinese medicine is a potential alternative prevention and treatment for AD.
As an important natural alkaloid, berberine (BBR, C20H18NO4+) could be extracted from the roots, barks, leaves, rhizomes, twigs, and stem from several herbs used in traditional Chinese medicine, including Coptis chinensis, Coptis rhizome, Berberis aristata, Berberis vulgaris, etc.10. BBR has been used clinically in China and the USA for decades, and is widely applied to treat diarrhea and gastroenteritis11, cardiovascular disease12, and neurodegenerative diseases13 including AD10,14. The studies suggested that berberine significantly reduced amyloid accumulation and improved cognitive impairment in APP/PS1 mice15. Berberine exerted protective effects on AD animals via anti-oxidative stress, anti-neuroinflammation, inhibition of neuronal cell apoptosis, etc.14,16,17. Notably, BBR was found to be metabolized to dihydro-berberine by intestinal bacteria, whose bioavailability was five times higher than that of BBR18. Based on the criteria of The traditional Chinese medicine systems pharmacology database and analysis platform (TCMSP): oral bioavailability (OB, >30%), drug-likeness (DL, >0.18), and blood-brain barrier (BBB, >0.3)19, BBR has OB 36.8%, DL 0.78, and BBB 0.57 and therefore could be considered as a potential candidate drug.
Network pharmacology integrates bioinformatics and network analysis with various databases to map the relationships between drugs, genes, proteins, and diseases to identify drug targets and novel therapeutic interventions for the disease. It has been widely applied in the research field of traditional Chinese medicine and predicts the potential mechanism underlying the therapeutic effect of drugs. However, the application of network pharmacology in exploring the effect of BBR on AD was limited. In this study, we applied network pharmacology study to predict the key potential target genes of BBR in AD treatment and their underlying molecular mechanism in 5×FAD mice, a model of AD.
Results
Acquisition of BBR target genes
The molecular structure of berberine (BBR, C20H18NO4+, MW: 336) was retrieved from the Pubchem website (https://www.pubchem.ncbi.nlm.nih.gov) and shown in Fig. 1A. Four databases: SwissTargetPrediction, CTD, BindingDB (http://bindingdb.org) and TargetNet was applied to screen the related target genes of BBR (berberine). The name of target genes was united to the same format following the UniProt database (https://www.uniprot.org/uploadlists) and total 423 target genes of BBR were obtained (Fig. 1B, supplemental material 1). These target genes were then processed with GO (Gene Ontology) and DO (Disease Ontology) functional annotation analysis through the DAVID database (https://david.ncifc.RF.gov), which integrated biological data and analysis tools to annotate gene and protein information. In GO analysis, there were top 10 biological processes (BP), cellular components (CC), and molecular functions (MF) of the 423 BBR related target genes listed in Fig. 1C. BBR was primarily response to xenobiotic stimulus, nutrient levels, MARK cascade, and oxidative stress in the BP of targets. The main CC were nucleosome, chromatin, and vesicle transport, while MF showed that BBR mainly participated in molecular functions of protein heterodimerization activity, transcription factor binding, serine, and threonine kinase activity (Fig. 1C). DO analysis showed that BBR was associated with certain diseases including breast cancer, gastric cancer, peripheral neuropathy, hepatitis, etc. (Fig. 1D). These analyses indicated that BBR target genes were associated with biological processes related to various diseases, including neurological disorders.

A Molecular structure of BBR. B All relevant target genes were retrieved from the indicated four drug-related target websites and Venn diagram was demonstrated. C Gene Ontology analysis for all BBR target genes. D Disease Ontology analysis for all BBR target genes.
Acquisition of AD gene cluster from GEO dataset
To identify whether the BBR target genes were associated with AD therapeutic application, the dataset GSE5281 including 10 AD patients and 13 control samples was initially retrieved from the GEO database (http://www.ncbi.nlm.nih.gov/geo) (Fig. 2A). The differential expression gene between AD and control was obtained after data cleaning and integration and displayed in a volcano plot (Fig. 2B). The GESA was further applied to explore potential biological processes and pathways involved in the pathogenesis of AD. The top five most significant upregulated and downregulated pathways were shown in Fig. 2C with GESA analysis. The significant upregulated included the Notch signaling pathway, and related pathways in cancer, and the downregulated included TCA cycle and pentose phosphate cycle pathways (Fig. 2C). WGCNA constructs a gene co-expression network by calculating the correlation between genes, and clusters highly correlated genes into co-expression modules through clustering algorithms. We conducted WGCNA of the dataset GSE5281, obtained 17 modules and selected the most significant MEdarkgrey module (±0.87, 5e−8) as the key gene module for AD (Fig. 2D). The gene correlation analysis showed that this module had a significant correlation with AD genes (Fig. 2E). We next performed an intersection analysis between the key module gene cluster from WGCNA and the original gene dataset of AD screened through DIFF (Differential Expression Analysis) with significant expression (p < 0.05). Through this intersection analysis, 300 genes were selected as the AD-related gene cluster (Fig. 2F) for the following analysis.
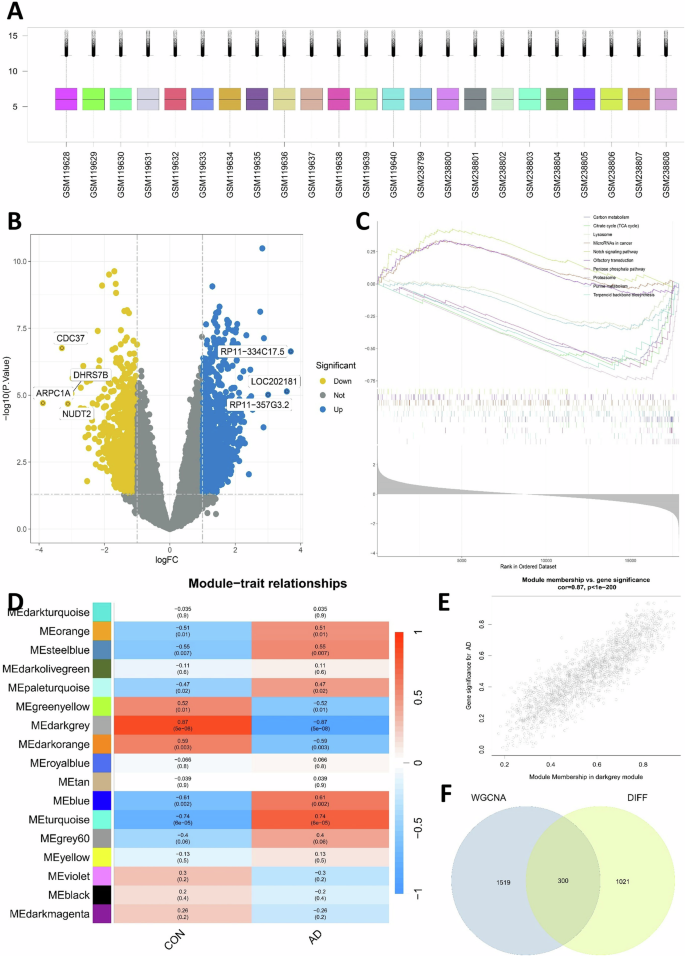
A The human hippocampal transcriptome data selected from the GEO database included 13 normal samples and 10 AD samples as indicated. B Volcano map of differential expression genes (DEG) between the AD patients vs control dataset. C Transcriptomic GSEA analysis yielded upregulated and downregulated pathways. D Differential gene expression modules of AD obtained by WGCNA analysis. E Assessing the relationship between MEdarkgrey module membership and significant genes in AD. F Intersection analysis between key module gene clusters screened from WGCNA and original transcriptome data of AD screened by DIFF (p < 0.05) and the intersection gene served as the final AD-related gene cluster.
Screening BBR target gene for AD therapy and their PPI analysis
The intersection analysis between BBR target genes and AD-related gene clusters was conducted and only four target genes (APP, PPARG, TOP1, TLR9; Fig. 3A) were included. These genes were both associated with BBR targeted genes and AD-related gene clusters and therefore considered as potential target genes in BBR mediated AD therapy. To screen the key subgroup genes, all combined genes of these two datasets were processed for intersection analysis of protein–protein interactions (PPI) in the STRING (https://string-db.org/) website and the network was constructed and visualized with Cytoscape software. MCODE analysis in Cytoscape can detect closely related proteins or dense regions of protein interaction networks. By this MCODE analysis of the PPI network, the most relevant subgroup genes were identified in this study and there only two genes APP and PPARG were included (Fig. 3B). GO analysis for all these relevant subgroup genes showed that the biological process (BP) was mainly involved in gland development, muscle cell proliferation. The main cellular components (CC) were membrane raft, membrane micro-domain and transcription regulator complex, while molecular function (MF) showed that BBR mainly participates in molecular functions of transcription factor binding and transcription activity (Fig. 3C). Subgroup genes of DO analysis indicated that they were associated with diseases such as kidney cancer, hepatitis, and benign neoplasm (Fig. 3D). The Receiver Operating Characteristic (ROC) curve was employed to evaluate the performance of the selected two target genes on AD. The area under the curve (AUC) under the ROC curve of APP (AUC = 0.923; Fig. 3E) and PPAPG (AUC = 0.80; Fig. 3F) were analyzed and both values were excellent (>0.8). We further evaluated the differential expression genes of these key subgroup genes and the results showed APP and PPARG were significantly differentially expressed between the control and AD (Fig. 3G). Through these network pharmacology analyses, we screened two genes APP and PPAPG, which were potential BBR target genes for AD therapy.
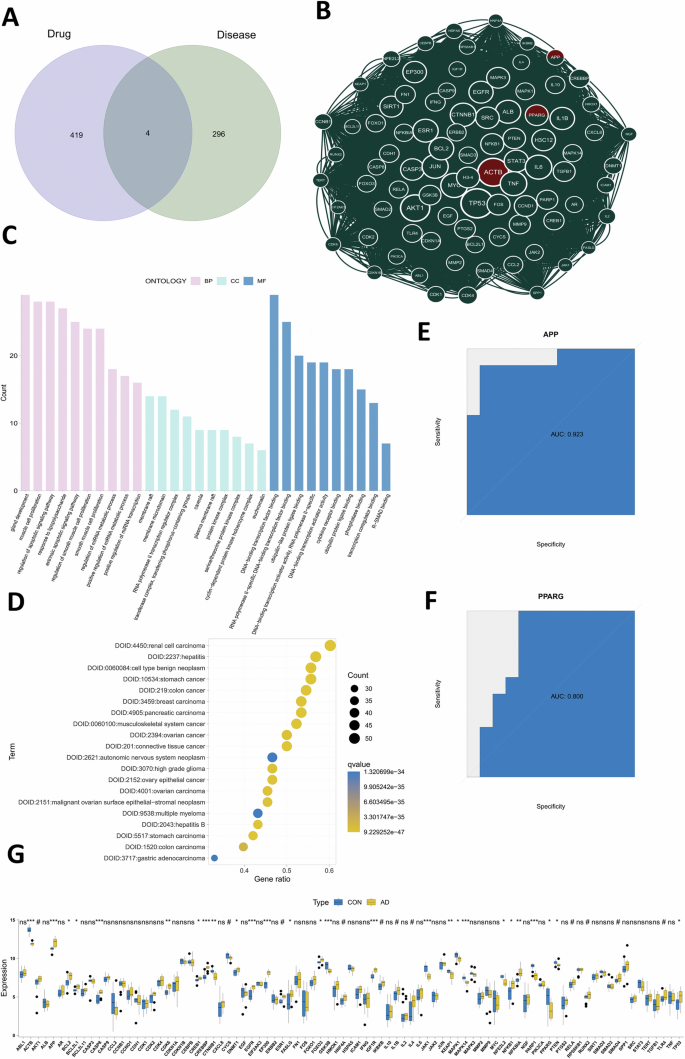
A The intersection analysis of BBR related target genes and AD-related differential genes was performed. B MCODE analysis on the total PPI network was performed to screen out the most relevant subsets of genes. C Gene Ontology analysis on the most relevant subsets of genes. D Disease Ontology analysis on the most relevant subsets of genes. E, F The reliability of target genes APP (E) and PPARG (F) were evaluated by ROC analysis. G Difference analysis of the key subgroup genes from the most relevant subsets of genes.
Single-cell RNA sequencing data for predicting BBR target cell types
To further explore the potential cellular mechanism for BBR targeted AD therapy, we analyzed the human included-hippocampal single-cell RNA sequencing dataset GSE175814 from the GEO database, which included the dataset from two AD patients and two normal human tissues. The single-cell dataset was processed with R software to acquire the number of genes detected in each cell (nFeature-RNA), the sum of all gene expression levels detected in each cell (nCount-RNA), the percentage of the mitochondria (percent.mt) and ribosomal gene (percent.rb) (Fig. 4A). Correlation analysis indicated that nCount-RNA was strongly positively correlated with nFeature-RNA in the cells, but not correlated with the percentage of the ribosomal gene (percent. Rb) (Fig. 4B). To further identify cell types and cluster cell subgroup, the ΜMAP (Uniform Manipulation and Projection) was employed to reduce dimensionality and classify cells visually. After ΜMAP analysis, four cell types (astrocytes, macrophages, endothelial cells, and smooth muscle cells) were obtained (Fig. 4C). After intersecting the key subgroup genes with the single-cell dataset, we found that BBR was mainly expressed in astrocytes and macrophages (Fig. 4D). Combining the pathological features of AD, we focused on analyzing microglia, which were resident macrophages, and astrocytes in the brain. The differential genes of each cell type were screened by single-cell data analysis (screening criteria: min.pct = 0.25, LogFc threshold = 0.25). The intersection analysis of these genes with the key subgroup genes was then performed and the expression differences of all intersection genes in different cell types were shown by heat map (Fig. 4E). This joint analysis of key subgroup genes and single-cell RNA Seq data determined microglia and astrocytes as the key BBR targeted cell types for AD therapy.
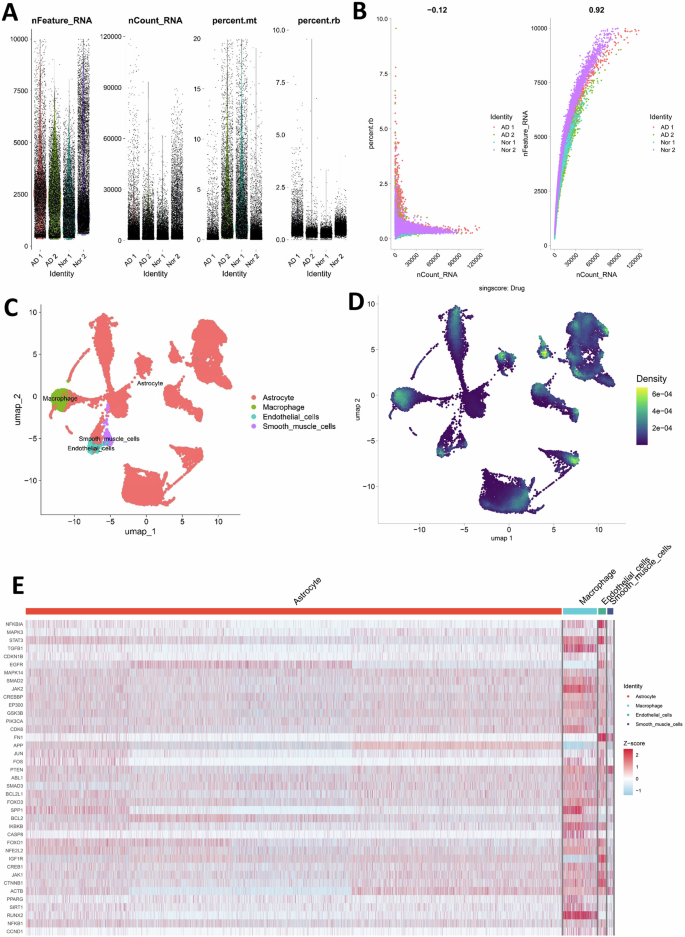
A The original single-cell data included the total number of genes detected in each cell (nFeature_RNA), total gene expression (nCount_RNA), the percentage of the mitochondria (percent.mt) and ribosomal gene (percent.rb). B The number of genes (nFeature_RNA) was strongly positively correlated with the total gene expression (nCount_RNA) but not with the ribosomal gene (rb) detected in each cell. C, D The cell clusters category and the target cell distribution of berberine were determined by single-cell RNA sequencing analysis. E Differential expression of the key subgroup genes in four cell types previously screened by single-cell data analysis.
Molecular docking analysis between BBR and APP or PPARG
Molecular docking analysis via the mcule website (https://mcule.com) was conducted to predict the molecular interactions between BBR and its two targeted proteins APP and PPARG. We predicted the molecular docking models of BBR with APP (Fig. 5A) and PPARG (Fig. 5B) from the two-dimensional and three-dimensional display of the protein’s tertiary structure and molecular docking positions. It showed BBR forms binding interaction with Val-551, 553, 618, Leu-674, and Ser-675 in APP protein APP (PDB: 3DXC) with the docking score −6.9 kcal/mol (Fig. 5A). BBR also forms interaction with various residual amino acids in PPARG (PDB:1i7i) the docking score −7.5 kcal/mol (Fig. 5B). More negative value of the docking score indicated the stronger binding capacity and both docking scores of APP and PPARG were considered satisfied and revealed the patterns of potential interaction between BBR and APP or PPARG.
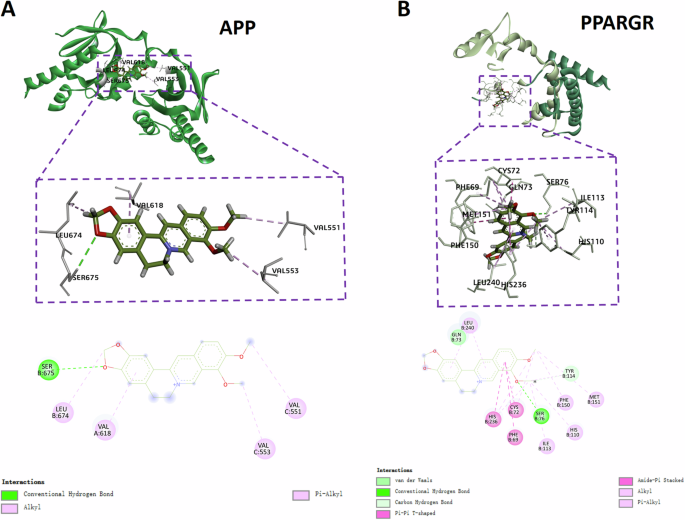
A The 2D and 3D intermolecular contact between BBR and APP. B The 2D and 3D intermolecular contact between BBR and PPARG.
BBR promoted cell viability and regulated APP and PPARG at mRNA and protein level
Based on single-cell data, microglia and astrocytes were predicted as the key BBR-targeted cell types for AD therapy and we further validated the effect of BBR on corresponding mouse microglial cell lines (BV2) and astrocytic cell lines (C8-D1A). After BV2 and C8-D1A were treated with 5 gradients of BBR concentrations (0, 0.5, 1, 2, 4, 8 μm) for 24 h and 48 h, CCK-8 assay was performed to examine the effect of BBR on cell viability. The results indicated that the cell viability of BV2 was significantly increased at 24 h (Fig. 6A) and 48 h (Fig. 6B) after BBR treatment and the effect dose was 2–4 μM. There was no effect on C8-D1A with BBR treatment for 24 h (Fig. 6C) but it was effective for 48 h (Fig. 6D). These data showed that the appropriate concentration (2–4 μM) of BBR treatment promoted cell viability of BV2 and C8-D1A and played a protective role. RT-qPCR was performed to verify the effect of BBR on its two target APP and PPARG in the cells. Presenilin 1 (PS1) was secretase for APP processing and the NF-κB pathway (p65) was a key target of PPARG. The results showed a significant decrease in the relative mRNA expression levels of APP (Fig. 6E) and PS1 (Fig. 6F) in BBR-treated BV2. Oppositely, the relative mRNA expression level of PARG (Fig. 6G) was decreased in BBR-treated BV2, accompanied by a decrease in the relative mRNA expression level of p65 (Fig. 6H), a key component in the inflammatory NF-κB pathway. The qPCR results in C8-D1A were similar to those in BV2 (Fig. 6I–L). These qPCR results demonstrated that BBR treatment decreased the mRNA level of APP and PS1, and increased PPARG mRNA with decreased p65 mRNA in both BV2 and C8-D1A. Western blotting was applied to further investigate the protein expression of APP and PPARG in BV2 and C8-D1A mediated by BBR. The data showed that the protein level of APP and PS1 was decreased in BBR treated BV2, while BBR increased the protein level of PPARG and decreased the NF-κB pathway (p65, p-p65, IKBα, and p-IKBα), especially p-p65 and p-IKBα, consisting with that it was negatively regulated by PPARG (Fig. 7A, B). For the same situation as BV2, the C8-D1A shows similar results (Fig. 7C, D). Besides the mRNA level, these results indicated that BBR downregulated the expression of APP and PS1 protein while upregulated PPARG with decreasing its downstream NF-ΚB pathway. In summary, BBR treatment on BV2 and C8-D1A decreased the APP and PS1 while increased the PPARG with decreased NF-κB pathway at mRNA and protein levels.
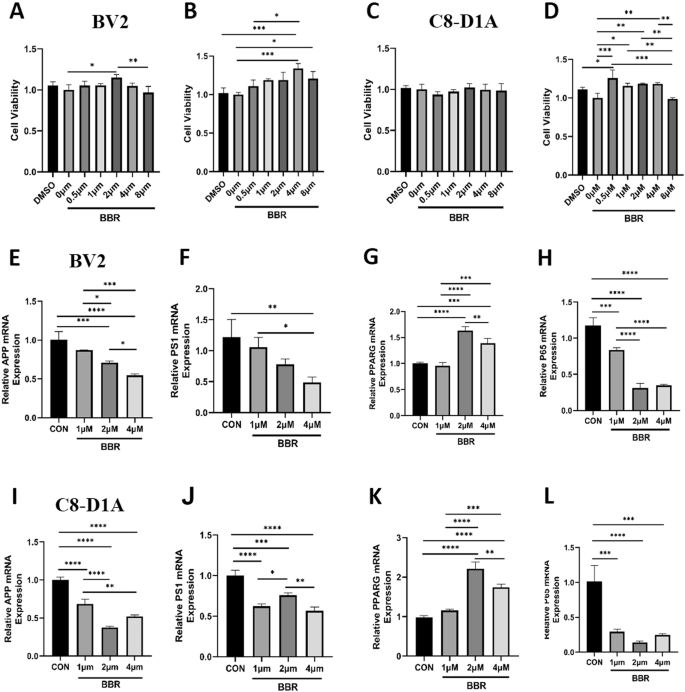
A, B BV2 was treated with different concentrations of BBR for 24 h (A) and 48 h (B) and cell viability was detected by CCK-8 assay. C, D C8-D1A was treated with different concentrations of BBR for 24 h (C) and 48 h (D) and cell viability was detected by CCK-8 assay. E–H The relative mRNA expression of APP (E), PS1 (F), PPARG (G), and p65 (H) was detected by qPCR in BV2 treated with different BBR concentrations. I–L The relative mRNA expression of APP (I), PS1 (J), PPARG (K), and p65 (L) was detected by qPCR in C8-D1A cells treated with different BBR concentrations. n = 3.
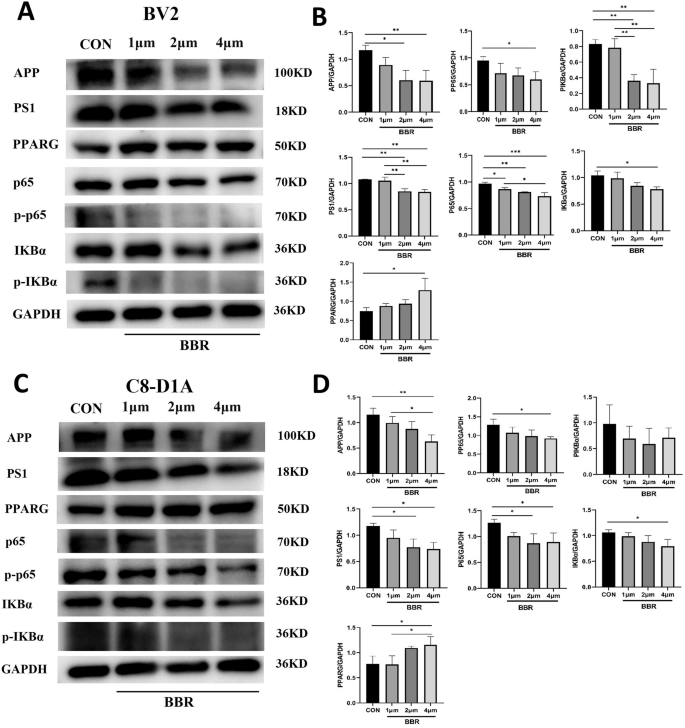
A BV2 was treated with 1, 2, and 4 μM BBR for 24 h and was processed to WB with indicated antibodies. B The corresponding statistical results were shown. C C8-D1A was treated with 1, 2, and 4 μM BBR for 24 h and was processed to WB with indicated antibodies. D The corresponding statistical results were shown. n = 3.
BBR ameliorated the behavior activity of 5×FAD mice
Based on the above in vitro experiment, we conducted animal experiments (in vivo) to further validate the potential therapeutic effect of BBR on 5XFAD mice, an animal AD model. The 5×FAD was treated with 200 mg/kg/day BBR for 8 weeks and then their behavior was examined with open field, novel object recognition (NOR), and Morris water maze test (Fig. 8A). The results indicated that the BBR group significantly increased the distance (Fig. 8B) and time (Fig. 8C) in the center zone in open field test compared to the control group. The novel object recognition test showed that the BBR group had a significant increase in recognition index (Fig. 8D) but was not different in time spent on new objects (Fig. 8E) compared to the control group. The Morris water maze examination indicated that the BBR group had a trend of improvement in escape latency compared to the control although it did not reach a significant difference (Fig. 8F). The number of times crossing the platform also showed a certain improvement trend in BBR group (Fig. 8G). In summary, these results show that BBR treated 5×FAD mice ameliorated their behavior activity including in locomotor activity and cognitive function compared to control.
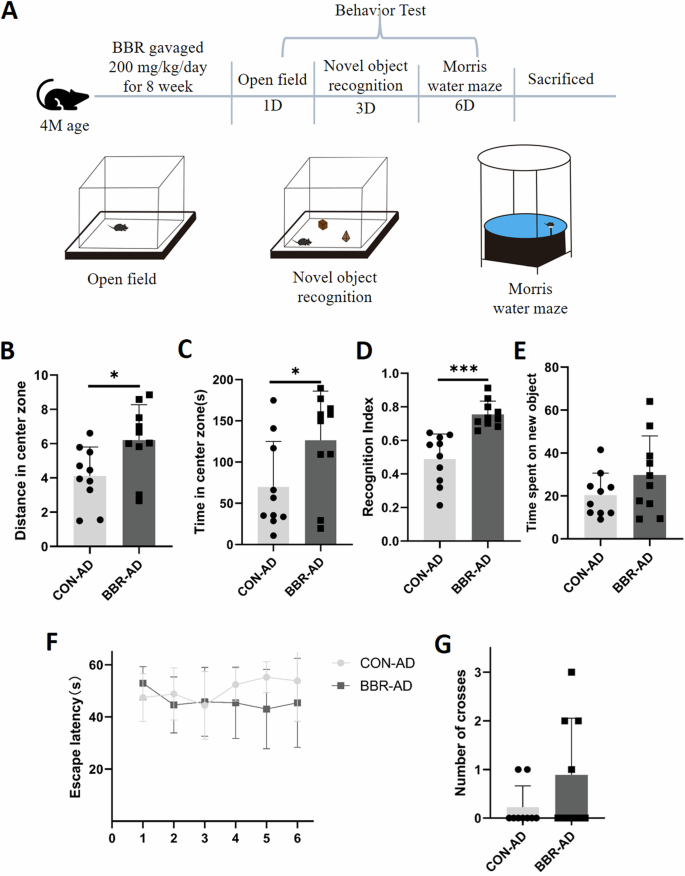
A Schematic diagram of experimental design for animal experiments. B, C Experimental statistical analysis of the distance (B) and time (C) in the center zone in an open field test for the control and BBR groups. D, E Experimental statistical analysis of recognition index (D) and spend time in new object (E) in Novel object recognition test for the control and BBR groups. F, G Experimental statistical analysis of escape latency (F) and crossing number (G) in Morris water maze test for the control and BBR groups. n = 10.
BBR regulated the APP and PPAG and decreased amyloid plaques and neuroinflammation in 5×FAD
To verify the effect of BBR on the protein expression of the target APP and PPARG in 5×FAD, their hippocampal tissues were extracted and processed for WB experiments. The data showed a significant decrease in APP and PS1 in 5×FAD mice after BBR administration. Comparably, BBR administration increased the protein expression of PPARG, accompanied by a significant decrease in the NF-κB pathway (p65, p-p65, IKBα, and p-IKBα), consistent with that BBR played a role in repressing inflammatory response through PPARG-medicated inhibition of its downstream NF-κB pathway (Fig. 9A, B). We further conducted immunohistochemical experiments to examine the effect of the BBR on the protein expression of its target APP and PPARG in 5×FAD mice. The results showed that there was a decrease in the immunostaining intensity of APP in the 5×FAD mice treated with BBR (Fig. 9C, D). The expression of PPARG was shown to be significantly increased after BBR treatment (Fig. 9E, F). To further investigate whether decreased APP was associated with amyloid plaque formation and the increased PPARG associated with inhibition of neuroinflammation in 5×FAD, immunofluorescent assay with 6E10 antibody for amyloid plaques, Iba1 for microglia and GFAP for astrocytes were performed (Fig. 9A–D). It showed that BBR administration in 5×FAD reduced the 6E10 positive amyloid plaque (Fig. 9A, D) and decreased the microglial (Fig. 10B, D) and astrocytic reactivity (Fig. 9C, D). These data supported that BBR administration decreased APP and increased PPARG were associated with reduced amyloid plaque formation and glia reactivity/neuroinflammation in 5×FAD, respectively.
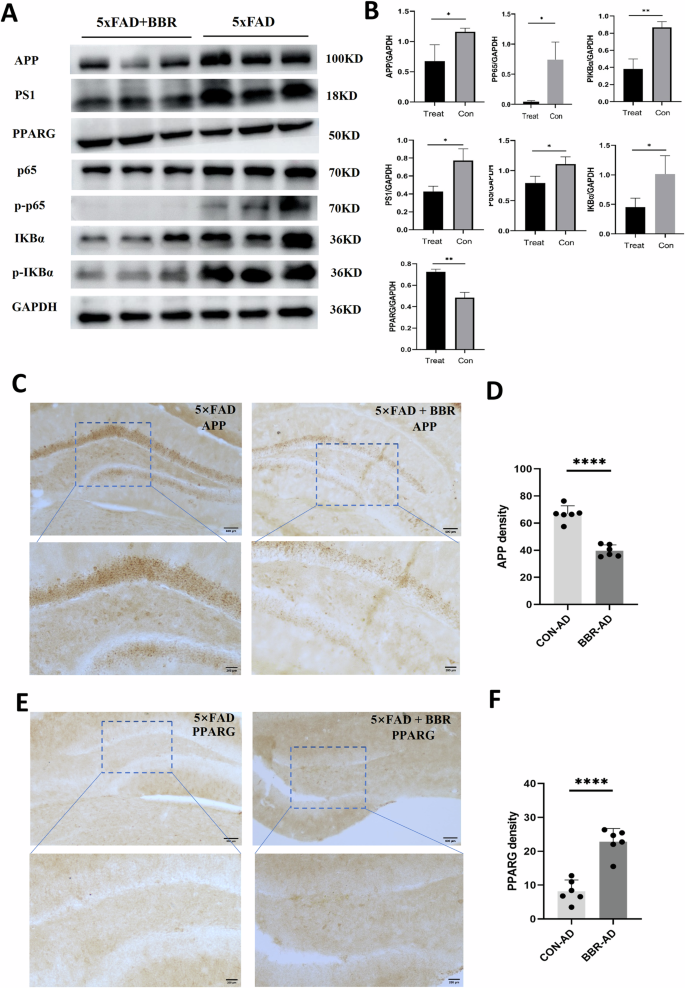
A 5×FAD mice were administrated with NS and BBR for 8 weeks and the hippocampus tissues of mice were extracted and processed to WB assay with indicated antibodies. B Statistical results for the experiment in (A). n = 3. C–F 5×FAD mice were administrated with NS and BBR for 8 weeks and processed to immunohistochemistry with anti-APP (C) and PPARG antibodies (E). Statistical results for immunostaining intensity of APP (D) and PPARG (F) immunostaining. n = 3 (WB). n = 6 (IHC).
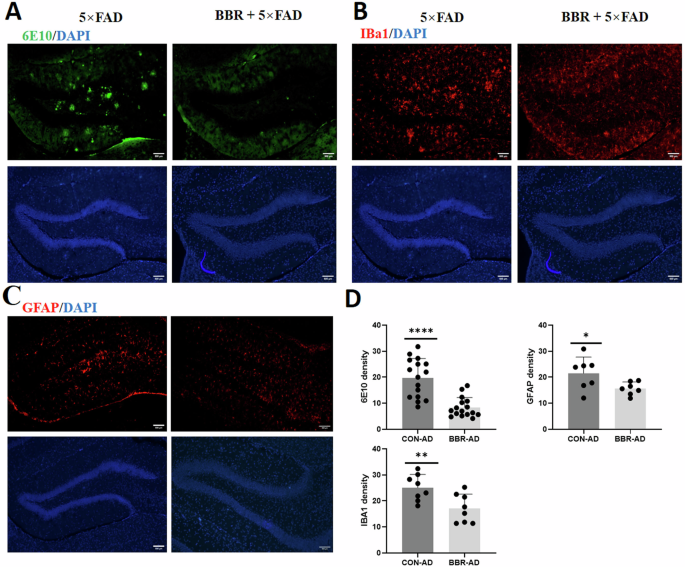
5×FAD mice were administrated with NS and BBR for 8 weeks and processed to immunofluorescence assay with anti-6E10 antibody for amyloid plagues (A), anti-Iba1 antibody for microglia (B), and anti-GFAP antibody for astrocytes (C). D Statistical results for the fluorescent intensity of all three immunostaining. n = 6.
Discussion
In this study, two main potential target genes APP and PPARG of BBR for AD therapy were screened out via network pharmacology and molecular docking. The experimental results validated that BBR treatment resulted in decreased APP and presenilin 1, while increased PPARG, accompanied by decreased expression of NF-κB pathway at both mRNA and protein levels in in vitro and in vivo AD models. Our data elucidated that BBR played a protective role in the AD model mice via reducing APP processing and amyloid plaque formation and promoting PPARG-mediated repression of the NF-κB pathway, inflammatory response, and glia reactivity.
BBR is a natural plant compound and has a wide range of pharmacological activities, including antibacterial, anti-inflammatory, anti-tumor, and anti-diabetes effects. Amounting evidence showed that BBR exerted therapeutic effects on AD through multiple pathways20. For example, BBR treatment inhibited PERK/eIF2α signaling-mediated BACE1 translation and reduced the Aβ production and the pathological progression of AD16. BBR also inhibits AD pathogenesis by regulating oxidative stress and antioxidant responses. BBR enhanced cellular antioxidant capacity, regulated antioxidant-related pathways such as Nrf2 and HO-1, and thereby reduced oxidative stress damage21,22. Studies also showed that BBR ameliorated LPS-induced cognitive deficits in the AD model via suppression of inflammatory products, neuroinflammation, and cell damage23. In this study, two main potential target genes APP and PPARG of BBR for AD therapy were screened out via network pharmacology and molecular docking.
APP is a large transmembrane precursor protein and the abnormal degradation of APP is proteolyzed by β-secretase (β-APP-cleaving enzyme-1, BACE1) and γ-secretase to generate amyloid-β (Aβ) peptides, which aggregate and form beta-amyloid plaques, the key feature of AD24. Rare APP mutations generally increase total Aβ levels and the Aβ42/Aβ40 ratio, which are the key contributors to familial Alzheimer’s disease25. Aβ, Aβ oligomers fibrils led to synapse dysfunction, neuronal death, and decline in cognitive function26. This study indicated that BBR reduced APP expression and was linked to decreased amyloid plaque formation, consequently ameliorating the pathological process and behavior activity of AD (Fig. 11). APP is mainly distributed in the synapses of neurons in the brain and Aβ peptide was produced from APP proteolysis by β-secretase and γ-secretase complex. Monomer Aβ underwent structural changes to generate soluble oligomers and finally formed fibrils that accumulated in amyloid plaques, which is the AD neuropathological hallmark. The Aβ and oligomer can form a cyclic structure on the membrane and damage cellular membrane integrity leading to neuronal damage and memory dysfunction in AD15,20. Solid evidence supported that an increased level of APP expression was strongly associated with Alzheimer’s disease (AD) pathogenesis. For example, Down syndrome (trisomy of chromosome 21) possessed 3 copies of the APP gene and developed progressive AD with typically neuropathological features27. Antisense oligonucleotides (ASOs) targeting APP are an effective approach to reduce APP protein levels and subsequently decrease intracellular and extracellular Aβ-containing aggregate, rescue the dysfunctional neurons, and AD pathogenesis27. A recent study shows that brain-wide Cas9-mediated cleavage of APP alleviated pathologies in 5×FAD mice24. Consistently, this study showed that BBR decreased APP in 5×FAD also ameliorated their amyloid plaques and behavior activity.
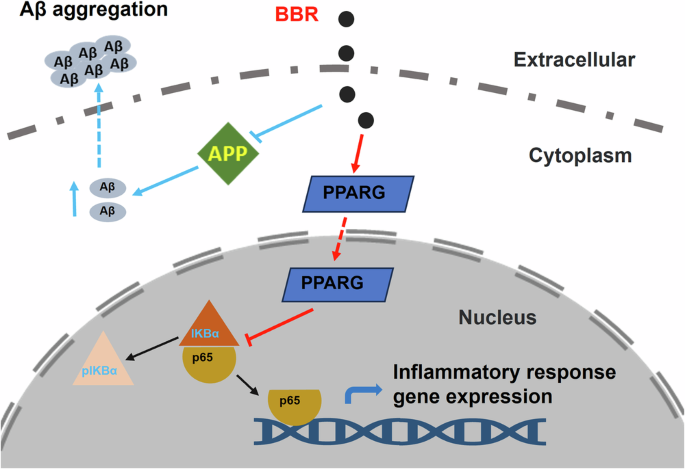
BBR reduced APP level and blocked amyloid plaque formation. BBR also promoted PPARG-mediated repression of the NF-κB pathway and inhibited inflammatory response.
PPARG is a nuclear receptor, a family of transcription factors, expressed in different tissues including the brain. PPARG activation is involved in lipid metabolism, mitochondrial function, oxidative stress, and inflammatory responses in the central nervous system (CNS). PPARG interacts with inflammation-related transcriptional factors such as NF-κB and AP-1 and represses their target inflammatory gene transcription. Therefore, PPARG plays an anti-inflammatory role and protects neuronal function28. Inflammation was another key contributor to neurodegeneration and memory impairment in AD4. Aβ and oligomers triggered the activation of glial cells in the AD brain, which secreted pro-inflammatory cytokines such as IL-6, TNF-α, NF-κB, and other neurotoxic substances, which collectively led to neuroinflammation and neurotoxicity29. Another target gene, PPARs, were nuclear receptors belonging to a family of transcription factors. When activated, PPARs form heterodimers with retinoid X receptor (RXR), which repress target gene transcription, including NF-κB and AP-1, thereby reducing inflammation and playing a protective role in the brain30,31. Our study provides evidence that BBR prevented AD pathogenesis by blocking the inflammatory response via PPARG-mediated repression of the NF-κB pathway (Fig. 11). Latest preclinical and clinical studies supported that PPAR agonists offered therapeutic outcomes for the treatment of neuroinflammatory diseases including AD30.
Currently, the network pharmacology study played an important role in drug research and discovery. Through comprehensive analysis and integration of multiple data sources, network pharmacology can unveil the mechanism of action, targets, and related biological pathways of drugs. In recent years, studies with network pharmacology have shown that BBR has potential effects on the treatment of AD32. A recent study indicated that ALB, EGFR, CASP3, and five targets in the PI3K-AKT signaling pathway were screened out via network pharmacology in BBR treatment on AD. Western blotting verified that BBR significantly increased the phosphorylation levels of AKT and ERK, which mediated the therapeutic effects of BBR in AD mice. Another study based on network pharmacology showed that Akt1, Ctnnb1, Tp53, and Jun were involved in the neuroprotective actions of berberine which improved learning and memory in mice with cognitive impairment by D-gal induction. Consistently, our study employing network pharmacology elucidated the role of Amyloid products and inflammation in AD pathogenesis. These studies supported that network pharmacology can serve as a valid tool for exploring the therapeutic effects and potential mechanisms of BBR against AD. Molecular docking analysis is a computational method used to predict the preferred orientation of a small molecule (ligand) when bound to a protein (receptor). In this study, molecular docking was applied to analyze the interaction of BBR with APP and PPARG and the results indicated that BBR displayed high binding energy (−6.9 and −7.5 kcal/mol, respectively) in the APP and PPARG docking. This helped to understand and support the binding affinity between BBR and its target proteins and their potential significance in therapeutic application in AD treatment.
Employing the Network pharmacology study, we screened out two main targets APP and PPARG of BBR on AD treatment and provided the experimental results to validate the effect on the target protein by BBR. However, there were still some limitations in this study. Our research on network pharmacology was mainly based on publicly available databases and literature, which might have data incompleteness and bias. Differences in databases and data quality may lead to discrepancies in results. Therefore, this study of network pharmacology was insufficient to draw reliable conclusions and it was necessary to apply multiple databases to assist in interpreting the results and underlying mechanisms. In future research, more comprehensive datasets and experimental validation were required to enhance the reliability and reproducibility of the results and explore its mechanism of action in depth. To further ensure the comprehensiveness and accuracy of the data, high-quality and large clinical studies were required to evaluate the effectiveness and safety of BBR in AD treatment. The score of molecular docking helped to estimate the binding affinity between a ligand and its target protein and prioritize compounds for further study. However, the computational tools for molecular docking still remain to be inadequate for accurate prediction of binding affinity. The biochemistry assay or physical experiments were required to validate the binding which was void in this study.
Summary, in this study, through theoretical prediction by network pharmacology and molecular docking study for BBR against AD treatment, two mainly potential target genes APP and PPARG were screened out. After experimental verification, we found that BBR t can decrease mRNA and protein expression of APP and presenilin 1 while increasing PPARG and accompanying with the decreased expression of NF-κB pathway in vitro and in vivo. This study demonstrated that BBR played a protective role in the AD mice model by blocking APP processing and amyloid plaque formation and promoting PPARG-mediated blockage of the NF-κB pathway and inflammatory response (Fig. 11). These findings in our study revealed preliminary evidence and mechanistic role of BBR on AD. This also provides new insights into the potential therapeutic targets and applications.
Methods
Network pharmacology analysis
By integrating network pharmacology and GEO database data, the potential target genes of BBR were screened for exploring the molecular mechanism and therapeutic application in AD. A schematic workflow of the network pharmacology analysis in this study is shown in Fig. 12. First, four databases: SwissTargetPrediction33 (https://Swisstargetprediction.ch), CTD34 (https://ctdbase.org), BindingDB35 (http://bindingdb.org), and TargetNet36 (https://targetnet.scbdd.com) were applied to search the related target genes of berberine (BBR) and total 423 BBR target genes were obtained. The dataset GSE5281 was initially retrieved from the GEO database (http://www.ncbi.nlm.nih.gov/geo) and the differential expression gene (DEG) between AD patients and normal individuals (control) was analyzed with the GESA (Gene Set Enrichment Analysis) and WGCNA (Weighted Gene Co-expression Network Analysis). The most significant MEdarkgrey module was selected as the key gene module for AD. Intersection analysis between the key module gene cluster from WGCNA and the original gene dataset of AD screened with DIFF (Differential Expression Analysis) was performed and 300 genes were obtained as the AD-related gene cluster. The intersection analysis was further conducted between BBR target genes and AD-related gene cluster and all genes were filtered by MCODE (Molecular Complex Detection) analysis, then two target genes (APP and PPARG) were screened out as potential BBR targeted genes for AD therapy.
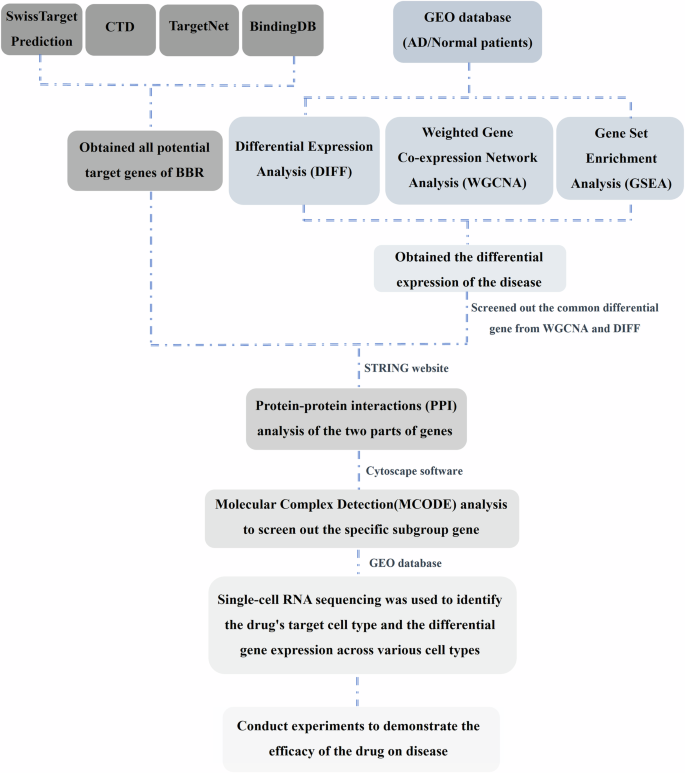
The schematic workflow of the network pharmacology analysis in this study.
Cell culture and BBR treatment
The mouse microglial cell line BV2 (Cat: FH0355) and mouse astrocyte cell line C8-D1A (Cat: FH0837) were both purchased from Shanghai Fuheng Biotechnology Co., Ltd, China. The cells were cultured in DMEM medium supplemented with 10% fetal bovine serum and 1% penicillin/streptomycin in an incubator at 37 °C with 5% carbon dioxide. When the subcultured cells reached 60–70% confluence, BBR (Berberine, Cat: HY-N0716, MedChemExpress, China) was stocked in DMSO, and cells were treated with BBR in different concentrations for different times (24 h and 48 h) as indicated.
CCK-8 assay for cell viability
About 50,000 cells were inoculated into each 96 wells of plates and cultured for 24 h. When cells reached 50–60% confluence, gradient BBR concentrations as indicated (stocked in DMSO) were added to the sample with triple wells and further cultured for 24 h or 48 h. Each well was added with 10 μl of cell count kit-8 (CCK-8, Cat: HY-K0301, MedChemExpress, China) and incubated for 1 h at 37 °C. DMSO group serves as the standard group for normalization. The absorbance of each well was measured at 450 nm in a SpectraMax Mini 96 microplate (Molecular Devices, USA).
Quantitative reverse transcription PCR (qRT-PCR)
Total RNA was extracted using TRIeasy™ total RNA extraction kit from Yeasen Biotechnology (Cat: 10606ES, China) and cDNA was generated using Hifair® reverse transcription reagent kit (Cat: 11141ES, Yeasen, China). Real-time PCR was performed using an SYBR Green PCR kit (Cat: 11185ES, Yeasan, China), and qPCR analysis was then performed with an ABI 7500 Real-time PCR System (Applied Biosystems, Thermo Fisher Scientific, USA). The 2−ΔΔCT method was employed to calculate the relative expression levels of the genes compared to GAPDH. The primers were used as follows:
APP For: TTCGCTGACGGAAACCAAGA
APP Rev: CGTCAACAGGCTCGACTTCA
PS1 For: CATCCGGAGCCAGAATGACA
PS1 Rev: GGGGCCGCCCATTAGATATT
PPARG For: CGGGCTGAGAAGTCACGTT
PPARG Rev: TGTGTCAACCATGGTAATTTCAGT
P65 For: CTCTGGCACAGAAGTTGGGT
P65 Rev: TCCCGGAGTTCATCTCATAGT
GAPDH For: GAAAGCCTGCCGGTGACTAA
GAPDH Rev: GCCCAATACGACCAAATCAGAG
Western blotting
The collected cells or tissue samples were homogenized by sonication in a cold RIPA buffer with protease (Cat: K1007, APExBIO, China) and phosphatase (Cat: K1015, APExBIO, China) inhibitor cocktail. BCA protein assay kit (Cat: ab287853, Abcam, USA) was applied to detect the protein concentration of lysates. After the sample was heated at 100 °C for 10 min, 20 μg proteins were loaded and separated by SDS-PAGE, and the separated pour and then incubated with indicated primary antibodies in 1% BSA-TBST at 4 °C overnight. The membranes were incubated with secondary antibodies and detected using an ECL substrate (Cat: HRD0815, Heruibio, China) to expose the immunoblot signal. The signal was quantified with the NIH ImageJ software. Applied antibodies were listed as follows: Rabbit anti-APP (1:1500, Cat: 25524-1-AP, Proteintech, Wuhan, China); Rabbit anti-p65 (1:5000, Cat: 80979-1-R, Proteintech, Wuhan, China); Rabbit anti-p-p65 (1:5000, Cat: 82335-1-RR 80979-1-R, Proteintech, Wuhan, China); Rabbit anti-PPARG (1:5000, Cat: 16643-1-AP, Proteintech, Wuhan, China); Rabbit anti-GAPDH (1:10,000, Cat: 60004-1-Ig, Proteintech, Wuhan, China); Rabbit anti-PS1 (1:3000, Cat: 16163-1-AP, Proteintech, Wuhan, China); Rabbit anti-IKBα (1:10,000, Cat: 10268-1-AP, Proteintech, Wuhan, China); Rabbit anti-p-IKBα (1:10,000, Cat: 82349-1-RR, Proteintech, Wuhan, China); Goat anti-Rabbit IgG H + L (1:5000, Cat: ab6721, Abcam, USA); Goat anti-Mouse IgG H + L (1:5000, Cat: ab6789, Abcam, USA); Alexa Fluor 594 AffiniPure Donkey Anti-Mouse IgG(H + L) (1:500, Cat: 715-587-003, Jackson ImmunoResearch, USA); Alexa Fluor 488 AffiniPure Donkey Anti-Rabbit IgG(H + L) (1:500, Cat: 711-545-152, Jackson ImmunoResearch, USA).
Experimental animals
Familial Alzheimer’s disease model 5xFAD mice (MMRRC Strain #034848-JAX, C57BL/6J) were sourced from Jackson Laboratory in the United States with five mutant familial Alzheimer’s disease [amyloid precursor protein (K670N/M671L + V717 + I716V) and presenilin 1 (M146L + L286V)]. The animals were housed in groups of no more than five mice per cage. The indoor temperature was controlled at 22–25 °C and humidity at 50–60%. The light/dark cycle lasts for 12 h. The entire experimental process was carried out by the guidelines of the Animal Ethics Committee of Fujian Medical University (Approval No: IACUCFJMU-2024-Y-0565), and the number of experimental animals used and the pain suffered by them was minimized. 24 (12 male and 12 female) 5×FAD mice were randomly divided into the normal saline (NS) and BBR (Berberine, Cat: HY-17577, MedChemExpress, China) treated groups. Each group included 12 mice with the same number of males and females. BBR was dissolved in NS and mice were gavaged with a dose of 200 mg/kg/day in 2 ml NS for 8 weeks referred to the previous study10,37. Next, the groups were labeled blindly and the consequent experiments were carried out by researchers who did not know the treatment. The behavior activity of the mice was tested with an open field test, novel object recognition test, and Morris water maze test. After the behavior test, the mice were anesthetized with 1.25% Avertin (30 μl/g; Sigma-Aldrich, St. Louis, MO, USA) by intraperitoneal injection and perfused transcardially with PBS. The brain samples of 6 mice (3 male and 3 female) in each group were collected and processed for Western blotting. The other mice were perfused with 4% paraformaldehyde and processed for immunostaining.
Open field test
The open field test was applied to examine the exploratory behavior, anxiety-like behavior, and general locomotor activity of mice38. Mice were habituated at the experimental room for 30 min before examination and then placed into the center of an opaque box with a square area (40 × 40 × 40 cm). After mice were left to freely explore for 10 min, the move distance and speed were automatically recorded and collected data was analyzed using ANY-maze video tracking software (Stoelting, CO, USA).
Novel object recognition test
Wooden objects with neutral colors were used for this test and the behavior of mice was recorded by camera. Mice were placed in an opaque box with an open field (40 × 40 × 40 cm) and allowed to explore freely for 10 min without objects on Day 1. On the second day, mice were left to explore freely in the arena with two identical objects with equal positions for 10 min. The recognition test was conducted on the third day with one object replaced by a novel object with a different color and shape. Mice were allowed to explore freely the arena with two different objects for 10 min. Data were automatically recorded and analyzed with ANY-maze video tracking software (Stoelting, CO, USA).
Morris water maze test
The Morris water maze test was performed to examine the spatial learning and memory of mice (10 mice per group) following a previous protocol17. The water maze apparatus consists of a transparent round platform (8 cm in diameter) in the southeast corner of a dark circular pool (1.2 m in diameter and 0.5 m in height). The pool was filled with opaque water at 22 ± 2 °C temperature during the test. Each mouse underwent 4 trials each day during the 5-day training period and the starting point in each trial was different. The mice were placed in the pool for 60 s and left to search the platform. The average value of the total 4 trials was set as the escape latency time. The probe trial was performed on day 6 and the platform was removed. Each mouse was given 60 s to explore the pool and the swimming performance was recorded and analyzed with ANY-maze video tracking software (Stoelting, CO, USA).
Immunohistochemistry and immunofluorescence
After BBR treatment and behavior test, some mice were perfused transcardially with PBS and the brains were then fixed in 4% paraformaldehyde. The samples were cryostated as previously described16. Free-floating serial coronal sections (30 μM thickness) including the hippocampus were cryostat with a freezing sliding microtome. Sections were blocked at RT for 1 h with blocking buffer (0.3% Triton X-100 PBS with 1% BSA and 5% normal donkey serum), and then the indicated primary antibodies diluted in blocking buffer were incubated with sections at 4 °C overnight. For immunohistochemistry, the sections were incubated with the HRP secondary antibodies for 2 h and DAB color was developed with the DAB HRP Color Development Kit (P0203, Beyotime, China). The slide was sealed with neutral resins after dehydration. For immunofluorescence, the sections were incubated with fluorescent secondary antibodies at RT for 2 h. The imaging was caught with a microscope randomly by selecting 6 fields of view in the hippocampus in each group and qualification was analyzed with Image J software. Applied antibodies were listed as follows: Rabbit anti-APP (1:200, Cat: 25524-1-AP, Proteintech, Wuhan, China); Rabbit anti-PPARG (1:250, Cat: 16643-1-AP, Proteintech, Wuhan, China); Mouse anti-β-Amyloid (6E10, 1:1000, Cat: 803001, Biolegend, USA), Rabbit anti-Iba1(1:200, Cat: ab5076, Abcam, USA), Rabbit anti-GFAP (1:1000, Cat: ab7260, Abcam, USA), Donkey Anti-Mouse IgG (H + L) Alexa Fluor® 488 (1:500, Cat: 715-545-150, Jackson ImmunoResearch, USA), Donkey Anti-Rabbit IgG (H + L) Alexa Fluor® 594 (1:500, Cat: 715-585-152, Jackson ImmunoResearch, USA).
Statistical analysis
The above experiments in each group were carried out by researchers blindly. All collected experimental data was expressed as mean ± standard deviation and statistically analyzed using GraphPad Prism9 software. Two-tailed T-test was used to compare the results between two groups, and a one-way analysis of variance (ANOVA) with Tukey’s post hoc test was used to compare the results of multiple groups. * represents p < 0.05, ** represents p < 0.01, *** represents p < 0.001.
Responses