Nighttime light development index: a new evaluation method for China’s construction land utilization level

Introduction
As a crucial component of human economic activities, construction land plays a vital role in ensuring regional sustainable development (Gao and O’Neill, 2020). Historically, China’s regional development has been characterized by an extensive approach heavily reliant on high resource consumption, leading to low efficient land usage (Han et al., 2022), spatial development imbalances (Güneralp et al., 2020), and increasingly severe damage to resources and the environment (Xu et al., 2023). According to the results of China’s third national land survey, the total amount of construction land in the country at the end of 2019 was 40 million hectares; this represents an increase of 8.5 million hectares, or 26.5%, compared with the second national land survey (Department of Natural Resources, 2021). Many urban and town areas feature underutilized and idle land, yet the distribution of village land is vast but not optimally arranged. Given the ongoing tension between human populations and available land, the rational development and utilization of construction land are essential planning approaches to support societal growth. In recent years, China has implemented several strategies aimed at promoting economical, intensive, and efficient land use, such as the new-type urbanization and rural revitalization strategies. The national 14th Five-Year Plan has further delineated the direction for the development of urban and rural construction land (The State Council of the People’s Republic of China, 2014, 2018, 2021). Accurately measuring the utilization level of construction land is pivotal for crafting foundational regional development plans and fostering high-quality development at the regional level; thus, these measurements represent a crucial aspect of ensuring the sustainable use of land resources.
Current studies predominantly focus on themes such as the expansion of construction land (Zhou et al., 2023) and its economical and intensive utilization (Deng et al., 2021). These studies have mainly focused on delineating the spatiotemporal evolution characteristics of construction land (Wu et al., 2021), evaluating the efficiency of construction land usage (Gao et al., 2022; Wang et al., 2024), analyzing the factors influencing changes in construction land (Zhou et al., 2020), assessing the internal structure of construction land (Lei et al., 2022), and exploring the ecological and environmental effects resulting from the construction land’s evolution (Li et al., 2023). Supported by remote sensing interpretations (Daams et al., 2023), spatial analyses (Zhang et al., 2020), and other technical methods, these existing findings have provided comprehensive insights into the mechanisms governing construction land evolution, thereby ensuring and enriching a multidimensional construction land analysis approach. Recently, scholars have predominantly focused on analyzing construction land in central urban areas or conducted overall assessments of construction land based on administrative boundaries and have often overlooked the significant disparities in the utilization levels between urban and rural construction land. Additionally, a substantial portion of studies employing multidimensional data for evaluation purposes have primarily relied on statistical or social survey data as the primary data source. These data sources have certain drawbacks that hinder their applicability across different spatial scales, such as a considerable lag, high acquisition costs, and limitations imposed by administrative boundaries.
Nighttime light data possesses several advantages, including easy accessibility, long time series, and effective avoidance of administrative boundary changes (Levin et al., 2020). Nighttime light remote sensing images can effectively represent specific indicators of social and economic development across various dimensions and scales (Bennett and Smith, 2017). These indicators serve as a reliable proxy for assessing regional economic levels and public service provision (Mellander et al., 2015; Chen and Nordhaus, 2011). In studies related to construction land, nighttime light data are often used to extract central urban areas (Chakraborty and Stokes, 2023), map urban land (Yang et al., 2013), identify urban land expansion and (Liu et al., 2012), and analyze the differences between urban and rural areas (Chen et al., 2023). The Nighttime Light Development Index (NLDI), introduced by Elvidge et al. (2012), incorporates nighttime light and spatial population data. This index quantifies the degree to which an area’s light intensity aligns with its population density. Geographically, spatial equilibrium is defined as the balance between economic supply and spatial demand. This metric signifies a state of Pareto efficiency in which population, economy, and resources harmonize with one another. Resources are allocated within a specific space to maximize benefits, thereby utilizing the economic potential and advantages of each region. Therefore, as a reliable proxy indicator for economic and social development levels, the spatial equilibrium between regional nighttime illumination and population often signifies a high degree of development in the regional social economy. This equilibrium also represents the level of utilization and development of construction land that accommodates both population and economic activities.
Simultaneously, Elvidge calculated a correlation coefficient of 0.71 between the NLDI and the Human Development Index (HDI). The HDI, introduced by the United Nations Development Program (UNDP), is a comprehensive measure derived from three fundamental variables: life expectancy, educational attainment, and quality of life, which are all calculated using specific methods. HDI serves as a key indicator for assessing the economic and social development levels of United Nations member states (United Nations Development, 2022). Consequently, the NLDI can serve as a substitute for the HDI in evaluating regional development levels. Notably, researchers have employed this index to assess the development levels of various regions, including Italy (Salvati et al., 2017), Romania (Ivan et al., 2020), and China’s Qinghai-Tibet Plateau (Huang et al., 2021). Moreover, they have extended this indicator to global (Achten and Lessmann, 2020; Mirza et al., 2021) and regional (Weidmann and Theunissen, 2021) socioeconomic inequality (Zhou et al., 2015), as well as evaluations of the effectiveness of electrification programs (Falchetta et al., 2020), public service balance (Xu et al., 2015), development balance (Peng et al., 2022), and ethnic well-being (Liu and Li, 2015). This research has fully proven the effectiveness of this index in measuring the level and balance of regional development.
This research aimed to explore a precise, swift, and scientifically sound method for assessing construction land utilization levels. To our knowledge, this study, for the first time, employs the NLDI to gauge various forms of construction land utilization levels. Considering China’s rapid progress in new-type urbanization and rural revitalization strategies over the past decade, as well as its robust planning capabilities for urban areas, the NLDI was utilized to measure and analyze the spatiotemporal shifts in the development status of urban construction land in China from 2010 to 2020. The study findings could offer quantitative insights to inform China’s decision-making processes regarding land conservation, intensive usage, and promotion of high-quality development.
Study area and data
We used China’s 2020 land-use data (https://www.resdc.cn/DOI/DOI.aspx?DOIID=54) to extract information on urban and rural land. The land-use data are based on data from Landsat 8 OLI, GF-2, and other remote sensing satellites; these data were obtained through the construction of a high-resolution remote sensory-unmanned aerial vehicle-ground survey technology system combined with a human-computer interaction interpretation method based on geological knowledge. The land-use types included six first-level types, namely, cultivated land, woodland, grassland, water, residential land, and unused land, and an additional 25 second-level types (Liu et al., 2014). Among them, construction land was divided into three categories: urban land, other land types (including factories and mines, extensive industrial zones, and transportation infrastructure), and rural residential areas located independently from urban areas. The first two types of construction land development are relatively concentrated and contiguous and represent the areas where the government has focused most on urban development and construction (Fig. 1). The distribution of rural residential areas is more scattered, showing different construction land use patterns from the first two types. Therefore, the first two types of land were defined as centralized construction land (CCL), and the third type was defined as decentralized construction land (DCL).

Centralized construction land, decentralized construction land, and non-construction land are represented in red, blue, and gray correspondingly.
DMSP-OLS and NPP-VIIRS are two types of commonly used nighttime light images. The DMSP-OLS annual nighttime light data from 1992 to 2013 were generated by the OLS of the linear scanning operation system performed by the US Defense Meteorological Satellite Program (DMSP). However, the DMSP-OLS data have some shortcomings, such as supersaturation, a lack of on-orbit radiometric calibration, and light overflow in areas with high brightness. In 2012, the visible infrared imaging radiometer (VIIRS) onboard the National Polar-Orbiting Operational Environmental Satellite System (NPP) provided a new generation of high-quality nighttime light data to address the problems associated with the DMSP-OLS light dataset. This further extended the potential applications of nighttime light remote sensing. However, the two types of light data cannot be directly connected because the value of light pixels in the same spatial and temporal location vary greatly owing to differences in sensors. The light data we used were the 2010–2020 NPP-VIIRS-like annual synthetic datasets (https://doi.org/10.7910/DVN/YGIVCD). These datasets transform DMSP-OLS data into NPP-VIIRS-like data using an autoencoder model, which is highly accurate and passes consistency corrections (Chen et al., 2021).
The population dataset used in this study was the Global Population Spatialization Data (LandScan) from the Oak Ridge National Laboratory (https://landscan.ornl.gov/), USA. This dataset comprehensively utilizes population censuses, administrative divisions, and land cover data, as well as related high-resolution remote sensing image data such as elevation, slope, and coastlines (Dobson et al., 2000). Notably, this spatialized population dataset does not use nighttime light data as a direct source in the production process, so it can be applied as input data for calculating the NLDI.
Methodology
Research framework
The aim of this study was to assess the utilization level of China’s construction land with the aid of a multivariate data analysis. As previously noted, NLDI serves as a reliable proxy for regional development levels, particularly highlighting accessibility to public services and infrastructure. Average nighttime light intensity effectively reflects regional economic development, while Construction Land Development Density (CLDD) indicates disparities in construction land development levels across the municipal-level administrative units. The combined use of these three indicators enables a comprehensive assessment of divergent pathways in China’s regional development across economic growth, land utilization, and spatial configuration. This approach provides a scientific basis and reference for China’s ongoing optimizing and redeveloping of inefficient construction land. Initially, land cover data was employed to differentiate various types of construction land. Subsequently, the spatial-temporal evolution of different development levels of construction land was evaluated using a regional development index constructed from nighttime light and population spatial data. Subsequently, by combining the NLDI with two indicators, the average nighttime light intensity of construction land and the development density of construction land, the index distinguished the regional characteristics and development directions of various cities in China and formulated future development strategies tailored to local conditions.
Nighttime light development index (NLDI)
The NLDI is calculated using a Lorentz curve to determine the relationship between the cumulative percentage of the population and the cumulative percentage of nighttime light, which is similar to the calculation principle of the Gini coefficient. The index measures the extent to which nighttime lighting matches population density. The fundamental principle is that nighttime lighting comprehensively represents regional economic level and public services. Consequently, NLDI can represent availability and access to regional wealth and public facilities. NLDI values range from 0 to 1. The closer the NLDI is to 0, the more the population matches the light intensity it accesses, indicating a higher level of regional development. Conversely, the closer it is to 1, the lower the level of regional development.
We use nighttime light data and population datasets, both with identical projected coordinates and spatial resolutions, as inputs to generate a list that includes all grid cells with population and light intensity values. The light intensity values of each grid cell are sorted in ascending order, and the total population corresponding to each unique light intensity value is calculated. Using these datasets, we then calculate the cumulative percentages of light intensity and population within the region, enabling the plotting of a Lorenz curve (the inserted graph of Fig. 2). Here, S0 represents the absolute equality line, and S1 represents the Lorenz curve. The area between S1 and S0 is denoted as A, while the area below S1 in the lower right is denoted as B. The NLDI is thus defined as A/(A + B).
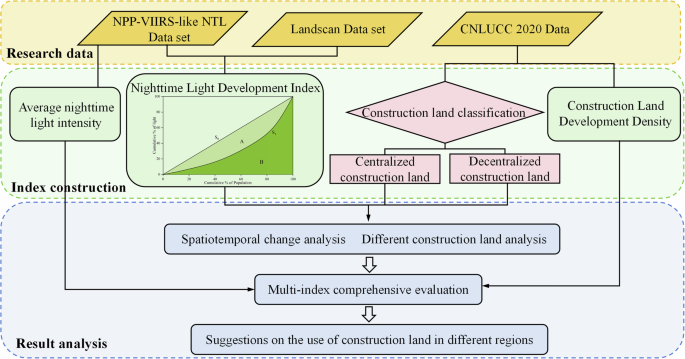
The yellow section outlines the data sources, the green section introduces the indices, and the blue section details the multi-step analysis of the results.
Construction land development density (CLDD)
Construction land development density (CLDD) is a comprehensive index for the level of development and intensive utilization of construction land in a region. In the present study, the CLDD applies the percentage of the total area occupied by CCL and DCL areas, as defined in the previous section, to represent the overall level of construction land development within the municipal-level administrative unit. CLDD is consistent with the relevant indicators in China’s “National Master Plan for Functional Zones” (The State Council of the People’s Republic of China, 2014) and provides a comprehensive reflection of current land use status. The specific formula is as outlined in Eqs. (1) and (2):
where CLDDCCL and CLDDDCL represent the construction land development density of CCL and DCL areas, respectively; areaCCL and areaDCL represent the areas of CCL and DCL, respectively; and areatotal represents the total area of the administrative region.
Average nighttime light intensity
The light index can characterize dynamic changes in population and economic development obtained from nighttime light remote sensing, and the average nighttime light intensity is the ratio of the total nighttime light intensity of construction land to its area, as articulated in Eq. (3). Relevant studies have demonstrated that the average nighttime light intensity can reflect regional development vitality and economic development status.
In the formula, ({{DN}}_{i}) represents the DN value of the nth pixel and n is the total sum of pixel values within the research unit.
Results and discussion
Temporal dynamics of NLDI
A notable disparity was observed between the average NLDI of the 2010–2011 CCL and that of the DCL, with the former being ~0.5 units lower (Fig. 3a). Over the past decade, both CCL and DCL in China have exhibited downward trends in their NLDI averages, and the regional development level has improved obviously, which is consistent with the results of research on the gradual improvement of land use efficiency in China in recent years (Zhou and Lu, 2023). Specifically, CCL’s NLDI decreased from 0.38 to 0.23, whereas DCL’s declined from 0.89 to 0.74. Notably, the decline in NLDI for DCL remained relatively stable, with 62% of DCL’s NLDI experiencing a decrease of at least 0.1 over the past decade. In contrast, CCL’s NLDI experienced a significant decline between 2011 and 2013, followed by minor fluctuations ranging from 0.2 to 0.23 between 2013 and 2020. Based on the overarching trend of improvement, the development characteristics of these two types of construction land diverge. CCL boasts a relatively mature public service infrastructure, stable economic and social conditions, a low NLDI, and minimal change in the later period. By contrast, DCL demonstrated significant improvements in aspects such as road traffic and public services due to the implementation of the national targeted poverty alleviation and rural revitalization strategy, which resulted in a notable enhancement in regional development levels.
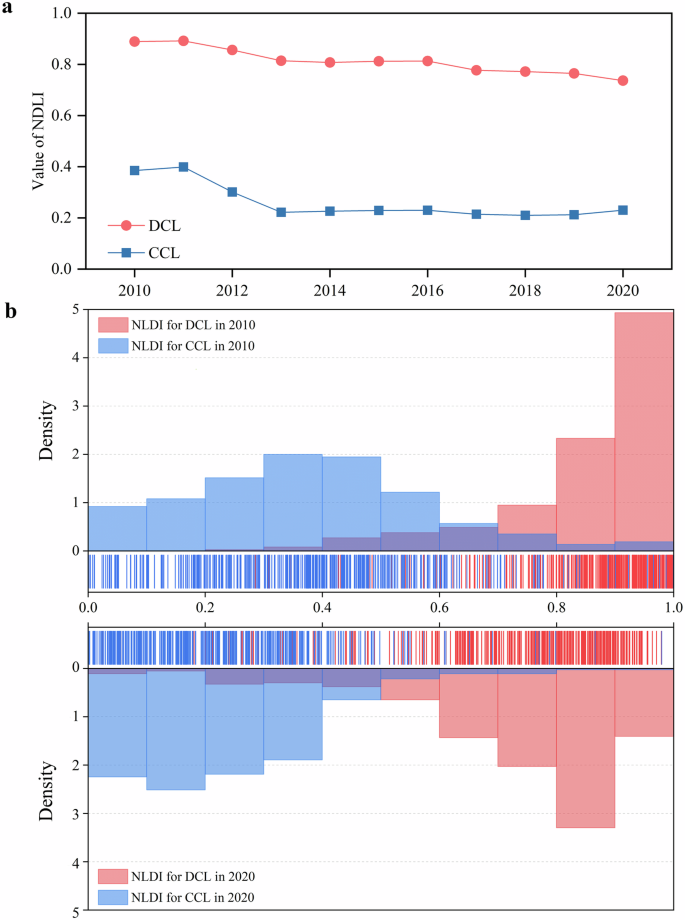
A line chart displays the mean NLDI values for Centralized Construction Land (CCL) and Decentralized Construction Land (DCL) for each year (a), and box plots compare the NLDI distributions for CCL and DCL in 2010 and 2020 (b).
The NLDI distributions of CCL and DCL for 2010 and 2020 show a clear difference between the two types of construction land (Fig. 3b). The light-matching degree of DCL was obviously smaller than that of CCL. Owing to the development orientation of an “emphasis on cities and light on rural areas” in the early days of the founding of New China, China has invested capital, technology, talents, and other factors in CCL construction land for several decades, resulting in a high level of development in CCL. However, problems such as extensive land use, inadequate infrastructure and basic public services, and rural hollowing have appeared or intensified in DCL. In addition, there are problems such as a lack of planning and unreasonable distribution of rural construction land, resulting in low quality regional development. In recent years, China has successively implemented strategies such as new rural construction, urban-rural integration, and new-type urbanization to address the shortcomings of China’s China’s DCL development. In the past decade, the construction land utilization efficiency of some DCLs has improved, and the matching degree of light-population distribution has significantly improved, even exceeding the NLDI of some CCLs. All regions should reasonably improve the allocation of construction land elements and promote the equalization of regional public goods and services to support the sustainable and healthy development of economic, social, and urbanization construction in all regions.
Spatial pattern of NLDI
Compared to those in 2010, the NLDI values for both CCL and DCL in 2020 show increasing trends in the west and north and decreasing trends in the east and south (Fig. 4c, d). The NLDI values of the two types of construction land in the southeast coastal area are small, showing a high light-population matching. The eastern coastal area represents the main area for cross-provincial population inflow and agglomeration. Driven by foreign trade, township enterprises, and policy support, the industrial structure and land use in rural areas have undergone a rapid transformation, and the regional comprehensive development level is relatively high. In the central region, the NLDI is relatively low in urban areas and relatively high in rural areas. The common feature of the central region is that the NLDI of CCL is small, whereas the DCL value is large. The central region is an important main grain-producing area in China, as it contains a large proportion of the rural population, and its industrial composition is mainly based on manufacturing and agriculture. Urbanization and industrial transformations have been subjected to agricultural and land policy constraints. DCL has been affected by the siphoning effect of core construction land, and its ability to gather capital, talent, and technology is low, and its land use efficiency is also relatively low. The NLDI values of the two types of construction land in the northeast and western regions are large, showing different development paths from the coastal areas. There are several resource-based industries and heavy chemical enterprises in the western region; the trade environment and the early national strategy have contributed to a lack of impetus in the regional development, and the appeal to the population is limited. The northeastern region continues to face challenges in revitalizing its old industrial base. The light-population balance of the two regions has a higher capacity for improvement. The characteristics of regional development level assessed in our study are similar to the spatial patterns in land use development assessment research, with high development characteristics in the east and low development in the west, and the results further highlight the difference in regional development level between centralized construction land and decentralized construction land (Guo et al., 2024).
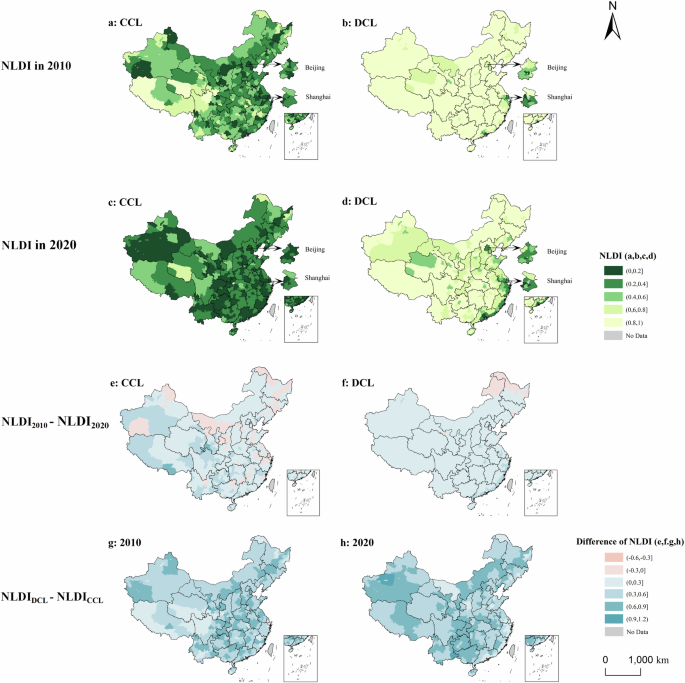
The spatial distribution of NLDI for CCL in 2010 (a), DCL in 2010 (b), CCL in 2020 (c), and DCL in 2020 (d) is shown, along with the temporal changes in NLDI for CCL (e) and DCL (f) between 2010 and 2020, and the differences in NLDI between CCL and DCL in 2010 (g) and 2020 (h).
Urban units of different scales have been formed due to the differences in the development modes and speeds of different regions in China. For Beijing, Shanghai, and other municipalities directly managed by the central government, owing to their large city size, policy incline, and other reasons, their NLDI values represent a more complex metric requiring further analysis. Therefore, Beijing and Shanghai, two large-scale administrative units with different urban development patterns, were selected and the analysis scale was refined to the district and county levels (Fig. 4a–d). The results show that there are obvious differences between CCL and DCL in the peripheral districts and counties of Beijing, and it is necessary to enhance the development efficiency of construction land to enhance the hematopoietic capacity of this region. The development level of Shanghai’s districts and counties is generally higher, and the two megacities show different development paths.
The regional development level gap between DCL and CCL within the same urban unit in each year can be analyzed by subtracting the NLDI of CCL in China from the NLDI of DCL for the years 2010 and 2020 (Fig. 4c, f). In 2010, the central and eastern regions of China had a high level of development in CCL, reaching a relatively high comprehensive level. However, inadequate investments in infrastructure, industrial development funds, and human capital training for DCL in the region resulted in poor matching between the lighting and population density, leading to a significant gap in NLDI. However, in 2010, a smaller gap between urban and rural areas in the western region resulted from high NLDI values of both types of construction land. In 2020, the eastern coastal areas became more economically active with a higher level of inclusive finance, attracting additional capital and residents. Public services in rural areas, such as culture, education, and social security, became more equalized, and the construction land utilization level of DCL improved significantly. In the central and western regions, CCL developed to a certain extent, but the siphoning effect from the central urban area did not lead to a significant increase in the construction land utilization efficiency of DCL. The high-value gap between DCL and CCL has shifted from the central and eastern regions to the west over the past decade. The current low level of urban DCL development in the western region represents a problem similar to that the eastern region faced ten years ago. With the continuous development of the economic and social level and the continuous promotion of rural revitalization and new-type urbanization policies, full utilization of construction land throughout the whole region will eventually be accomplished, and the regional development level will be effectively improved.
The NLDI of each city in China in 2010 was subtracted from the NLDI in 2020 (Fig. 4g, h), and this product was used to distinguish the change characteristics of the utilization level of various types of construction land in China. In China, the number of cities with declining NLDI of CCL and DCL was greater than the number of cities with an increasing NLDI; 83% and 97% of CCL and DCL regions have undergone a decrease in NLDI, and the regional development level has improved. Among these regions, the change amplitude of the NLDI in CCL is the most obvious, and this region’s urban areas have a relatively strong economic foundation, perfect public services, and strong population attraction ability. This means that CCL’s light intensity is more in tune with the population distribution. In reviewing the subregions, the NLDIs of CCL in western China as well as DCL in eastern coastal areas have decreased significantly. This result demonstrates that the eastern coastal area began developing a common regional prosperity when the central urban area had developed to a certain extent. However, the western region has mostly focused on the economic and social construction of the central urban area and has not paid sufficient attention to the marginal areas. This spatial difference reflects the different development stages of different regions. Notably, the NLDIs of the two types of construction land in some cities in northeast China have increased, whereas the regional development level has decreased. In recent years, the northeast region has faced an economic recession and a serious brain drain problem. Therefore, the efficiency of construction land development must be urgently improved in this region, as these steps can revitalize the region’s economic and social vitality as well as ensure a healthy and coordinated development. Different regions vary greatly in the conditions required for promoting balanced development, and it is thus necessary to reform relevant systems and steadily promote regional development in various stages and regions.
Relationship between NLDI and CLDD
NLDI and CLDD scatter plots were created for the two types of construction land in each city in China in 2020 (Fig. 5). These plots represent the normalization index of the ANL of the construction land in 2020, or more specifically, the vitality of regional development. The different colors of the scatter points represent the east, west, central, and northeast regions of China.
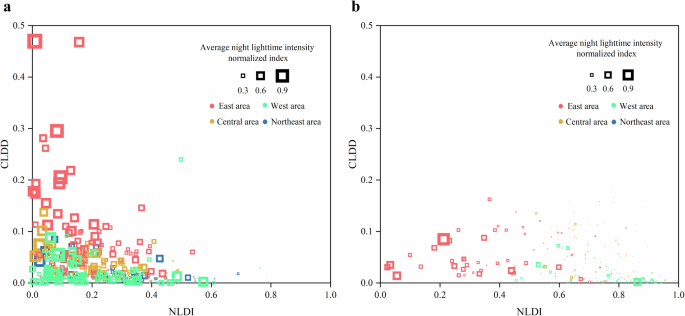
Plots for centralized construction land (a) and decentralized construction land (b) show the relationship between NLDI and CLDD.
Figure 5a conveys the correlation between CLDD and NLDI within CCL areas. Across all urban units, approximately 88% exhibited a concentrated CLDD within a 0.1 range, indicating a similarity in construction land development density. City units with CLDD values exceeding 0.1 displayed distinct characteristics, such as comparatively low NLDI and high ANL values; these values were primarily found in cities within the eastern region. The rapid urbanization of the eastern region has attracted a considerable influx of people, talents, technology, and capital and has contributed to the efficient development of urban land, enhanced land utilization efficiency and effectively aligned nighttime light with the population distribution. Simultaneously, scientifically and judiciously utilized land has provided a high-quality foundation for economic growth, stimulating regional economic vitality, and achieving a higher level of regional comprehensiveness in these areas. By contrast, the western region faces limitations imposed by its natural geographical features, such as mountains and hills. Much of these regions are designated as ecological conservation areas, resulting in a restricted land supply and generally low CLDD. Despite construction land development not being particularly high in the western cities, there was an evident differentiation in NLDI among them, leading to significant disparities in regional development equilibrium. This observation underscores the lack of a strict correlation between construction land development density and regional development levels. At present, the average light intensity of western cities remains lower than that of the other three regions. When promoting economic development and urbanization in the future, attention should be paid to improving the breadth and depth of construction land, and the quality of construction land should be improved by improving the efficiency of land use.
Figure 5b reveals notable distinctions in the characteristics of construction land between DCL and CCL areas. Within the scattered construction areas, there exists an inverted U-shaped relationship between CLDD and NLDI. In the eastern region, DCL is predominantly concentrated in areas where NLDI is below 0.4 and CLDD is less than 0.1. The eastern region possesses significant locational advantages, fostering a high level of urban-rural integration and facilitating the smooth flow of capital, labor, and technological factors between urban and rural zones. The development of central cities effectively enhances the efficiency of marginal construction land use, thereby exemplifying a path toward balanced and inclusive development. The central region showed the highest CLDD values compared to the other three regions. Approximately a quarter of the municipal units among the 86 central cities exhibited CLDD values exceeding 0.1. Owing to its advantageous topography, landforms, water resources, and other environmental factors, the central region has played a vital role in ensuring China’s food security for many years. However, despite its extensive rural areas and substantial scattered construction land, the NLDI in the central region primarily fell within the range of 0.6 to 0.9 in the present study. This suggests issues such as a misallocation of capital and human resources and an insufficient development of surrounding construction land in central urban areas. Thus, the policy focus should be on revitalizing rural construction land and maximizing its potential for rural revitalization. In the northeast and western regions, NLDI exceeded 0.7, whereas CLDD is less than 0.05, indicating limited scattered construction land and lower development levels in the periphery of urban units that resulted in generally lower light brightness. Municipal governments should prioritize efforts to enhance the efficiency of relatively underdeveloped rural construction land, promote the provision of public services and infrastructure, improve the well-being of residents, and elevate the overall level of regional development.
In addition, according to relevant studies, CLDD and regional development levels do not always develop in tandem, which is also consistent with the results of the present study. The establishment of development zones increases the expansion of urban areas and reduces the intensity of urban land use efficiency. (Gao and Wang, 2023). Another study with a global study area revealed that as the distance from the city center increases, the nighttime light decreases faster than land density, which indicates that the spatial agglomeration of social and economic factors is more obvious than that of physical space. Consequently, the balanced development of socio-economic and physical elements of megacities is required to avoid low-density urban sprawl (Zheng et al., 2023). Research on government behavior also confirms that the government’s motivation to obtain land income by providing land for social infrastructure is stronger than the motivation to meet public demand; therefore, there could be a phenomenon where urban land expansion and urban development levels are not synchronized (Gao et al., 2019).
Many previous studies have adopted efficiency assessment to measure land use utilization intensity levels. They typically adopt multiple input variables (such as land, labor, and capital) and multiple benefits (including variables from the perspective of economy, society, and ecology) as output variables and focus on how to produce as many positive outputs as possible with the least input. In the present study, the NLDI concentrated on the distribution of population in nighttime lights, and it is demonstrated to be a proxy for the spatial distribution of human settlements, with high potential for application in estimation of income and GDP, based on case studies from Italy and Romania (Salvati et al., 2017; Ivan et al., 2020). Notably, both land use efficiency and NLDI fully consider the coordinated allocation of capital, population, and land. However, the multi-index measurement of land use efficiency requires complex and detailed multivariate data to ensure the reliability of the results. Nevertheless, it can be challenging to obtain various statistical data for input-output efficiency measurements. Moreover, such studies often use administrative divisions as their statistical units. This limitation constrains the ability to examine construction land within such administrative units in detail. By contrast, the method adopted in the present study makes full use of pixelized data, which can be applied at different regions and spatial scales, and it can generate different development pathways for centralized construction land and decentralized construction land within cities.
Policy implication
The NLDI, as a representation of regional development level in the present study, underscores the level of public access to infrastructure, public services, and social wealth distribution within cities. China’s Ministry of Natural Resources issued a directive in 2023 on carrying out pilot projects on the redevelopment of low-efficiency land. This directive concentrated on problems such as scattered layout, extensive use, and unreasonable use of existing construction land, which have long been prevalent in some towns and rural areas. The ultimate objective of this directive was to replenish public service facilities and infrastructure and increase the effective supply of construction land (The Ministry of Natural Resources of the People’s Republic of China, 2023). This study provides valuable data and an effective assessment method for identifying low-efficient urban construction land and can consequently formulate pertinent policy implications for promoting high-quality regional development.
Based on the relationship between NLDI and CLDD, greater attention should be paid to the low efficient land of central and western China in comparison with eastern China. The centralized construction land in some small- and medium-sized cities in central and western China has a high NLDI level, which indicates that the allocation of public facilities and population agglomeration undergo significant challenges. The integration of urban development, infrastructure, and public services should be considered to enhance the attractiveness of the cities (Xu et al., 2020). Decentralized construction land serves as the spatial carrier for rural industrial development. The NLDI of decentralized construction land in central and western China generally exhibits high levels, with widespread presence of low efficient land. Simultaneously, land use regulations restrict the expansion of scattered construction land due to the presence of cultivated land and nature reserves. On the one hand, it is imperative to balance land function among construction, plantation, and ecological conservation. On the other hand, careful consideration must be given to the economic vitality and livability of decentralized construction land, and integrated planning for infrastructure and public facilities should be implemented (Ma et al., 2022; Yin et al., 2023).
Conclusion
This study innovatively divides urban construction areas into centralized construction land and decentralized construction land and applies the NLDI to analyze the spatio-temporal changes of the regional development level during 2010–2020 based on the two types of construction land in China. This approach has interpreted and characterized China’s regional development from a new perspective and can provide quantitative decision-making information for promoting China’s efficient use of construction land.
The quantitative evaluation results indicate that over the past decade, with the implementation of a series of regional development strategies in China, there has been a significant improvement in regional development level, along with a notable enhancement in the spatial alignment between population distribution and nighttime light brightness as signified by different types of construction land. However, there is still room for improvement in the utilization of construction land in China. The results also reveal significant spatial disparities in the NLDI between centralized and decentralized construction land. The utilization level of centralized construction land in the western region has notably improved compared to that in other regions, and the utilization level of decentralized construction land in the eastern coastal areas has witnessed effective enhancement. The disparities in the development levels of centralized construction land and decentralized construction land primarily stem from variations in regional wealth and the level of public services, being influenced by factors such as input in construction land elements and the management system. Furthermore, there was no strict correlation between CLDD and NLDI. Differences in various indicators were more pronounced across different economic regions.
This study provides an option for exploring differences in the utilization of construction land within cities. The establishment of appropriate regional measurement criteria for construction land will effectively promote its rational use, thus, accelerating the improvement of regional socio-economic levels and well-being of residents.
The nighttime light data mainly depict the regional socioeconomic and public service status; however, they do not adequately capture the eco-environment dimension. To assess regional development level, the data can be further combined with ecological and environmental indicators to provide comprehensive descriptions and improve the understanding of the development level of construction land. Land redevelopment is a potential strategy for enhancing land utilization efficiency. Based on accurate identification of the spatial distribution of low efficient land utilization in the present study, the factors influencing low-efficient land use can be explored further in future, and feasible solutions for centralized construction land and decentralized construction land redevelopment in different regions can be explored.


Responses