Nitrogen flow in food production and consumption system of Inner Mongolia from 2000 to 2020

Introduction
Nitrogen, a vital nutrient element, is crucial in promoting and sustaining nutrient cycles within the terrestrial ecosystem1,2. Nitrogen exists as a fundamental component supporting production and daily life3,4, such as in the form of fertilizers, while it is also emitted into the environment in forms such as reactive nitrogen (Nr), which contribute significantly to agricultural non-point source pollution, air pollution, and climate warming. The human diet links the environment to human health5. The expanding influence of agriculture on the environment and human health is often driven by dietary shifts6. Increasing incomes and urbanization are propelling transformations in global dietary patterns. Traditional diets are gradually being replaced with diets high in refined sugars, fats, oils, and meat content. If left unchecked, by 2050, dietary trends are projected to become a leading factor contributing to an 80% increase in agricultural greenhouse gas emissions associated with food production7. As agricultural practices diversify and thrive, a substantial amount of Nr is released into the environment through the food chain, leading to rapid increases in nitrogen input within the terrestrial ecosystem. Moreover, with the growing quantity and proportion of high-nitrogen foods, such as fats and meats, in dietary structures, losses of Nr through food production and consumption have escalated in atmospheric, aquatic, and terrestrial environments. Nitrogen pollution, arising primarily from human activities associated with food and agricultural product demands, poses severe environmental threats at local, regional, and global scales8.
Despite using less than 10% of the world’s arable land9, China supports 18% of the global population. To meet its food demand, China utilizes substantially more nitrogen fertilizer during crop production than do other nations10,11. Its agricultural system alone accounts for nearly 30% of the global fertilizer consumption12. In 2017, China’s nitrogen utilization efficiency in croplands was approximately 32%, well below the global average of 55%13. Insufficient nitrogen input can lead to reduced productivity, but excessive input poses environmental risks14,15. Therefore, it is essential to implement comprehensive nitrogen management in the agricultural production system. China now faces the critical challenge of maximizing the benefits of nitrogen input in its products while also increasing food production without compromising the natural environment16. Although the nitrogen sources utilized in agricultural systems significantly influence nitrogen utilization efficiency, they are influenced by factors such as climate17, economic growth18, urbanization level19, gross domestic product, and crop types11. Material flow analysis quantifies the changes in material quantity passing through the input–storage–output processes within the environmental-economic system. It can reveal the flow characteristics and transformation efficiencies of materials within the system20,21. The material flow analysis has been extensively employed to investigate the flows of Nr in the food production and consumption systems. Based on material flow analysis, Barles22 found that the input of N nutrients in food in Paris increased by four times. Zhou et al.23 also found that the development of urbanization would increase food imports, which would greatly increase the N environmental load in food production areas. The input and flow direction of food production and consumption system N are mainly lost in the atmosphere, water and soil in the agricultural production stage24. Lin et al.25 simulated and quantified the changes of nutrient elements (carbon, nitrogen and phosphorus) in the urban food chain metabolism in Xiamen from 1991 to 2010 by using the substance flow analysis (SFA) model, and predicted through scenario analysis that the future population growth and changes in dietary habits would accelerate the emission of Nr to the environment. Improving the urban waste treatment system may be the main strategy to solve the problem of urban nutrient pollution. Other scholars have found that N is an important input in food production, and the excessive input of N has caused many environmental problems26. In the process of N element flow, there are problems such as high N element environmental loss rate and large environmental load27.
The agro-pastoral ecotone in northern China is one of the important ecological security barriers in China, which is of great significance for maintaining the functional stability of regional and national ecosystems and human social production and life28. Inner Mongolia is the core region of the agricultural and pastoral zone in northern China.The terrain of Inner Mongolia extends from northeast to southwest, in a narrow and long shape, with a linear distance of 2400 kilometers from east to west and a maximum span of 1700 kilometers from north to south29. The crop production in Inner Mongolia is mainly concentrated in the east of the Greater Khingan Mountains and the central Yinshan Mountains to the east and south, and the animal industry is mainly concentrated in the northeast and south. The crop production has a high degree of intensification, and the animal husbandry is dominated by the traditional grazing grassland animal husbandry, with a low degree of scale and intensification28.The large transportation distance and the great difference in the degree of intensification of crop production and animal industry lead to the serious decoupled crop and livestock production28,29. Moreover, as a typical grassland ecosystem, the food production and consumption system in Inner Mongolia has obvious characteristics in the following aspects: First, crop production is relatively small, while animal husbandry is the main production. Second, the natural grassland mainly relies on atmospheric nitrogen deposition to supplement nitrogen, and there is basically no large-scale application of nitrogen fertilizer. Third, under the influence of dietary habits, the proportion of animal-derived foods in the food structure exceeds that of plant-based foods. It has been found that the economic growth of this region is realized at the cost of high resource inputs and pollution emissions29. These problems affect local economic development and human welfare and threaten the ecological security and sustainable development of North China28.
This study employed the SFA model to analyze changes in nitrogen input and output within Inner Mongolia’s agricultural production system, livestock farming system, and food consumption system from 2000 to 2020. Moreover, the study explored the driving forces behind nitrogen input in the food production and consumption system, nitrogen utilization efficiency, and nitrogen surplus/deficit. We aimed to provide a theoretical basis for controlling environmental nitrogen pollution within Inner Mongolia’s food consumption system and offer insights into nitrogen nutrient management within the food production and consumption system.
Methods
Overview of study area
The Inner Mongolia Autonomous Region (37°24′–53°23′ N, 97°12′–126°04′ E) is located within the interior of the Eurasian continent. The region covers an area of 1.183 million km2, making it the largest grassland pastoral area in China. As a typical region where agriculture and animal husbandry intersect, its grassland, forests, and per capita arable land area rank first in the country. As of 2020, the region had a permanent population of 24.0283 million. The per capita disposable income in 2020 was 31,497 Yuan, representing a 3.1% increase compared to the previous year. The per capita expenditure on daily necessities was 19,794 Yuan, which was 4.6% lower than the value of the previous year. The Engel coefficient for the entire population was 28.7%, representing an increase of 2.1% from the previous year. Inner Mongolia leads the country in producing milk, mutton, cashmere wool, and grasses, contributing one-fourth of the country’s mutton and one-fifth of its milk. It is a substantial “dairy and meat repository” for the nation30,31.
Data sources
The time series of this study is from 2000 to 2020. Basic data, including per capita food consumption, crop production, number of permanent residents, crop sown area, amount of nitrogen fertilizer applied to crops, amount of compound fertilizer applied to crops, and number of livestock (number of pigs, cattle, sheep, horses, donkeys, mules, camels, and poultry at the end of the year) are mainly derived from the National Bureau of China Statistical Yearbook Statistics, 2000–2020) and Statistical Yearbook of Inner Mongolia (2000–2020).
Material Flow Model and the research boundary
Based on the substance flow analysis (SFA) model24 and the law of conservation of mass, a nitrogen flow diagram of Inner Mongolia’s food production and consumption system was plotted to quantify the input and flow of nitrogen within the system to understand the environmental nitrogen load during food production and consumption (Fig. 1). The model focused on the inputs and outputs of nitrogen in the agricultural production system, livestock farming system, and food consumption system. The SFA model ensured the overall linkage and consistency of the various research systems. Twelve crops within the agricultural production system, either directly consumed by humans or used as feed for livestock, were selected for study: rice, wheat, corn, legumes, potatoes, sunflower, linseed, rapeseed, sugar beets, green fodder, vegetables, and melons. The livestock farming system involved eight animal types: pigs, cattle, sheep, horses, donkeys, mules, camels, and poultry. The food consumption system included food materials produced in the agricultural and livestock sectors, such as grains, vegetables, pork, beef, mutton, poultry, aquatic products, eggs and egg products, edible oils, sugars, and alcoholic beverages. In this study, all 12 prefecture-level administrative regions with agricultural and livestock farming production in Inner Mongolia were taken as the research boundary, and nitrogen flow among agricultural production system, livestock farming system, and food consumption system was taken as the research object.

Nitrogen flows in food production and consumption system.
Nr calculation
The Nr input into agricultural production was calculated using the following equation:
where Na-input is the total nitrogen input into agricultural production, i.e., the annual Nr input (Gg N yr−1; 1 Gg = 109 g); Ncompound-fer is the amount of nitrogen in compound fertilizers; NN-fer is the amount of nitrogen in nitrogen fertilizers; Norganic-fer is the amount of nitrogen in organic fertilizers; NBiological-N-Fixation is the amount of biologically fixed nitrogen; Ndeposition is the amount of nitrogen deposited from the air; Nirrigation is the amount of nitrogen provided by irrigation; and Nseed is the amount of nitrogen in the seeds.
The Nr output from agricultural production components was calculated using the following equation:
where Na-output is the total nitrogen output from the agricultural production component, i.e., the annual Nr release (Gg N yr−1); Nsurplus is the surplus nitrogen in the soil; Ngrain is the amount of nitrogen in the grains; Nstraw is the amount of nitrogen in the straw; Nvolatilization is the amount of nitrogen released from the volatilization of ammonia from fertilizers; NNI-DE is the amount of nitrogen lost from fertilizer nitrification and denitrification; Nrunoff is the amount of nitrogen lost from chemical and organic fertilizers through runoff; and Nleaching is the amount of nitrogen lost from chemical and organic fertilizers through leaching.
The Nr input into livestock and poultry farming was calculated using the following equation:
where Nl-input is the total nitrogen input into the livestock and poultry farming component, i.e., the annual Nr input (Gg N yr−1); Nstraw-feed is the amount of nitrogen in the agriculturally produced straw used as livestock and poultry feed; Ngrain-feed is the amount of nitrogen in the agriculturally produced grains used as feed; Nkitchen-feed is the amount of nitrogen in the food consumption-related kitchen waste used as feed; Nbone-feed is the amount of nitrogen in the livestock and poultry bones used as feed; Nby-feed is the amount of nitrogen in the livestock and poultry byproducts used as feed; Nforagegrass-feed is the amount of nitrogen in forage grass for feeding livestock and poultry; Nexternal-sources-feed is the amount of nitrogen in the feed, which was not produced locally and purchased from areas outside Inner Mongolia for livestock and poultry farming.
The Nr output from livestock and poultry farming was calculated using the following equation:
where Nl-output is the total nitrogen output from the livestock and poultry farming component, i.e., the annual Nr release (Gg N yr−1); Negg is the amount of nitrogen in the eggs produced from poultry farming; Nmeat is the amount of nitrogen in meat produced from livestock and poultry farming; Nmilk is the amount of nitrogen in milk produced from livestock farming; Nbone is the amount of nitrogen in the livestock and poultry bones; Nbyproducts is the amount of nitrogen in the livestock and poultry byproducts; and Nexcreta is the amount of nitrogen in the livestock and poultry excreta.
The Nr input into food consumption was calculated using the following equation:
where Nf-input is the total nitrogen input into the food consumption component, i.e., the annual Nr input (Gg N yr−1); Nanimal-food is the amount of nitrogen in the animal-based foods; and Nplant-food is the amount of nitrogen in the plant-based foods.
The Nr output from food consumption was calculated using the following equation:
where Nf-output is the total nitrogen output from the food consumption component, i.e., the annual Nr release (Gg N yr−1); Nkitchen-waste is the amount of nitrogen in kitchen waste; Ndigestion-loss is the amount of food nitrogen released via human eructation and flatulence; Nhuman-excreta is the amount of nitrogen in human excreta; Nhuman-absorption is the amount of food nitrogen absorbed by humans; and Nother-loss is the amount of food nitrogen losses by other aspects.
Calculation of food nitrogen surpluses/deficits and their rates
The Nr surpluses/deficits and their rates in food are key indicators of the consumption production balance of food nitrogen. The production of plant-based and animal-based foods was simulated using the agricultural and livestock and poultry farming production components of the SFA model, respectively. Food consumption was simulated using the food consumption component of the model. The surpluses/deficits and surplus/deficit rates of food nitrogen were calculated using the following equations:
where M (Gg N yr−1) is the surplus/deficit of food nitrogen, P (Gg N yr−1) is the amount of food nitrogen produced, C (Gg N yr−1) is the amount of food nitrogen consumed, and R (%) is the surplus/deficit rate of food nitrogen. M > 0 indicates that production exceeds consumption, meaning there is a surplus of food nitrogen; M < 0 indicates that consumption exceeds production, meaning there is a deficit of food nitrogen; M = 0 indicates that production and consumption are equivalent, and the amount of food nitrogen produced matches that consumed.
Scenario simulation
By setting different scenarios and using the SFA model, this study quantified the contributions of population growth, changes in agricultural planting area, variations in livestock quantity, and shifts in dietary structure to the input of Nr in Inner Mongolia’s food production and consumption system (Table 1). The proportional contribution of each influencing factor to the total effect was calculated.
Results and discussion
Input and output of Nr in the agricultural production system
The inputs and outputs of Nr in Inner Mongolia’s food production and consumption system from 2000 to 2020 were examined, as illustrated in Fig. 2. The primary source of Nr input in the agricultural production system was nitrogen fertilizer. The trend in nitrogen fertilizer input exhibited an initial increase followed by a subsequent decrease over this period. Starting from 428.03 Gg N ha−1 in 2000, the nitrogen fertilizer input increased gradually to 986.81 Gg N ha−1 in 2015 and then declined annually until it reached 771.12 Gg N ha−1 in 2020. This trend is mainly attributed to implementing the Zero-Growth Action Plan for Fertilizer Usage by 2020, initiated by the Ministry of Agriculture of China in 201532. As efforts toward zero growth in fertilizer usage continued, the input of organic fertilizer in Inner Mongolia increased steadily through the years. Compared to the year 2000, organic fertilizer usage in 2020 was approximately 1.62 times higher. Furthermore, the overall input of compound fertilizer increased by about 4.38 times over the 20-year period. Other minor sources of nitrogen remained relatively stable in both proportion and variation. Among the N outputs, nitrogen from harvested straws had a dominant role, followed by nitrogen from harvested grains and surplus nitrogen in the soil. Nitrogen derived from straws and grains experienced overall growth between 2000 and 2020. The amount of nitrogen in straws increased from 375.25 Gg N ha−1 in 2000 to 1067.89 Gg N ha−1 in 2020, a 1.85-fold increase. Similarly, nitrogen from grains increased from 285.31 Gg N ha−1 in 2000 to 801.02 Gg N ha−1 in 2020, an increase of 1.81 times. However, soil surplus nitrogen demonstrated an overall decline during this period, although it showed a significant increase from 2005 of 50.79% in 2007. Despite this increase, it had decreased by 45.02% compared to 2000 by 2020. This is because the use of chemical fertilizer decreases with the use of organic fertilizer, and the structure of fertilizer changes, resulting in a significant increase in nitrogen use efficiency (Fig. 3). The nitrogen taken away by grain and straw increased rapidly (Fig. 2D). The proportion of nitrogen losses through processes such as ammonia volatilization, nitrification–denitrification, leaching, and runoff remained relatively small and stable.
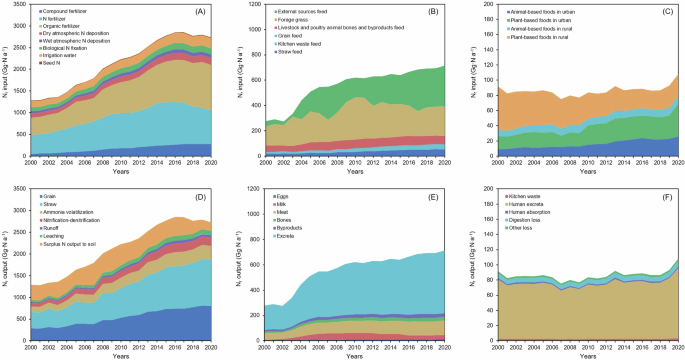
A Agricultural production component Nr input. B Livestock and poultry farming component Nr input. C Food consumption component Nr input. D Agricultural production component Nr output. E Livestock and poultry farming component Nr output. F Food consumption component Nr output. Error bars represent the standard deviation of the mean.
Error bars represent the standard deviation of the mean.
Input and output of Nr in the livestock farming system
Extensive grazing emerged as the primary stress or affecting the grassland ecosystem33, significantly impacting aboveground biomass and soil physical properties. This has led to reduced environmental nitrogen input and diminished benefits from soil nitrogen retention, which have exacerbated grassland degradation30. Within the input of Nr in the livestock farming system, nitrogen from forage accounted for 32.56–53.77% of the total and was the principal source of Nr input. External feed stuffs constituted 7.31–48.16% of the Nr input. With the initiation of the “returning grazing land to grassland” project in Inner Mongolia in 200034, nitrogen input from forage increased from 146.64 Gg N ha−1 in 2000 to 333.72 Gg N ha−1 in 2010, representing a 1.28-fold increase. However, this input began to decline thereafter, with a 30.20% reduction in 2020 compared to 2010 (Fig. 2). The overall nitrogen input of external feed stuffs increased 6.21-fold from 2000 to 2020. Nevertheless, there was a decline of 42.33% from 2007 to 2011, which might have been associated with a significant increase in nitrogen from forage during that period30. The contribution of nitrogen from animal bones and by-products to the Nr input ranged from 11.70% to 16.80%. It increased from 53.29 Gg N ha−1 in 2000 to 67.20 Gg N ha−1 in 2020, indicating a growth of 26.10%. Nitrogen from straw-based feed, kitchen waste feed, and grain feed had relatively low proportions and displayed stable growth. In terms of Nr output, there was a continuous increase in nitrogen from feces/urine, meat, eggs, and bones/by-products. Between 2000 and 2020, the total Nr output grew 1.58 times. Among these outputs, nitrogen from feces/urine constituted more than half of the total and emerged as the primary form of Nr output.
Input and output of Nr in the food consumption system
As illustrated in Fig. 2, from 2000 to 2020, there was a 17.96% increase in the total input of Nr in Inner Mongolia’s food consumption system. Within this, nitrogen input in urban animal-based and plant-based foods grew from 9.29 and 16.67 Gg N ha−1 in 2000 to 25.71 and 43.25 Gg N ha−1 in 2020, respectively, reflecting average annual growth rates of 8.84% and 7.97%. However, nitrogen input in rural plant-based foods declined by 49.23%, from 57.22 Gg N ha−1 in 2000 to 29.05 Gg N ha−1 in 2020. The proportion of nitrogen input from rural animal-based foods was comparatively low and had a relatively stable growth trend. The low input of Nr in food, despite the significant consumption of beef and mutton in Inner Mongolia’s pastoral areas, might be attributable to several factors: (1) Rearing methods and management. In Inner Mongolia’s pastoral regions, extensive grazing is the dominant rearing approach. This results in lower feed input and, consequently, lower intake of Nr by animals compared to intensive feeding methods. Furthermore, because of the absence of scientific management, the nutritional intake and utilization efficiency of animals may be lower in extensive grazing than in intensive feeding35. (2) Limitations in feed resources. The primary feed source in Inner Mongolia is natural grassland, which is subject to limitations in quantity and quality. Compared to refined and concentrated industrial feeds, natural pasture has lower nutritional value, including lower Nr content36. Moreover, the grassland growth is influenced by factors such as season, climate, and soil conditions, leading to possible instability in grass quantity and nutritional value37. This may reduce the Nr intake of animals. (3) Soil fertility and fertilization management. The soil in the grasslands of Inner Mongolia generally has low fertility38,39, and the supply of organic fertilizers is inadequate. Farmer and herdsman households might lack scientific guidance in fertilizer application, which can lead to insufficient or unbalanced use of fertilizers. This inadequacy restricts the nutrient supply to the pasture, limiting the production of animal-based foods and input of Nr. Among the Nr outputs, nitrogen from human feces/urine increased from 78.25 Gg N ha−1 in 2000 to 92.30 Gg N ha−1 in 2020, a growth of 17.96%. This output accounted for more than 85% of the total Nr output. Contributions from kitchen waste, human absorption, digestive losses, and other minor sources remained relatively small.
Nr input and output per unit in food production and consumption system
The inputs and outputs of Nr in Inner Mongolia’s agricultural production system, livestock farming system, and food consumption system between 2000 and 2020 were assessed on a per-unit basis (Fig. 4). The per-unit nitrogen input and output for cropped areas showed an overall increase. Specifically, the per-unit nitrogen input for cropped areas increased from 227.35 kg N ha−1 in 2000 to 302.87 kg N ha−1 in 2005, representing a growth of 33.22%. From 2006 to 2020, this value rose from 293.59 kg N ha−1 to 307.41 kg N ha−1, a 4.71% increase. Over the two decades, the per-unit nitrogen output for cropped areas increased from 165.40 kg N ha−1 to 285.69 kg N ha−1, reflecting a substantial increase of 72.72%. However, there was an 18.15% decline from 2005 to 2007. The per-unit nitrogen input and output for livestock increased between 2000 and 2020. Specifically, the input increased by 1.16 times from 2.68 kg N p−1 to 5.78 kg N p−1. The output for livestock declined by 56.78% from 2000 to 2004, but showed subsequent growth of 114.78% from 2004 to 2020. The per capita nitrogen input in the food consumption system increased by an annual average of 3.56 kg N p−1 from 2000 to 2020, which was comparable to the per capita nitrogen output (3.60 kg N p−1). After initially declining, with a decrease of 19.95% from 2000 to 2007, the per capita input rose gradually. By 2020, the per capita nitrogen input had increased by 45.63% from the value in 2007. The per capita nitrogen output remained relatively stable at an annual average value of 3.49 kg N p−1, which was the lowest value among the three major systems throughout 2000–2020.
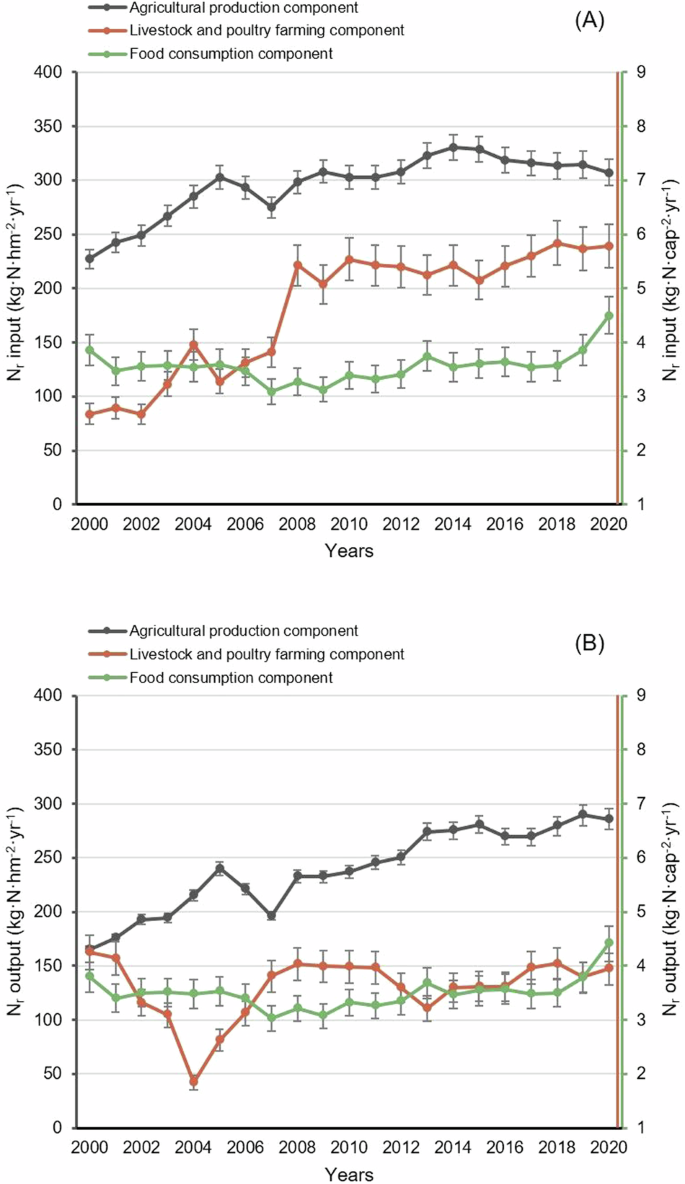
A Nr input per unit. B Nr output per unit. Error bars represent the standard deviation of the mean.
Nr input in the food production and consumption system driven by farmland area
The contributions of four factors, namely, the crop cultivation area, population growth, dietary structure, and livestock quantity, to the input of Nr in Inner Mongolia’s food production and consumption system were quantified (Table 1; Fig. 5). From 2000 to 2020, the total food consumption increased by about 21.44%, with a per capita consumption increase of approximately 101.63% for animal-based foods and a decline of around 2.16% for plant-based foods. The Nr input of S2 increased by 2.37%, while S3 exhibited an overall decrease. The total livestock quantity increased by 19.79% from 2000 to 2020, resulting in a 157.72% increase in the Nr input of the livestock farming system (Fig. 2). The Nr input of S3 increased by 28.79% from 2000 to 2020 (Fig. 5). The trend of S4 was consistent with that of S3. From 2000 to 2020, permanent population of Inner Mongolia increased from 23.724 million to approximately 24.028 million, indicating an average annual growth rate of 0.06%. From 2000 to 2020, the Nr input in the food consumption sector increased by 17.96% (Fig. 2), and the Nr input of S4 rose by 28.60% (Fig. 5). In contrast, S5 exhibited a significant decline. Over the same period, the cropped area increased steadily by 56.80%, leading to a growth of 114.47% in the Nr input of S5. The contribution rate of agricultural cropped area to the total Nr input of the food production and consumption system ranged from approximately 56.56% to 80.75%, while the livestock quantity contributed between 19.66% and 48.16%. The contributions of population growth and dietary structure changes range from −0.38% to 0.05% and −9.82% to −2.07%, respectively. Thus, it is evident that agricultural cropped area primarily drives the variations in the total Nr input of Inner Mongolia’s food production and consumption system.
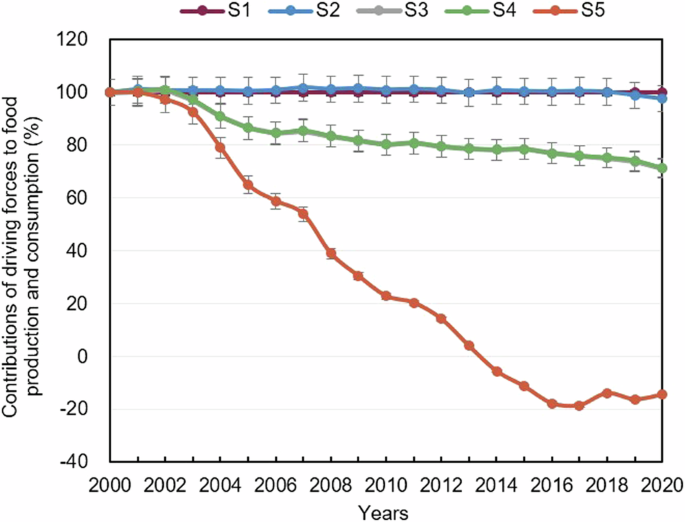
S1: population size, crop cultivation area, number of reared livestock and poultry animals, and dietary structure are maintained at the 2000 level. S2: changes in the dietary structure based on S1. S3: changes in the number of reared livestock and poultry animals based on S2. S4: changes in the population size based on S3. S5: actual situation: changes in the crop cultivation area based on S4. Error bars represent the standard deviation of the mean.
In 2020, the total population of Inner Mongolia was 24.0492 million, with a proportion of ethnic minorities of 21.26%. Compared to 2000, the ethnic minority population increased by 182,100, accounting for 61.98% of the total population increase. The proportion of ethnic minorities in Inner Mongolia’s total population increased by 0.5% from 20.76% in 2000 to 21.26% in 2020 (Inner Mongolia Bureau of Statistics, 2000–2020). Influenced by factors such as the consumption habits and structure of ethnic minorities, there was a significant increase in the consumption proportions of beef, mutton, and dairy products. Thus, the changes in the food consumption structure and livestock quantity had a pronounced impact on the Nr input of the food production and consumption system, while the influence of population growth was relatively minor. Therefore, scientists have suggested mitigating Nr input and environmental nitrogen pollution risks by improving dietary structure to reduce the consumption of animal-based foods and favor the consumption of low-nitrogen foods40,41,42,43. According to the 14th Five-Year Plan for the Development of Planting Industry in the Inner Mongolia Autonomous Region (Agriculture and Pastoral Department of Inner Mongolia Autonomous Region, 2022), stabilizing the cropped area, upgrading crop varieties, optimizing cultivation techniques, and increasing yield per unit area are the main goals for grain, oil crops, and cash crops (vegetables, sugar crops, melons, and fruits) during the plan period. As a result, the agricultural cropped area is expected to maintain a stable growth trend, ensuring a sustained Nr input of the food production and consumption system44.
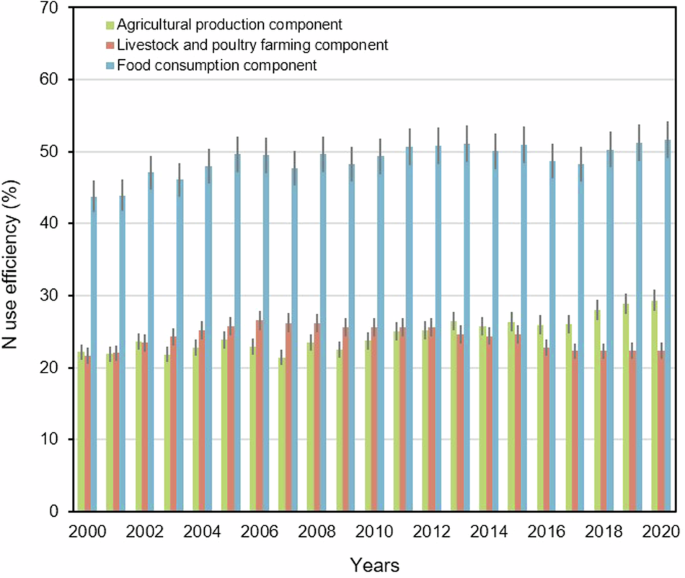
Low nitrogen utilization efficiency in agricultural production system
N use efficiency in the agricultural production system is an evaluative indicator of the nitrogen flow within the food production and consumption system, reflecting the relationship between the system input and output40. In this study, N use efficiency in the various systems refers to the ratio of economically valuable nitrogen products to the total Nr input in food production. As illustrated in Fig. 3, N use efficiency of Inner Mongolia’s agricultural production system showed a slight increase from 22.15% in 2000 to 29.33% in 2020, indicating that the decrease in nitrogen from harvested grains was slower than the decrease in nitrogen input. N use efficiency of the livestock farming system was similar to that of the agricultural production system, showing an overall upward trend followed by a gradual decline. It increased from 21.64% in 2000 to 26.55% in 2006, indicating that the decline in nitrogen output from meat, eggs, and milk was slower than the decline in nitrogen input27. Subsequently, it decreased from 26.24% in 2007 to 22.34% in 2020. N use efficiency of Inner Mongoliac’s livestock production system (21–27%) is lower than Jiangsu and Heilongjiang province (25–30%), and higher than that of the Hainan province (10–15%), Hebei Province (15–20%), and the national average value (11–16%). This phenomenon may be attributable to excessive fertilization, which leads to soil compaction and nutrient volatilization43. In this case, a large portion of the nutrients remains in the soil or is lost, reducing the utilization efficiency of nitrogen fertilizers. Meanwhile, changes in the food consumption structure of urban and pastoral residents in Inner Mongolia have led to a higher proportion of animal-based products in their diet, driving the development of feed grains and significantly increasing feed input45. N use efficiency of the food consumption system had the highest value, which continued to increase from 43.79% in 2000 to 51.67% in 2020, indicating that the growth rate of economically valuable nitrogen products in the food consumption sector outpaced the growth rate of nitrogen input. N use efficiency of Inner Mongolia’s agricultural production system is comparable to the national average value (27%)46, lower than that of the eastern regions of China (33%), and substantially lower than that of the eastern United States (65%) and Western Europe (61%)47. There remains ample room to increase grain production in Inner Mongolia by improving N use efficiency. In addition, Inner Mongolia should focus on adjusting livestock farming practices, promoting moderate-scale confinement feeding, and strengthening the integration of agriculture and animal husbandry to enhance agricultural production efficiency in the future. The progress of economic development and urbanization significantly influences N use efficiency in livestock farming. Developed regions with advanced livestock farming techniques and management practices utilize nitrogen more efficiently than underdeveloped regions. The nitrogen products in these regions tend to have high values because their livestock farming industry mainly supplies meat and eggs48. The per capita consumption of meat, eggs, and dairy products in Inner Mongolia increased by 1.26 times, 1.48 times, and 6.43 times, respectively, from 2000 to 2020. This trend suggests that aside from providing meat and eggs, a significant portion of Inner Mongolia’s livestock farming is targeted at producing milk, which reduces the output of nitrogen products from livestock farming and subsequently lowers N use efficiency49.
Large nitrogen surplus in plant-based foods
As illustrated in Fig. 6, there was a substantial increase in the amount of plant-based food N in Inner Mongolia from 2000 to 2020. The surplus-to-deficit ratio ranged between 74.10% and 92.89%, and the average annual production (295.96 Gg N a−1) significantly exceeded the actual consumption (239.15 Gg N a−1). From 2000 to 2006, the amount of animal-based food N increased yearly, followed by a period of minimal change beginning in 2007. Through the two decades, the surplus-to-deficit ratio for animal-based foods ranged from 62.08% to 77.04%, with an average surplus of 131.45 Gg N year−1. The input of Nr per unit animal (4.62 Gg N year−1) slightly exceeded the output (3.60 Gg N a−1), indicating a large consumption of animal-based foods in Inner Mongolia. The total nitrogen surplus in plant-based foods consistently exceeded that of animal-based foods, with the total nitrogen surplus in plant-based foods being 3.63 times higher than that in animal-based foods in 2020. The total Nr input in the agricultural production system increased by 112% from 2000 to 2020, while the permanent population of Inner Mongolia increased by only around 1.3%. This discrepancy between population growth and Nr input increases within the agricultural production system results in a substantial nitrogen surplus in plant-based foods. In addition, the cropped area increased from 5.665 million hectares in 2000 to 8.883 million hectares in 2020, indicating a growth of approximately 56.80% (Inner Mongolia Bureau of Statistics, 2000–2020). This expansion contributed to a 35.21% increase in the input of Nr in plant-based foods (Fig. 2), which led to a gradual increase in nitrogen surplus.
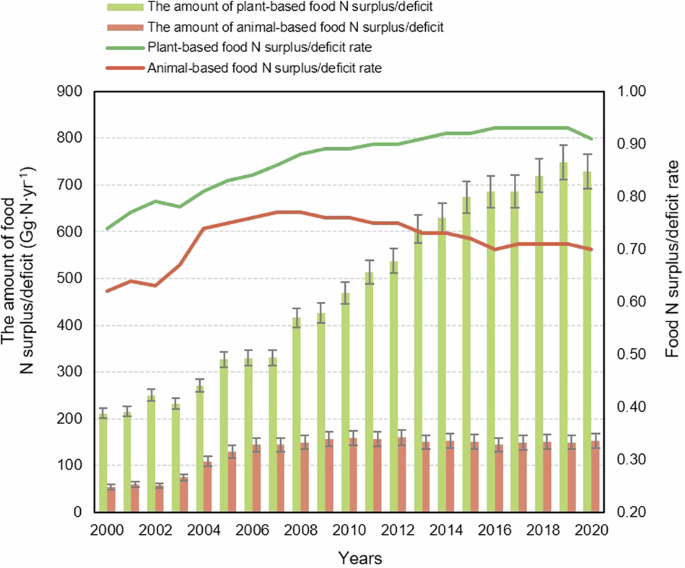
Error bars represent the standard deviation of the mean.
Uncertainty analysis
Due to the difficulties in obtaining data related to food processing, the material flow model did not account for Nr emissions from food processing or Nr emissions from food imports and exports. As a result, the surplus and deficit of nitrogen in food may have been overestimated. Through the past decades, continuous urbanization and economic growth have driven intensive agricultural production, increasing Nr emissions from grain and energy consumption. As time progresses, the demand for Nr will increase further, with agriculture remaining the largest single source of Nr entering the environment. As the economy develops, farmers’ purchasing power for nitrogen fertilizers increases. This change brings higher crop yields but reduces the utilization efficiency of nitrogen fertilizers. The nitrogen flux through the food system also indicates a low nitrogen utilization efficiency50, particularly in animal-based food production. Pollution from Nr generated by energy production continues to rise, highlighting the necessity of enhancing agricultural N use efficiency and reducing energy intensity. From 2000 to 2020, Inner Mongolia experienced a substantial annual nitrogen surplus in plant-based foods within the food production and consumption system. The high rate of nitrogen loss and low utilization efficiency in the food production and consumption system increased environmental nitrogen losses, posing growing risks to water bodies, soil, and the atmosphere. To address these issues, adjustments could be considered in two aspects: (1) improving nitrogen cycling efficiency to reduce environmental losses, such as by reducing straw burning, increasing the application of straw and feces/urine to fields, and enhancing the proportion of material recycling from straw, feces/urine, and kitchen waste; and (2) reducing nitrogen input to alleviate environmental load pressures, such as by reducing the application of chemical nitrogen fertilizers to a reasonable level of 180 kg N hm−2 and rationally decreasing the scale of livestock farming27.
Nitrogen fertilizers, forage nitrogen, and nitrogen in animal-based foods are the primary sources of Nr input in the agricultural production system, livestock farming system, and food consumption system, and nitrogen from harvested straws, nitrogen from meat, and nitrogen from feces/urine constitute the main forms of Nr output from these systems, respectively. The Nr input and output in the agricultural production system, livestock farming system, and food consumption system exhibit an increasing trend from 2000 to 2020, with increases in the unit Nr input in all three subsystems. In Inner Mongolia, N use efficiency in the food consumption system is high, while those in the livestock farming system and agricultural production system are low. There is an apparent nitrogen surplus in plant-based foods, indicating an oversupply of plant-based foods. The Nr in the agricultural production system serves as the primary source of Nr input in the food production and consumption system, while livestock farming reduces nitrogen product output and thus suppresses N use efficiency. The environmental nitrogen load in Inner Mongolia has exhibited a continuous upward trend, largely attributable to the rapid increase in livestock farming. The primary contributor to the increasing environmental nitrogen load is the nitrogen loss of feces/urine. Feces/urine in livestock farming is not recovered or fully utilized, resulting in a large amount of NH3, NOx, N2O and other active nitrogen loss. To realize high-quality development of agriculture and animal husbandry, it is important to pay more attention to adjusting the way of animal husbandry, developing moderately large-scale captive breeding, and constantly improving the level of breeding and management. On the other hand, strengthen the collection, separation and return of livestock manure and urine, deepen the integration of agriculture and animal husbandry, promote the nutrient circulation of agriculture and animal husbandry, and then improve N use efficiency of the agricultural production system and livestock farming system. Third, we should further promote healthy diet, continuously increase the proportion of plant-based foods, and reduce the environmental risks caused by the large surplus of plant-based foods.


Responses