Novel anti-inflammatory properties of mannose oligosaccharides in the treatment of inflammatory bowel disease via LGALS3 modulation
Introduction
Inflammatory bowel disease (IBD) is a complex group of diseases characterized by chronic inflammation and damage in the intestines, which includes both Crohn’s disease and ulcerative colitis1,2,3. The mechanistic factors contributing to the development of IBD involve imbalances in the gut microbiota and impaired intestinal barrier function, leading to abnormal immune system activation and subsequent inflammation4,5. These inflammatory reactions result in clinical symptoms such as pain, diarrhea, and digestive problems and can lead to serious complications like intestinal strictures and perforations6,7,8. The current challenge in IBD treatment lies in the limitations and non-specific actions of existing drug therapies, making the need for the development of more effective and specific treatment strategies crucial9,10.
Mannose oligosaccharides (MOS) have gained wide attention as a potential therapeutic drug with biological activities and immunomodulatory effects11,12. Studies have shown that MOS can modulate immune responses, alleviate oxidative stress, and improve intestinal epithelial cell function, presenting potential capabilities in IBD treatment13. However, current research on the application and mechanisms of MOS in IBD treatment remains relatively limited, necessitating further exploration and validation14,15,16. As a naturally occurring sugar widely used in everyday diets, mannose supplementation has been shown to improve and promote the recovery of colitis17.
Mendelian Randomization (MR) is an advanced causal inference method that utilizes genetic variations as instrumental variables to infer causal relationships between risk factors and disease outcomes, effectively minimizing confounding factors inherent in traditional observational studies18,19,20,21. MR analysis has recently gained popularity for evaluating causal links between exposures and outcomes22. This study employed MR analysis based on Genome-Wide Association Studies (GWAS) to explore the causal relationship between mannose and IBD, which may help elucidate the therapeutic mechanisms of MOS in IBD and provide scientific evidence for its clinical application.
Single-cell RNA sequencing (scRNA-seq) data analysis is an important research method that can reveal differences between different cell types and variations in gene expression23,24,25. In this study, scRNA-seq data analysis was used to study the differences in intestinal cell types and gene expression associated with IBD. This will deepen our understanding of the pathogenesis of IBD and identify potential therapeutic targets.
To identify the key targets of MOS, this study employed network pharmacology analysis. By analyzing interactions within the network, key targets of MOS, including LGALS3, were determined. Furthermore, the study assessed the effects of MOS on intestinal cell viability, oxidative stress, and tight junction protein expression through further experimental validation. This study aimed to determine the potential applications and mechanisms of MOS and its microencapsulated compound GA-MOS in treating IBD, as well as explore their effects on imbalances in the gut microbiota and intestinal barrier damage. Such research is crucial for providing new strategies in IBD treatment and utilizing dysbiosis as a potential therapeutic target, holding significant scientific and clinical significance.
Results
Mannose: a protective factor for IBD
To begin with, the “Mannose” related dataset (met-a-314) was downloaded from the GWAS database (https://gwas.mrcieu.ac.uk/) as the exposure factor, while the “Ulcerative colitis” related dataset (ieu-a-970) and the “Crohn’s disease” related dataset (ieu-a-12) were downloaded as the outcome factors.
First, association analysis identified 540 SNPs related to the exposure factor Mannose, which were selected as instrumental variables (Supplementary Fig. 1A, B). Next, SNPs in linkage disequilibrium were removed. Subsequently, weak instruments were filtered out to reduce bias associated with weak instrumental variables. MR-PRESSO was then used to detect and remove biased SNPs, and after excluding outliers, MR analysis was performed using the selected SNPs.
After removing biased SNPs using the MR-PRESSO test, the MR analysis was performed using the “TwoSampleMR” package in R. The MR analysis included the use of MR-Egger regression, weighted median, IVW, simple mode, and weighted mode methods based on the selected SNPs.
The results of the MR analysis showed a negative association between most SNPs and Mannose with Ulcerative Colitis and Crohn’s Disease. All five analysis methods had slopes less than 0, indicating that an increase in Mannose levels may reduce the risk of Ulcerative Colitis or Crohn’s Disease (Fig. 1A). In the case of Ulcerative Colitis, the MR-Egger, weighted median, and weighted mode methods all had P < 0.05 and OR < 1. For Crohn’s Disease, all methods except for the simple mode had P < 0.05 and OR < 1. These results suggest a significant causal relationship between Mannose and Ulcerative Colitis or Crohn’s Disease (Fig. 1B and Supplementary Table 4). Further analysis using MR-Egger and IVW methods, combining the effect sizes of all SNPs, yielded consistent results (Fig. 1C), further validating the reliability of the MR analysis.

A Scatter plot showing the association between Mannose and outcome factors in the MR analysis. The black dots represent SNPs, while the crosses on the black dots indicate the range of effect sizes (beta values). The horizontal lines represent the range of SNP effects on the exposure factor, and the vertical lines represent the range of SNP effects on the outcome. B Forest plot of MR-Egger and inverse variance-weighted analysis results for Mannose and outcome factors. C Forest plot of MR analysis results for Mannose and outcome factors.
The heterogeneity of MRs was assessed using Cochran’s Q test. The results of the heterogeneity analysis using MR-Egger and IVW methods showed some heterogeneity (Supplementary Fig. 2A), but the results of the multifinality test had P > 0.05 for Ulcerative Colitis (P = 0.154) and Crohn’s Disease (P = 0.127), indicating that the instruments did not exhibit multifinality. Therefore, the analysis results were robust (Supplementary Table 5). Sensitivity analysis using the leave-one-out method showed minimal changes in the causal relationship between the exposure variable and outcome variable, indicating that the set of SNPs did not have excessive influence on the MR analysis. This suggests that the results of this study are robust and reliable (Supplementary Fig. 2B).
In this study, based on GWAS data, we conducted MR analysis and found a causal relationship between Mannose and IBD, with Mannose acting as a protective factor for IBD.
Cellular changes in IBD revealed by scRNA-seq analysis
To investigate the cellular changes in IBD, we first obtained the IBD-related scRNA-seq dataset, GSE231993, from the Gene Expression Omnibus (GEO). We analyzed the colonic tissue cells of healthy control subjects and ulcerative colitis patients using this dataset (Fig. 2A).

A Workflow for single-cell transcriptome data analysis. B UMAP visualization of annotated cells. C UMAP showing the expression of marker genes in different cell subtypes. D Proportional distribution of different cell subtypes across samples, represented by different colors. E Correlation heatmaps showing the top five expressed genes in seven cell types. F Comparison of the total number of signaling pathway interactions and interaction intensity between the Control and IBD groups. G Cell communication network diagram within the samples, where the thickness of the lines represents the number of pathways, and the middle panel represents the interaction strength. H Overview of the involvement of signaling pathways in the Control and IBD groups.
The data were integrated and filtered using the Seurat package, removing low-quality cells. We further analyzed the filtered cells by calculating the cell cycle, normalizing the data, and performing PCA for linear dimensionality reduction (Supplementary Fig. 3A–D). To assess the principal components (PCs), we applied the ElbowPlot method and corrected batch effects using the harmony package. The results showed no significant batch effects after correction (Supplementary Fig. 3E). Subsequently, we performed non-linear dimensionality reduction using the UMAP algorithm on the top 30 principal components and displayed the clustering patterns at different resolutions using the clustree package (Supplementary Fig. 3F). Through UMAP clustering analysis, we classified all cells into 28 cell clusters (Supplementary Fig. 3G).
We then used the SingleR package in Bioconductor/R to annotate these 28 cell clusters automatically. We identified seven cell types, including T/NK cells, B cells, epithelial cells, macrophages, endothelial cells, fibroblasts, and mast cells (Fig. 2B). In addition, we visualized the UMAP plots of the expression of the marker genes for these seven cell types (Fig. 2C). We quantified the proportions of re-annotated cells in each sample (Fig. 2D) and displayed heatmaps of the top five genes in each cell type (Fig. 2E).
To explore the pathway activity between different cell types, we employed the CellChat package in R. The analysis revealed that in the IBD group, both the total number and intensity of pathway interactions decreased (Fig. 2F). However, the interactions between epithelial cells and other immune cells increased (Fig. 2G), and the PARs and GALECTIN signaling pathways were enhanced in the IBD group (Fig. 2H).
In summary, our analysis of the scRNA-seq dataset successfully annotated seven cell types, and in the IBD patient group, there was a general decrease in the total number and intensity of pathway interactions, while the interactions between epithelial cells and other immune cells were enhanced.
Identification of CA2 and LGALS3 as potential target genes for MOS in IBD
In MR analysis, we have identified Mannose as a protective factor for IBD. MOS is a type of oligosaccharide composed of multiple Mannose molecules. MOS are prebiotics extracted from yeast and plants such as pine trees, lilies, and konjac. They have been shown to alter the structure of the intestinal microbiota26 and exhibit various biological functions in the human body, including antiviral, antibacterial, and anticancer activities. In this study, we aim to analyze the therapeutic role of MOS in IBD treatment through the construction of pharmacophore models and molecular docking techniques27.
To begin, we conducted differential analysis on the epithelial cells in a scRNA-seq dataset. The analysis revealed 136 significant DEGs, including 75 upregulated DEGs and 61 downregulated DEGs (Fig. 3A). Functional enrichment analysis of these DEGs using Gene Ontology (GO) revealed significant associations in Biological Process (BP) with B cell-mediated immunity, B cell activation, mitochondrial electron transport, and cytochrome c to oxygen. In Cellular Component (CC) enrichment analysis, significant associations were found with mitochondrial inner membrane, mitochondrial respirasome, and mitochondrial respiratory chain complex IV. Molecular Function (MF) enrichment analysis revealed significant associations with immunoglobulin receptor binding, antioxidant activity, and oxidoreductase activity, acting on peroxide as an acceptor (Fig. 3B). In addition, the Kyoto Encyclopedia of Genes and Genomes (KEGG) pathway analysis showed significant enrichment in Pathways of neurodegeneration—multiple diseases, PPAR signaling pathway, Oxidative phosphorylation, and Citrate cycle (TCA cycle) (Fig. 3C).
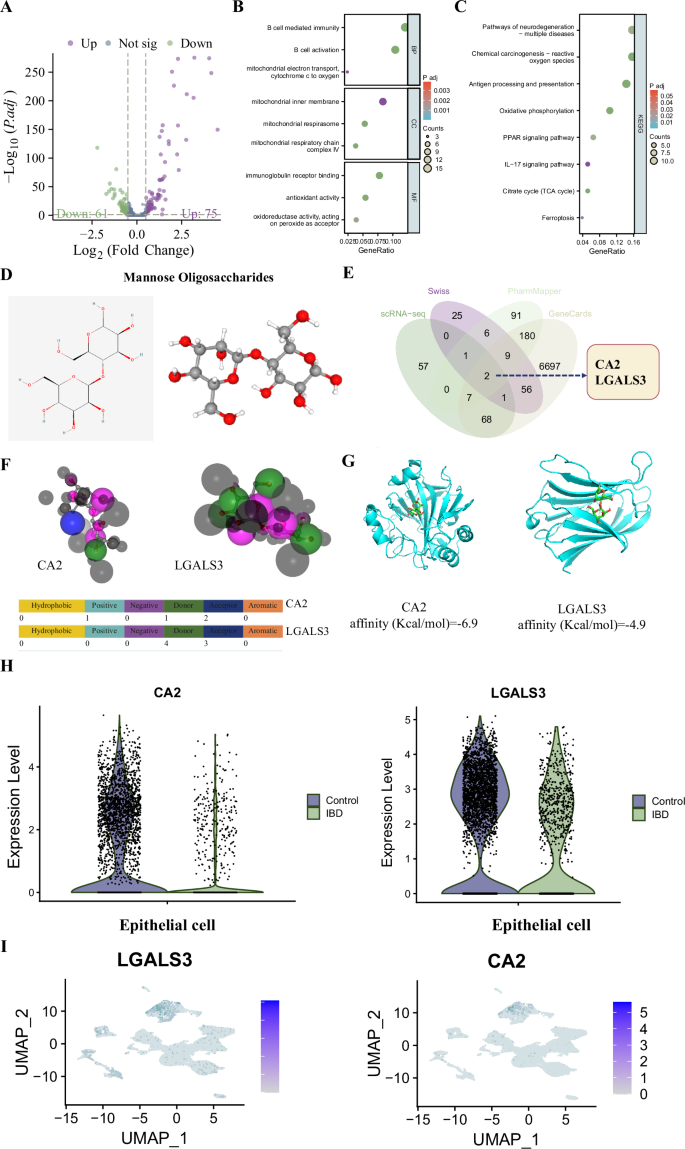
A Volcano plot of DEGs in the scRNA-seq dataset, where red represents significantly upregulated genes, blue represents significantly downregulated genes, and gray represents genes with no significant difference. B, C Functional enrichment analysis of DEGs in GO and KEGG, respectively. D 2D and 3D chemical structure of MOS. E Venn diagram. F Interaction between MOS molecule and CA2 protein and LGALS3 pharmacophore model. G Docking analysis of CA2 with LGALS3 and MOS molecule. H Violin plots of CA2 and LGALS3 expression in the scRNA-seq dataset, where * indicates a significant difference compared to the Control group with P < 0.05. I UMAP plot of CA2 and LGALS3 expression in the scRNA-seq dataset.
To identify the MOS target genes among the DEGs, we utilized the PharmMapper and SwissTargetPrediction databases. The chemical structure of MOS was determined using the PharmMapper database (Fig. 3D), and 298 target genes were identified from the database. An additional 100 MOS target genes were selected through the SwissTargetPrediction database. Using the GeneCards database, a retrieval of 7050 IBD-related genes was performed, and using a filter condition of Relevance score ≥1, 7020 genes were obtained.
By conducting a Venn analysis of the target genes selected from the PharmMapper and SwissTargetPrediction databases, the DEGs identified from scRNA-seq analysis, and the IBD-related genes obtained from the GeneCards database, we identified 2 target genes, CA2 and LGALS3, that are associated with IBD regulation (Fig. 3E).
Analysis of the interaction between MOS molecular structure and the pharmacophore structures of the two target receptors using the PharmMapper database revealed that MOS exhibited 2 acceptor and 1 donor region that interacted with CA2 and 4 donor and 3 acceptor regions that interacted with LGALS3 (Fig. 3F). This information allowed us to construct pharmacophore models of the interactions between candidate genes and MOS molecules, providing a foundation for further analysis.
The molecular docking analysis of the candidate proteins and MOS molecules was performed using software such as AutoDockTools 1.5.6 and Vina 1.5.6. A binding energy lower than 0 kJ/mol indicated spontaneous binding and interaction between the protein and the compound, with a lower binding energy suggesting a more stable molecular conformation28. The results of the docking analysis between the candidate proteins and MOS molecules are shown in Fig. 3G, which visually displays the binding modes between the target protein receptors and the compounds, as well as the interactions with surrounding amino acid residues. The affinity analysis revealed that the binding of CA2 and LGALS3 to MOS was stable.
Furthermore, we analyzed the expression of CA2 and LGALS3 in the scRNA-seq dataset and found that both genes were significantly downregulated in the IBD group, with concentrated expression in the epithelial cells (Fig. 3H, I).
In conclusion, our study identified CA2 and LGALS3 as target genes of MOS that regulate IBD.
The protective effect of MOS on colonic epithelial cells in IBD
Our study not only reveals the potential protective effect of MOS in IBD but also identifies the key target genes CA2 and LGALS3 involved in its action. It has been reported that MOS extracted from yeast, after being subjected to 110 °C heat treatment and 55 °C acid treatment, exhibits cellular biocompatibility29. In our experiment, we successfully processed MOS with 110 °C heat treatment (Fig. 4A). We dissolved MOS in a cell culture medium and incubated it with normal human intestinal epithelial cells (NCM460). We then used PrestoBlue™ (PB) cell viability assay to measure cell activity. PB is a nontoxic, cell-permeable solution based on resazurin, which indirectly determines cell viability by reducing the solution to a fluorescent formazan compound30. Cell toxicity is defined as a metabolic inhibition percentage greater than 30% (ISO 10993-5). The results showed that MOS exhibited cell toxicity at concentrations above 10 mg/mL, while cell metabolism increased in the presence of MOS. Therefore, we chose a concentration of 5 mg/mL for subsequent experiments (Fig. 4B).

A Workflow for MOS preparation. B Assessment of MOS cytotoxicity on NCM460 cells. C Workflow for the preparation and incubation of organoids with NCM460 cells. D Observation of organoid growth, Bar = 500 μm. E Morphological observation of organoids 24 h after stimulation with recombinant TNF-α on the 7th day. Bar = 100 μm. F, G RT-qPCR (F) and western blot (G) analysis of CA2 and LGALS3 expression in cells. H Western blot analysis of JAM-A, Occludin, Claudins (Claudin-2, -4), and E-cadherin expression in cells. I Immunofluorescence detection of ZO-1 expression in cells, followed by observation of cellular connections, where the presence of damaged connections is indicated by white arrows, bar = 50 mm for the upper image. Bar = 15 mm for the lower image. J Western blot analysis of Cl-Caspase3, Caspase3, Cl-Caspase8, Caspase8, and BCL-XL expression in cells. K Flow cytometry analysis of cell apoptosis, with the right image showing the statistical analysis of apoptotic cells. All cell experiments were repeated three times, and values are presented as mean ± standard deviation. *P < 0.05, **P < 0.01.
We isolated crypts from wild-type mice and cultivated them into organoids (Fig. 4C), adding 5 mg/mL of MOS to the culture medium. We observed that the addition of MOS significantly accelerated the growth rate of the organoids (Fig. 4D). Furthermore, we stimulated cells with TNF-α (100 ng/mL) for 24 h to establish a colonic cell inflammation model. We found that the abnormal cell morphology in the MOS-treated group was significantly reduced compared to the TNF- α-treated group (Fig. 4E).
To establish an in vitro cellular model of intestinal inflammation, we stimulated NCM460 cells with TNF-α (100 ng/mL) for 24 h (Fig. 4C). We assessed the expression levels of CA2 and LGALS3 in the cells using RT-qPCR and western blot analysis. The results showed that under TNF-α stimulation, the expression of LGALS3 was significantly decreased, while CA2 expression remained unchanged. However, in the presence of MOS, LGALS3 expression significantly increased (Fig. 4F, G).
Galactose lectins have been shown to play a critical role as regulators of immune cell homeostasis and inflammation by modulating cell survival, signal transduction, chemotaxis, and interfering with the secretion of cytokines31. Galectin-3 regulates T-cell activity and is decreased in colonic epithelial cells during IBD inflammation32. Therefore, we chose LGALS3 as the focus of our subsequent research. We first constructed a knockdown sequence for LGALS3 and validated its knockdown efficiency in NCM460 cells. The results showed that sh-LGALS3-1 (hereinafter referred to as sh-LGALS3) had a higher knockdown efficiency (Supplementary Fig. 4A).
Under physiological conditions, the intestinal epithelium forms a physical and biochemical barrier between luminal bacteria and mucosal immune cells. Abnormal regulation of epithelial cell proliferation and cell death is believed to exacerbate intestinal injury33.
Next, we examined the expression levels of tight junction proteins (including JAM-A, Occludin, Claudin-2, Claudin-4, and E-cadherin) after TNF-α treatment. We found that the expression of Claudin-2 significantly increased after TNF-α stimulation, while the expression of other proteins significantly decreased. Meanwhile, incubation with MOS significantly decreased Claudin-2 expression and increased the expression of other proteins. The therapeutic effect of MOS was reversed by sh-LGALS3 (Fig. 4H).
Zonula Occludens-1 (ZO-1) plays a crucial role in maintaining the structure and function of tight junctions in intestinal epithelial cells. We further observed the cell connections through immunofluorescence staining of ZO-1. The results showed that TNF-α stimulation disrupted the cell connections, but the addition of MOS was able to repair this damage. However, when LGALS3 was knocked down, the damage to the epithelial cells was aggravated (Fig. 4I).
The expression levels of apoptotic markers were detected by western blot, revealing that TNF-α stimulation increased the expression of cleaved caspase-3 and cleaved caspase-8 while inhibiting BCL-XL expression. MOS alleviated cell apoptosis, but knocking down LGALS3 resulted in increased apoptosis (Fig. 4J). Flow cytometry analysis confirmed this effect (Fig. 4K).
In summary, our experiments demonstrate that MOS can mitigate the structural damage and apoptosis of intestinal epithelial cells induced by TNF-α by increasing LGALS3 expression.
MOS mitigates TNF-α-induced oxidative stress in colonic epithelial cells
Our research revealed the significant role of MOS in alleviating the structural damage and apoptosis of intestinal epithelial cells induced by TNF-α. It is widely recognized that the expression levels of various inflammatory factors increase in IBD and play a crucial role in the inflammatory process. We used RT-qPCR to detect the expression levels of pro-inflammatory and chemotactic factors such as IL-6, IL-1β, CXCL5, and CX3CL1. The experimental results showed that MOS significantly reduced the expression levels of these factors induced by TNF-α, and this effect could be reversed by knocking down LGALS3 (Fig. 5A).

A RT-qPCR analysis of IL-6, IL-1β, CXCL5, and CX3CL1 expression in cells. B Flow cytometry analysis of ROS levels in cells, with the corresponding bar graph shown on the right. C Measurement and quantification of cellular ROS (green) and mtROS (red) in intestinal epithelial cells, with a scale bar of 25 μm, and the corresponding bar graph shown on the right. D Evaluation of lipid peroxide formation in liver cells by fluorescence BODIPY staining and FACS analysis (right panel). E Assessment of cellular NO release using the Griess method. F, G Detection of the iron death-specific markers MDA (F) and GSH (G) in intestinal epithelial cells. H, I Analysis of CAT (H) and SOD (I) expression in cells. All cell experiments were performed in triplicate, and data are presented as mean ± standard deviation. *P < 0.05, **P < 0.01, and ***P < 0.001.
Currently, it is generally believed that exacerbated inflammation can induce Reactive Oxygen Species (ROS) in the pathogenesis of IBD, further enhancing colonic injury34. At the same time, DEGs in the scRNA-seq dataset were significantly enriched in the oxidative stress signaling pathway. Therefore, we assessed ROS activity in mitochondria by flow cytometry to evaluate the exacerbation of ROS. We found that TNF-α stimulation significantly increased ROS levels, while incubation with MOS significantly reduced ROS levels, and knocking down LGALS3 increased ROS levels again (Fig. 5B). In addition, we used 2’,7’-DCFH-DA fluorescence to detect total intracellular ROS levels and mitochondrial ROS levels, which yielded similar results (Fig. 5C).
C11-BODIPY staining for lipid peroxidation showed a significant increase in lipid peroxidation under TNF-α stimulation, while MOS significantly reduced this lipid peroxidation, which was reversed by knocking down LGALS3 (Fig. 5D). Furthermore, we measured the release of nitrites using the Griess method and found that MOS alleviated the increase in NO release caused by TNF-α while knocking down LGALS3 reversed this therapeutic effect (Fig. 5E).
Finally, we measured the levels of Malondialdehyde (MDA), reduced Reduced Glutathione (GSH), catalase CAT, and Superoxide Dismutase (SOD) in cells. The results showed that under TNF-α stimulation, GSH, CAT, and SOD levels significantly decreased, while MDA levels significantly increased. However, MOS effectively treated these effects induced by TNF-α, and knocking down LGALS3 reversed the therapeutic effect of MOS (Fig. 5F–I).
In conclusion, we can infer that MOS can alleviate oxidative stress in intestinal epithelial cells under TNF-α stimulation by increasing the expression of LGALS3.
Development and evaluation of GA-MOS microcapsules for alleviating TNF-α induced oxidative stress and inflammation
Based on the above experimental results, our study indicates that MOS plays a crucial role in alleviating TNF-α-induced oxidative stress and inflammatory response in intestinal epithelial cells. Ulcerative colitis is primarily characterized by dysbiosis of the intestinal microbiota, reduced mucous, and damage to the tight junctions of the epithelium35,36,37. The aim of this research was to develop a biologically active microcapsule compound and assess its potential application in alleviating TNF-α-induced oxidative stress and inflammatory response in intestinal epithelial cells.
GA is a water colloid polysaccharide with low levels of protein and acts as a suitable emulsifier. It exhibits high water solubility and film-forming properties38,39. GA also helps reduce moisture absorption and agglomeration, improving the physicochemical properties of the obtained powder38,39. Using GA as the carrier of the microcapsule has health-associated properties such as prebiotic characteristics, dietary fiber action, and other health-related benefits40.
We prepared a mixture of 20% MOS and 10% GA (GA-MOS) in distilled water and then processed it using spray drying at 160 °C (Fig. 6A).

A Schematic diagram of GA-MOS preparation. B Schematic diagram of IBD mice treatment. C Recording of body weight changes in mice during continuous treatment for 9 days. D Daily changes in DAI. E Illustration of colons harvested from mice after 9 days of continuous treatment. F Length of colons in different groups of mice. G H&E staining of colon tissues, black arrows indicate inflammatory cells, top image bar = 500 μm, bottom image bar = 100 μm. H AB/PAS staining images of colon tissues, black arrows indicate mucus proteins, top image bar = 500 μm, bottom image bar = 100 μm. I H&E staining of spleen tissues, black arrows indicate inflammatory cells, bar = 100 μm. J Immunofluorescence detection of ZO-1, occludin, and LGALS3 expression in colon tissues, bar = 100 μm, the right image shows the statistical analysis of positive cells. K western blot analysis of ZO-1, Occludin, and LGALS3 expression in colon tissues. Each group consisted of six mice, and values are presented as mean ± standard deviation. *P < 0.05, **P < 0.01, and ***P < 0.001.
As shown in Supplementary Fig. 5A, the XRD spectra of all representative samples exhibited broad diffraction peaks, indicating the amorphous structure of the powder. Compared to the crystalline components, amorphous solids have lower energy levels between bonds and molecules, resulting in good solubility. The observed particle surface morphology in SEM clearly illustrated the hollow shape of GA, suitable for the microencapsulation of bioactive compounds. The increase in surface roughness could reduce the adhesion force between two contact surfaces. GA-MOS particles dried at a relatively moderate temperature exhibited a more shriveled appearance (Supplementary Fig. 5B). FT-IR revealed the same characteristic bands, confirming that no chemical reaction occurred between GA and GA-MOS during the spray drying process (Supplementary Fig. 5C). This suggests that GA is an inert carrier suitable for producing MOS powder.
We investigated the biocompatibility of GA-MOS in vitro and in vivo through cell viability, serum biomarkers, and histopathological observations. Firstly, we incubated NCM460 cells with various concentrations of GA-MOS and observed that the different concentrations did not significantly affect cell viability (Supplementary Fig. 5D), indicating that GA-MOS does not influence the growth of NCM460 cells. GA-MOS demonstrated good biocompatibility with cells in vitro.
Furthermore, we examined the effects of high-dose GA-MOS (1000 mg/kg/d) on mice by evaluating serum biomarkers and histopathology in normal mice. ALT and AST levels represent liver function, while BUN and Cr levels represent kidney function. After oral administration of GA-MOS for 28 days, there were no statistically significant differences in serum ALT, AST, BUN, and Cr levels between the GA-MOS treatment group and the normal group of mice (Supplementary Fig. 5E, F). The hearts, livers, spleens, lungs, and kidneys of mice in the GA-MOS treatment group showed no significant changes compared to those in the normal group. The pericardium exhibited a clear structure, and the morphology of the heart wall, ventricle, myocardial fibers, and interstitium were normal. Endothelial cells and cardiomyocytes were intact and orderly. The liver lobules and hepatic sinusoids displayed a clear structure, and the morphology of liver parenchymal cells was normal. The spleen appeared normal in size, without enlargement or signs of inflammatory disease. The alveoli in the lungs were uniform and well-spaced, without inflammation. The glomeruli in the kidneys showed no fibrosis, and the renal tubules were not dilated (Supplementary Fig. 5G). These findings indicate that a high dose of GA-MOS does not affect the organs of normal mice.
In conclusion, we successfully developed a novel microcapsule compound, GA-MOS, that exhibits good biological activity and safety.
Therapeutic effects of GA-MOS on DSS-induced colitis in mice
To gain a deeper understanding of the potential therapeutic application and mechanism of action of the GA-MOS composite that we prepared for the treatment of IBD, we first established an experimental mouse model of IBD induced by dextran sulfate sodium (DSS, 3.5%). This model mimics the clinical pathological features of IBD. In this model, mice were continuously exposed to DSS in their drinking water for 7 days to induce colitis. After the successful construction of the IBD model, we orally administered different doses of GA-MOS to the IBD group of mice for 9 days using the force-feeding method. The optimal dose was determined through the evaluation of body weight changes and Disease Activity Index (DAI). The results showed that doses of 200 mg/kg/d and 250 mg/kg/d had similar therapeutic effects, and thus, we selected 200 mg/kg/d as the optimal dose (Supplementary Fig. 6A, B).
Next, we further evaluated the therapeutic effects of GA-MOS on IBD mice by feeding them with MOS (200 mg/kg/d), GA-MOS (200 mg/kg/d), or the same volume of physiological saline for 9 days (Fig. 6B).
The IBD model mice exhibited typical pathological features, including significant weight loss, increased DAI, and shortened colon length. However, both GA-MOS and MOS treatment improved these IBD symptoms, with GA-MOS demonstrating significantly better efficacy than MOS alone (Fig. 6C–F).
We examined histopathological sections of the colon tissue. H&E and AB/PAS staining images of the colon tissue revealed evident colonic injury and inflammatory infiltration in DSS-induced colitis mice. The mucin content on the inflamed colonic mucosa demonstrated a significant decrease, which was associated with severe depletion of goblet cells. Notably, the colon tissue morphology of the GA-MOS treatment group resembled that of healthy mice. In addition, GA-MOS treatment showed ideal promotion of mucin secretion recovery. Meanwhile, we found that MOS treatment alone had certain therapeutic effects on mice but was not as effective as GA-MOS treatment (Fig. 6G, H).
Furthermore, we observed significant exacerbation of spleen inflammation in DSS-treated mice, with a substantial increase in red pulp extramedullary hematopoietic cells and significant accumulation of lymphocytes and granulocytes (Fig. 6I).
Through immunofluorescence and Western blot analysis, we investigated the expression of tight junction proteins ZO-1, occludin, and LGALS3. The results showed that DSS treatment significantly reduced the expression of these proteins. However, both MOS and GA-MOS treatments increased the expression of ZO-1, occludin, and LGALS3, with GA-MOS exhibiting superior efficacy compared to MOS alone (Fig. 6J, K).
In summary, we found that GA-MOS had significantly better therapeutic effects than MOS in DSS-induced colitis mice while also significantly increasing the expression of LGALS3 in colon tissue.
Mechanistic insights into the therapeutic effects of GA-MOS in IBD: activation of LGALS3 and attenuation of oxidative stress
In in vitro cell experiments, we explored the therapeutic effect of GA-MOS on IBD, particularly its mechanism of reducing oxidative stress through activating LGALS3. Furthermore, we confirmed that MOS could induce an increase in LGALS3 expression, thereby alleviating oxidative stress in intestinal epithelial cells. To investigate the mechanism of GA-MOS further, we constructed a knockdown sequence for mouse-derived LGALS3 and verified its knockdown efficiency through tail vein injection. The results showed that sh-LGALS3-2 (hereafter referred to as sh-LGALS3) exhibited excellent knockdown efficiency (Supplementary Fig. 4B). Subsequently, we evaluated its in vivo rescue effect by intravenous injection of sh-LGALS3 (Fig. 7A). By measuring the mouse weight, DAI increase, colon length, and histological images of colon tissue stained with H&E and AB/PAS, we observed that knocking down LGALS3 could reverse the therapeutic effect of GA-MOS (Supplementary Fig. 7).

A Schematic diagram illustrating different treatment groups. B–D Levels of TNF-α, IL-6, and IL-1β in mouse serum measured by ELISA. E Immunohistochemical assessment of TNF-α, IL-6, and IL-1β levels in colonic tissue, with a bar length of 50μm; the right graph shows cell count of positive staining. F Immunofluorescent detection of 4-HNE and 8-OHdG levels in colonic tissue, with a bar length of 100 μm; the right graph shows cell count of positive staining. G Immunohistochemical assessment of MPO and Ki-67 levels in colonic tissue, with a bar length of 50 μm; the right graph shows cell count of positive staining. H–J Determination of MDA, CAT, and SOD levels in serum. Each group comprised six mice, and values are presented as mean ± standard deviation. *P < 0.05, **P < 0.01, and ***P < 0.001.
Using immunohistochemistry and enzyme-linked immunosorbent assay (ELISA), we measured the levels of TNF-α, IL-6, and IL-1β in different mouse groups. The results demonstrated that GA-MOS treatment effectively suppressed local inflammation levels, whereas the levels of inflammatory factors increased significantly after knocking down LGALS3 (Fig. 7B–E).
4-hydroxynonenal (4-HNE) and 8-hydroxy-2’-deoxyguanosine (8-OHdG) are typical biomarkers of oxidative stress41. Elevated levels of 4-HNE and 8-OHdG were detected in the inflamed colonic mucosa of IBD mice. In contrast, the GA-MOS treatment group exhibited a significant decrease in the expression of 4-HNE and 8-OHdG, indicating that GA-MOS had a strong ROS scavenging ability in the inflamed colon. Knocking down LGALS3 reversed the therapeutic effect of GA-MOS (Fig. 7F).
Myeloperoxidase (MPO) is predominantly secreted by neutrophils, which are commonly used as important biomarkers of inflammation42. Ki-67 is often used as a biomarker to identify proliferating cells in tissues. Based on immunohistochemistry staining images, the GA-MOS group had the lowest number of MPO and Ki-67 positive cells, while the IBD group and the LGALS3 knockdown group had relatively higher numbers. The MOS treatment group alone reduced the levels of MPO and Ki-67 compared to the control group, but it was higher than the GA-MOS group (Fig. 7G).
To further study the antioxidant effects of GA-MOS, we further measured the levels of several biomarkers (MDA, CAT, and SOD) in the serum. Compared to the IBD and MOS groups, the GA-MOS group showed a significant decrease in MDA levels and a significant increase in SOD and CAT activity, indicating that this treatment effectively inhibited oxidative stress in IBD. In addition, knocking down LGALS3 reversed the therapeutic effect of GA-MOS (Fig. 7H–J).
From these findings, we can conclude that GA-MOS alleviates oxidative stress and treats IBD by inducing LGALS3 expression.
Restoring gut microbiota diversity and firmicutes abundance in IBD treatment
Patients with IBD experience dysbiosis in their gut microbiota43,44. In this study, we performed 16S rRNA sequencing analysis on fecal samples from IBD mice (referred to as the IBD group) and mice treated with GA-MOS (referred to as the Treat group) (Fig. 8A). First, we estimated alpha diversity and beta diversity by aligning the sequences. The analysis of alpha diversity using rarefaction curves revealed that as the percentage of samples increased, the rate of increase in richness decreased, eventually reaching a saturation point. Moreover, the Treat group exhibited significantly higher gut microbial diversity compared to the IBD group (Fig. 8B). There were significant differences in the alpha diversity indices Richness index and Chao1 index between fecal samples of the IBD group and Treat group (Fig. 8C, D). The Shannon and ACE indices were used to assess the alpha diversity (abundance and diversity) of the bacterial communities in the gut microbiota (Supplementary Fig. 8A, B), and all the above results indicated significant differences in the alpha diversity of the gut microbial communities between the two groups.

A Schematic diagram illustrating the 16 s rDNA sequencing process. B Rarefaction curve of intestinal microbiota alpha diversity in Treat (n = 6) and IBD (n = 6) samples. C, D Alpha diversity analysis of intestinal microbiota in Treat and IBD groups, C represents the Richness index, and D represents the Chao1 index. E CoA of intestinal microbiota in Treat and IBD groups. F Volcano plot comparing the abundance differences between Treat and IBD groups. G, H Stacked bar plots showing the relative abundance at the Phylum (G) and Genus (H) levels, with different colors representing different phyla of intestinal microbiota. I Cladogram showing the species abundance of intestinal microbiota in Treat and IBD groups; the circles radiating from the center represent the taxonomic levels from phylum to genus, and the diameter represents the relative abundance, with yellow nodes indicating non-significant species, red nodes indicating higher abundance of microbiota in the IBD group, and green nodes indicating higher abundance of microbiota in the Treat group. J Distribution histogram of LDA values representing the species abundance of intestinal microbiota in Treat and IBD groups, Treat group, n = 6; IBD group, n = 6. K Prediction of KEGG functional enrichment using PICRUSt. L Gas chromatography detection of the concentration of propionate, butyrate, and acetate in mouse feces, with six mice in each group, values are expressed as mean ± standard deviation, **P < 0.01.
Next, we conducted a Venn analysis on the Amplicon Sequence Variants (ASVs) enriched in the IBD group and the Treat group. The results showed that the IBD group had approximately half the number of predicted ASVs compared to the Treat group, with 42 ASVs being unique to the Treat group (Supplementary Fig. 8C).
Beta diversity is an indicator of differences in species composition among communities. We calculated the beta diversity distance matrix using the Bray–Curtis index and generated a heatmap based on the Bray–Curtis distance (Supplementary Fig. 8D). PCoA based on the Bray–Curtis distance revealed a distinct separation between the two groups (Fig. 8E). Furthermore, we analyzed the composition of species and identified significant differences in operational taxonomic units (OTUs) at the phylum level between the three groups using the R package edgeR. The Manhattan plot displayed significant differences in the abundance of OTUs between the Treat group and the IBD group (Supplementary Fig. 8E). In addition, a heatmap revealed 42 significantly depleted OTUs and 44 significantly enriched OTUs in the Treat group as compared to the IBD group (Fig. 8F).
Moreover, we conducted a preliminary analysis of the species composition at the phylum, class, order, family, and genus levels. There were significant differences in the composition of the gut microbiota at all five levels. Specifically, Bacteroidetes were more abundant in the IBD group, while Firmicutes were more abundant in the Treat group at the phylum level (Fig. 8G). At the class level, Bacteroidia were more abundant in the IBD group, whereas Clostridia were more abundant in the Treat group (Supplementary Fig. 8F). At the order level, Bacteroidales were more abundant in the IBD group, while Clostridiales were more abundant in the Treat group (Supplementary Fig. 8G). At the family level, Bacteroidaceae and Enterobacteriaceae were more abundant in the IBD group, whereas Muribaculaceae and Lachnospiraceae were more abundant in the Treat group (Supplementary Fig. 8H). At the genus level, PseudEscherichia was more abundant in the IBD group, while Phocaelcola and Duncaniella were more abundant in the Treat group (Fig. 8H). At the species level, the dominant species were Lactobacillus muris and Lactobacillus acidophilus. In the Treat group, the increase in probiotics such as Lactobacillus reuteri and Bifidobacterium longum reflected the recovery of the gut microbiota following treatment (Supplementary Fig. 8I).
To investigate specific differences in species abundance between the Treat and IBD groups, we performed LEfSe analysis and visualized the results. The LEfSe analysis showed a significantly higher relative abundance of Firmicutes, Clostridiales, Clostridia, Lachnospiraceae, and Romboutsia in the fecal samples of the Treat group compared to the IBD group (LDA score (log10) >3, with the IBD group depicted in red and the Treat group in green). In contrast, Proteobacteria, Bacteroides, Betaproteobacteria, Rikenellaceae, and other taxa were more abundant in the IBD group (Fig. 8I, J).
Furthermore, we used the STAMP software to compute and visualize the differences in species abundance at the five levels. Firmicutes exhibited the most significant changes at the phylum level, while Kineothrix showed the most significant changes at the genus level. In addition, at the species level, the probiotics Lactobacillus acidophilus, Lactobacillus reuteri, and Bifidobacterium longum were significantly higher in the Treat group compared to the IBD group (Supplementary Fig. 9).
Functional predictions were conducted using PICRUSt, and KEGG enrichment analysis revealed significant increases in signal pathways related to Bacterial chemotaxis, Amino acid metabolism, Bacterial motility proteins, Fatty acid elongation in mitochondria, and VEGF signaling pathway in the Treat group. In the IBD group, signal pathways such as Lipoic acid metabolism and Secondary bile acid biosynthesis were increased (Fig. 8K).
The results indicate significant differences in gut microbiota diversity between the Treat and IBD groups. Specifically, Bacteroides, a genus of bacteria, was significantly reduced in the Treat group, while Firmicutes, another major bacterial phylum, showed a significant increase. Firmicute is a diverse bacterial phylum consisting of numerous known species, primarily characterized by their Gram-positive features45,46,47.
To explore the specific metabolites of Firmicutes in mice, we searched the gutMGene database (http://bio-annotation.cn/gutmgene/home.dhtml) and found that the main metabolite of Firmicutes is propionic acid (Supplementary Table 6). Propionic acid is a short-chain fatty acid that has been shown to reduce intestinal inflammation48,49,50. It exerts its effects by influencing the functionality of immune cells, such as dendritic cells and macrophages, thereby reducing the production of inflammatory factors51,52.
To verify our findings, we measured the levels of short-chain fatty acids (propionate, acetate, and butyrate) using gas chromatography on fecal samples from mice. The results showed that GA-MOS treatment significantly increased the level of propionic acid (Fig. 8L).
In summary, our results indicate that GA-MOS treatment significantly restores the diversity (richness and evenness) of the gut microbiota and increases the relative abundance of health-associated bacteria such as Firmicutes to treat IBD.
Discussion
IBD is a prevalent and serious gastrointestinal disorder with increasing incidence worldwide53,54,55. However, the current treatment of IBD still faces numerous challenges56,57. Research indicates that dysbiosis of the gut microbiota and impairment of the intestinal barrier play important roles in the development and progression of IBD5,58,59. Consequently, the search for novel approaches to treat IBD has become a prominent topic of investigation60,61.
Previous studies have explored the mechanism of action of MOS in ameliorating oxidative stress in intestinal epithelial cells and improving gut microbiota dysbiosis62,63,64. By alleviating oxidative stress response, reducing intestinal inflammation, and protecting intestinal barrier function, MOS has shown potential in the treatment of IBD64,65,66. However, the current understanding of the association between MOS and IBD still requires further in-depth investigation67,68.
This study employed MR to validate the causal relationship between mannose and IBD. The results demonstrated a significant association between mannose intake and the risk of IBD, indicating a reliable and well-supported finding by the robustness of MR methodology. These findings provide a strong foundation for further exploration of the role of mannose in treating IBD.
Using scRNA-seq and network pharmacology analysis, this study confirmed the target molecule LGALS3 for MOS and further investigated its mechanism in improving gut dysbiosis and intestinal barrier damage. Previous studies have shown that MOS can promote the diversity of gut microbiota, including Akkermansia and Bacteroides species, and inhibit certain pathogens such as Proteus. MOS also enhances the recovery of the gut microbiome after antibiotic treatment69. LGALS3 can be cleaved as a substrate of MMP7, thereby inhibiting intestinal wound healing in IBD patients and damaging the intestinal barrier70. Unlike previous studies, this research revealed the mechanism of MOS more comprehensively and precisely.
In in vitro experiments, MOS exhibited significant effects on normal human intestinal epithelial cells (NCM460) by promoting increased cell viability, reducing the degree of oxidative stress, and altering the expression of tight junction proteins. Mannose improves the progression and promotes the recovery of colitis by inhibiting pathological endoplasmic reticulum stress in intestinal epithelial cells through the normalization of protein N-glycosylation17. These results further validate the antioxidant and intestinal barrier-protective properties of MOS.
In in vivo experiments, GA-MOS treatment in DSS-induced IBD mice models significantly alleviated the level of inflammation, reduced oxidative stress, and affected the expression of tight junction proteins. These results corroborate the findings from in vitro experiments and further confirm the potential of MOS in treating IBD.
Utilizing 16S rRNA sequencing analysis, this study revealed an improvement in gut microbiota diversity and an increase in the relative abundance of health-associated bacteria following GA-MOS treatment. Previous studies have also shown that MOS, as a prebiotic, can increase gut microbiota with anti-inflammatory properties. The intake of MOS reduces the Firmicutes/Bacteroidetes ratio and can reverse the changes in the relative abundance of several species caused by a high-fat diet (HFD), including the anti-inflammatory gut bacteria Lactobacillus acidophilus, Lactobacillus reuteri, and Bifidobacterium longum71,72,73. MOS can increase the proportion of Clostridium pasteurianum, Lactobacillus acidophilus, Phascolarctobacterium, and Bifidobacterium longum in the gut microbiota, reshaping the microbiome and enhancing SCFA formation in AD patients, thus improving severe brain responses74. MOS significantly increases the relative abundance of gut microbiota with anti-inflammatory properties, further demonstrating that MOS can improve gut health by modulating the composition of the gut microbiota.
To summarize, this study discovered that GA-MOS effectively improves IBD symptoms, including alleviating oxidative stress in intestinal epithelial cells, restoring gut microbiota diversity, and increasing the abundance of health-associated bacteria (Fig. 9). The scientific and clinical value of this study lies in elucidating the potential applications and mechanisms of MOS and its encapsulated compound GA-MOS in IBD treatment. Initially, the study revealed a possible causal relationship between mannose and IBD through MR studies and genetic correlation analyses. Further scRNA-seq analysis revealed differences in intestinal cell types and gene expression in IBD, providing insights into the potential mechanisms of mannose in regulating cellular function. Through network pharmacology analysis and experimental validation, this research identified LGALS3 as the target of MOS, indicating its role in improving oxidative stress in intestinal epithelial cells and modulating imbalances in the gut microbiota. In vitro experiments demonstrated that MOS enhances the vitality of intestinal epithelial cells, alleviates oxidative stress, and enhances the expression of tight junction proteins. In addition, in vivo experiments showed that GA-MOS treatment significantly improves symptoms of DSS-induced IBD, including reducing inflammation and oxidative stress and enhancing the expression of tight junction proteins. Consequently, this study reveals the potential of MOS and its encapsulated compound GA-MOS in improving gut dysbiosis and intestinal barrier damage in IBD by inducing the expression of LGALS3. This provides a novel strategy for IBD treatment, with a particular focus on targeting gut dysbiosis to comprehensively modulate the gut environment.

Molecular mechanism diagram of GA-MOS in the treatment of IBD by inducing LGALS3 expression to alleviate oxidative stress and increase gut microbiota abundance (Created with BioRender.com).
However, this study has several limitations. First, the findings are based solely on mouse models, necessitating further clinical research to validate the efficacy and safety of MOS in humans. Second, the study primarily focuses on the mechanisms and effects of MOS without exploring its metabolic pathways and pharmacokinetics. In addition, the research relies on the analysis of public datasets, which, despite providing valuable insights, may not fully capture the complex and diverse pathophysiological characteristics of IBD. Therefore, more comprehensive sequencing data from IBD patients are needed to enhance the understanding of the disease. Furthermore, optimal dosage and timing for MOS treatment require further investigation. Looking ahead, future studies should delve deeper into the mechanisms of MOS, particularly its interaction with LGALS3 and its impact on gut microbiota dysbiosis. The potential of combined treatments involving immunoregulation and anti-inflammatory drugs should also be explored. Finally, optimizing the microencapsulation of MOS could improve its stability and biocompatibility.
Methods
GWAS data sources
Summary data from genome-wide association studies (GWAS) related to exposure and outcomes in European populations were extracted from publicly available databases (IEU Open GWAS database: https://gwas.mrcieu.ac.uk/) and used for MR analysis. The dataset related to “Mannose” (met-a-314) was used as the exposure factor, while the datasets related to “Ulcerative colitis” (ieu-a-970) and “Crohn’s disease” (ieu-a-12) were used as outcome factors. Detailed summary information can be found in Supplementary Table 175.
MR analysis
MR analysis was carried out to investigate the causal relationship between mannose levels and IBD (ulcerative colitis and Crohn’s disease). Five commonly used MR methods were employed: inverse variance-weighted (IVW) test76, weighted median77, MR-Egger regression78, weighted mode-based estimator (WME)79, and MR-PRESSO80.
We identified single-nucleotide polymorphisms (SNPs) that were independently associated with the exposure factor and used them as instrumental variables to assess the causal relationship between exposure and outcome. The selection of independent SNP considered the following criteria: (1) significance threshold with P < 5.0 × 10⁻⁸ for strong correlation with exposure; (2) requirement of r2 < 0.001 and distance >10,000 kb in pairwise linkage disequilibrium (LD) as criteria for independence; (3) evaluation of instrument strength using the F-statistic, where an F-statistic >10 indicated no weak instrument bias81.
First, association analysis was conducted using the “gwasglue” package, with the P value set at 5e-05, identifying 540 SNPs related to the exposure factor, Mannose, as instrumental variables. Next, the identified SNPs were processed using the R package “TwoSampleMR” to remove linkage disequilibrium (LD) SNPs, with the filtering conditions set as kb = 10,000 and r2 = 0.001, resulting in 64 SNPs. Subsequently, filtering was performed based on F > 10 to remove weak instruments, thereby reducing bias from weak instrumental variables. MR-PRESSO was then employed to detect and remove biased SNPs, excluding outliers. Using the selected SNPs, MR analysis was conducted through the “TwoSampleMR” package in R, employing MR-Egger regression, Weighted Median, Inverse Variance Weighted (IVW), Simple Mode, and Weighted Mode methods.
Subsequently, a series of sensitivity analyses were performed to validate the robustness and reliability of the univariable MR analysis. The MR Steiger test was utilized to verify the correctness of the causal hypothesis. The five MR methods separately estimated the causal relationship between the exposure factor and the outcome factor. Cochran’s Q statistic was employed in the IVW and MR-Egger models to assess heterogeneity among SNPs, considering significance when P < 0.05. MR-PRESSO, MR-Egger, and IVW methods were applied to identify and remove potential outliers that might cause pleiotropy. A P > 0.05 indicated no presence of pleiotropy, whereas a P < 0.05 suggested its existence, indicating that instrumental variables influence the outcome through factors beyond the exposure factor. MR-Egger regression was utilized in the univariable MR analysis to identify potential pleiotropy. In IVW analysis, a leave-one-out sensitivity test was conducted to determine if individual SNP altered the overall effect estimate of all SNPs82.
scRNA-seq data acquisition and analysis
We obtained and analyzed the scRNA-seq dataset GSE231993, which is associated with IBD from Gene Expression Omnibus (GEO, https://www.ncbi.nlm.nih.gov/geo/). This dataset comprises colon tissue cells from healthy control participants (GSM7307094, GSM7307095, GSM7307096, GSM7307097) and patients with ulcerative colitis (GSM7307098, GSM7307099, GSM7307100, GSM7307101). The data were analyzed using the “Seurat” package in R software. Quality control was performed on the data based on the criteria: 200 < nFeature_RNA < 5000 and percent.mt <20. In addition, highly variable genes, ranked by variance, were filtered to the top 2000 genes83.
To reduce dimensionality, principal component analysis (PCA) was conducted using the top 2000 highly variable genes. The first 20 principal components were selected for downstream analysis based on the Elbowplot function in the Seurat package. FindClusters function, provided by Seurat, was utilized to identify major cellular subgroups, with the resolution set at the default value (res=1). Subsequently, the t-SNE algorithm was employed for the non-linear dimensionality reduction of the scRNA-seq data. Seurat package was used to identify marker genes for various cell subgroups. Furthermore, known lineage-specific marker genes and the CellMarker database (http://xteam.xbio.top/CellMarker/) were used for cell annotation84.
For intercellular communication analysis, the “CellChat” package in R language was employed. In addition, the “limma” package in R software was utilized to identify differentially expressed genes (DEGs) in the epithelial cells of the scRNA-Seq dataset85.
The target gene screening of MOS
The 3D chemical structure of MOS was obtained from the PubChem database (https://pubchem.ncbi.nlm.nih.gov/) and saved in the “SDF” format. Multiple prediction methods were combined to improve the reliability of target prediction. The SDF format file of MOS was uploaded to the PharmMapper and SwissTargetPrediction servers. The simulation of molecular docking between MOS and target proteins was performed using the reverse docking servers PharmMapper and SwissTargetPrediction. The target range was set as “Human Protein Targets Only,” with the remaining parameters set to their default values86.
Molecular docking
The crystal structures of two selected candidate proteins, CA2 (PDB ID: 1CIM) and LGALS3 (PDB ID: 1KJL), were downloaded from the Protein Data Bank (https://www.rcsb.org). The structure of the MOS compound was downloaded from the PubChem database, and the Chem3DUltra 14.0 software was used to convert the compound structure into a three-dimensional structure. The MM2 algorithm was employed to perform energy minimization for the compound. The four target protein receptors were processed using the PyMOL software by dehydrating and removing organic compounds. The AutoDockTools 1.5.6 software was used for hydrogenation and charge calculation of the target protein receptor molecules. Both the compound and the target protein receptors were converted into “pdbqt” files, and appropriate box centers and grid parameters were set. Finally, the Vina 1.5.6 software was utilized to evaluate the molecular docking by calculating the docking energy values86.
Preparation of MOS
MOS was purchased from Yingxin Laboratory (Shanghai, China) and extracted from brewing yeast (70858-45-6). The MOS was then subjected to a 3-h treatment at 110 °C using a water bath. The treated MOS was dissolved directly in RPMI culture medium supplemented with antibiotics and sterilized using a sterile syringe (0.22-µm pore size, Millipore, Billerica, MA, USA)29.
Cell culture
Normal human colonic epithelial cells (NCM460) (SNL-519, Shang En Bio, Wuhan, China) were cultured in RPMI medium (R8758, Sigma Aldrich, USA) supplemented with 10% fetal bovine serum (FBS) (TMS-016, Sigma Aldrich, USA), 10 μg/mL streptomycin (85886, Sigma Aldrich, USA), and 100 U/mL penicillin (9073-60-3, Sigma Aldrich, USA). The cells were cultured at 37 °C in a humidified CO2 incubator (Heracell™ Vios 160i CR CO2 Incubator, 51033770, Thermo Scientific™, Germany). Passage was carried out when the cells reached 80–90% confluence87,88,89.
NCM460 cells were stimulated with 100 ng/mL recombinant TNF-α (SRP3177, Sigma Aldrich, USA) for 24 h to mimic an in vitro IBD cell model90.
The groups were as follows: NC (normal cells), TNF-α (cells treated with TNF-α), and TNF-α + MOS (cells cultured in a medium containing 5 mg/mL MOS and treated with TNF-α).
Cell viability assay
In our study, PrestoBlue™ (PB) cell viability reagent (A13262, Thermo Fisher, USA) was employed as our fluorescence-based detection method. PB utilizes a nontoxic, cell-permeable solution based on resazurin to determine cell viability indirectly. This solution is reduced to a fluorescent dye by metabolically active cells. The PB assay was conducted following the manufacturer’s protocol. Briefly, the PB reagent was equilibrated to room temperature, and then 20 μL of cell viability reagent was added to 48-well plates containing 180 μL of RPMI medium with seeded cells. The plates were incubated at 37 °C in darkness for 1.5 h, which was determined by incubating cells at the highest concentration and determining the upper limit of time. Finally, the contents of each well were gently mixed, and 100 μL was transferred to a black 96-well plate for detection at 560-nm excitation and 590-nm emission using an enzyme-linked immunosorbent assay (ELISA) reader (Varioskan LUX, Thermo Fisher, USA)30.
In vitro organoid culture
A 20-cm segment of the small intestine near the stomach was dissected from wild-type mice and rinsed with cold PBS. The colon was cut into 2-mm sections and washed 15 times with cold PBS. The colon sections were then incubated in Gentle Cell Dissociation Reagent (07174, STEMCELL Technologies) for 15 min at room temperature, followed by centrifugation at 350× g for 15 min and resuspension in PBS with 0.1% BSA (A6003, Sigma Aldrich, USA). The dissociated colon crypts were filtered through a 40-μm mesh to obtain separated colon organoids. The isolated colon organoids were resuspended in DMEM/F12 culture medium containing 15 mM HEPES (36254, STEMCELL Technologies) and counted before being mixed in a 1:1 ratio with intestinal organoid growth medium and Matrigel (356230, Corning). The cells were plated in a 24-well culture plate and cultured in an intestinal organoid growth medium (06005, STEMCELL Technologies). The culture medium was changed every other day, and the organoids were observed daily. After 5–7 days, the organoids were stimulated with 100 ng/mL mouse recombinant TNF-α (654245, Sigma Aldrich, USA) for 24 h to establish an IBD organoid model90.
Grouping: Organoid/NC (normal organoids), Organoid/MOC (organoids cultured in medium containing 5 mg/mL MOC), Organoid/TNF-α (organoids treated with TNF-α), Organoid/TNF-α + MOC (organoids cultured in medium containing 5 mg/mL MOC and treated with TNF-α).
RT-qPCR
Colonic cells or tissue samples were collected and lysed using Trizol reagent (10296010, Invitrogen, Thermo Fisher, USA) to extract total cellular RNA. The quality and concentration of RNA were assessed using a UV-visible spectrophotometer (ND-1000, Nanodrop, Thermo Fisher, USA). Reverse transcription was performed using the PrimeScript™ RT-qPCR kit (RR086A, TaKaRa, Mountain View, CA, USA). Real-time quantitative reverse transcription polymerase chain reaction (RT-qPCR) was carried out on the LightCycler 480 system (Roche Diagnostics, Pleasanton, CA, USA) using SYBR Premix Ex TaqTM (DRR820A, TaKaRa). The reference gene used was Actin. The primer design and sequence information were obtained from Shanghai Universal Biotechnology Co., Ltd. (Supplementary Table 2). The fold change in gene expression between the experimental and control groups was calculated as 2-ΔΔCt. The formula used to calculate ΔΔCt was ΔΔCT = ΔCt experimental group – ΔCt control group, with ΔCt calculated as the Ct value of the target gene minus the Ct value of the reference gene91.
Western blot
Colon cells or tissues were collected and digested using trypsin (T4799-5G) from Sigma Aldrich (USA), and all cells and tissues were collected for culture. Cell lysis was performed using enhanced RIPA lysis buffer (AR0108) from Wuhan Bode Technology Co., Ltd. (China) containing a protease inhibitor. Protein concentration was measured using the BCA protein assay kit (AR1189) from Wuhan Bode Technology Co., Ltd., China.
Next, protein separation was carried out using the SDS-PAGE method, followed by transfer onto a PVDF membrane. The membrane was then blocked with 5% BSA (Sigma Aldrich, USA) at room temperature for 1 h. After that, diluted primary antibody (Supplementary Table 3 for detailed information on the primary antibody) was added and incubated overnight at 4 °C. The membrane was washed three times with PBST (each time for 5 min). Subsequently, the membrane was incubated with either Anti-Mouse-HRP secondary antibody (7076, 1/5000, CST, USA) or Anti-Rabbit-HRP secondary antibody (7074, 1/5000, CST, USA) at room temperature for 1 h. The membrane was washed again three times with PBST (each time for 5 min). PBST was removed, and an appropriate amount of ECL working solution (Omt-01, Beijing Omicdata Biotechnology Co., Ltd., China) was added, followed by incubation at room temperature for 1 min. Excess ECL reagent was removed, the membrane was sealed with plastic wrap, and it was placed in a dark box for exposure to X-ray film for 5–10 min for visualization and development92,93. The intensities of the protein bands in the Western blot image were quantified using ImageJ analysis software, with Actin serving as an internal control. All the original western blot images can be found at Supplementary Figs. 10–28.
Lentivirus
We constructed human LGALS3-shRNA and mouse LGALS3-shRNA using the vector pLKO.1-puro (QYV0024) provided by Beijing Qiyuan Biological Technology Co., Ltd. The sequences were as follows: human LGALS3-shRNA sequence 1: 5’–3’ GCTCACTTGTTGCAGTACAAT; human LGALS3-shRNA sequence 2: 5’–3’ CCCACGCTTCAATGAGAACAA; mouse LGALS3-shRNA sequence 1: 5’–3’ CCCAACGCAAACAGGATTGTT; mouse LGALS3-shRNA sequence 2: 5’–3’ CCGCATGCTGATCACAATCAT. Human sh-NC (sequence: 5’–3’ GCAACAAGATGAAGAGCACCAA) and mouse sh-NC (sequence: 5’–3’ CCTAAGGTTAAGTCGCCCTCG) were purchased from Thermo Fisher (USA) as controls. Using HEK293T cells (Nanjing KeyGen Biotech Co., Ltd., Jiangsu, China) as a basis, we constructed lentiviral vectors (LGALS3-shRNA-LTEP-s, hereafter referred to as sh-LGALS3 and sh-NC-LTEP-s, hereafter referred to as sh-NC) by using the plasmids and lentivirus packaging services provided by Shengong Biotech Co., Ltd. The constructed plasmids carrying the firefly luciferase reporter gene (sh-NC-luc and sh-LGALS3-luc) were co-transfected into HEK293T cells along with the auxiliary plasmids using Lipofectamine 2000 reagent (11668030, Thermo Fisher, USA). The packaged lentiviruses were then verified, amplified, and purified.
For lentivirus-mediated cell transduction, 5 × 10⁵ cells were seeded in a six-well plate. Once the cell density reached 70–90%, the medium containing an appropriate amount of packaged lentivirus (MOI = 10, working titer approximately 5 × 10⁶ TU/mL) and 5 μg/mL polybrene (TR-1003, Sigma Aldrich, USA) was added for transduction. After 4 h of transduction, an equal volume of medium was added to dilute polybrene. After 24 h, the fresh medium was replaced. After 48 h, 10 μg/mL puromycin (A1113803, Gibco, Grand Island, NY, USA) was used for resistance selection to obtain stable cell lines. Cells were collected when they no longer died in the medium containing puromycin, and their overexpression and knockdown efficiency were verified by RT-qPCR94.
The cell groups were as follows: sh-NC (transfected with sh-NC as normal control), sh-LGALS3 (transfected with sh-LGALS3 as normal control); sh-NC (G1, transfected with sh-NC as normal control), TNF-α+sh-NC (G2, cells stimulated with TNF-α and transfected with sh-NC as normal control); sh-NC (G1, transfected with sh-NC as normal control), TNF-α+sh-NC + MOS (G3, cells stimulated with TNF-α and transfected with sh-NC, followed by incubation with 5 mg/mL MOS in the medium); TNF-α+sh-LGALS3 + MOS (G4, cells stimulated with TNF-α and transfected with sh-LGALS3, followed by incubation with 5 mg/mL MOS in the medium).
Immunofluorescence
Cells or tissues were washed with ice-cold PBS and fixed in 4% paraformaldehyde (P885233, Macklin, USA) for 15–30 min. Subsequently, they were treated with 0.1% Triton (L885651, Macklin, USA) for 15 min. After washing twice with PBS, the samples were incubated overnight at 4 °C in PBS containing 15% FBS. The following antibodies and dyes were then used to label the cells or tissues overnight at 4 °C: mouse anti-ZO-1 (33-9100, Thermo Fisher, USA; 1:50), mouse anti-Occludin (33-1500, Thermo Fisher, USA; 1:50), rat anti-LGALS3 (14-5301-82, Thermo Fisher, USA; 1:50), mouse anti-4-HNE (12F7, Thermo Fisher, USA; 1:50), and rabbit anti-8-OHdG (abs122148, Abcam, Shanghai, China; 1:50). After three washes with TBST (TBS containing 1% Tween-20), the samples were incubated with goat anti-mouse Alexa Fluor™ 488 secondary antibody (A-11001, Thermo Fisher, USA), goat anti-mouse Alexa Fluor™ Plus 555 secondary antibody (A32727, Thermo Fisher, USA), goat anti-rat Alexa Fluor™ 350 secondary antibody (A-21093, Thermo Fisher, USA), and goat anti-rabbit Alexa Fluor™ 555 secondary antibody (A-21428, Thermo Fisher, USA). Subsequently, a DAPI counterstain was applied, and the samples were observed using a fluorescence microscope (Zeiss Observer Z1, Germany). The fluorescence intensity of the target area was measured95. Image processing and quantification of the number of positive cells were performed using ImageJ.
Flow cytometry
ROS Assessment: The intracellular levels of ROS in intestinal epithelial cells were measured using the DCFH-DA assay kit (HY-D0940, MCE, USA). Following the manufacturer’s instructions, cells were stained with DCFH-DA and analyzed using a flow cytometer96.
C11-BODIPY Staining: Intestinal epithelial cells (1 × 10⁵ cells/well) were seeded in a six-well plate overnight and treated with 6-OHDA (28094-15-7, Sigma Aldrich, USA) for 24 h. The cells were then incubated at 37 °C for 30 min and stained with 10 μM C11-BODIPY(581/591) (217075-36-0, Sigma Aldrich, USA). After washing three times with PBS, the cells were dissociated using trypsin. A flow cytometer was used to collect green (484/510 nm) and red (581/610 nm) signals simultaneously for fluorescence measurement. The measurement of lipid peroxidation in the cells was provided by the ratio of fluorescent intensity emission in the range of 590–510 nm97.
Detection of total ROS and mitochondrial ROS
Fluorescent dye 2’,7’-dichlorodihydrofluorescein diacetate (DCF) (HY-D0940, Abcam, USA) was used for the detection of ROS. This dye can penetrate cells and undergo a reaction with ROS molecules, resulting in the formation of a green fluorescent compound called dichlorodihydrofluorescein (DCFDA). In brief, a stock solution of DCFDA (10 mM) was prepared and then diluted with a culture medium to obtain a working solution of 100 μM. Intestinal epithelial cells (2 × 10⁴) were seeded on coverslips in a six-well plate overnight. The following day, the cells were treated with H2O2 (200 μM) for 24 h. After treatment, the coverslips were washed with ice-cold Hank’s balanced salt solution (HBSS) (H8264, Sigma Aldrich, Shanghai, China) and incubated with 100 μM DCFDA at 37 °C for 30 min. After washing with 1×PBS, the coverslips were mounted on slides. Images were analyzed using a Nikon A1R multiphoton confocal microscope with a ×100 objective and Nikon Imaging Software (NIS Element).
The presence of superoxide compounds (SOX) in mitochondria was evaluated using the red fluorescent compound mito-SOX (M36008, Thermo Fisher, USA). Intestinal epithelial cells (2 × 10⁴) were seeded on coverslips in a six-well plate overnight. The following day, the cells were treated with H2O2 (200 μM) for 24 h. Then, the coverslips were washed with ice-cold 1×PBS and incubated with a working solution of 2 μM mito-SOX at 37 °C for 30 min. After washing with 1×PBS, the coverslips were mounted on slides. Images were analyzed using a Nikon A1R multiphoton confocal microscope with a ×100 objective and Nikon Imaging Software (NIS Element)98,99.
Measurement of nitric oxide (NO) production
NO release was measured using the Griess method with a carbon monoxide detection kit (BES2087ROS, Borson Bioscience, Shanghai, China). Briefly, 100 μL of 1% sulfanilamide containing 5% phosphoric acid was mixed with 100 μL of phenol red-free culture medium in a 96-well plate and incubated at 27 °C for 20 min. The production of diazotized species was determined at 550 nm using an ELISA reader. The nitrite concentration was calculated based on a standard curve of sodium nitrite100. The experiment was performed in triplicate.
Measurement of oxidative stress markers
Intestinal epithelial cells were obtained, and the protein concentration was measured using the BCA protein assay kit (20201ES76, Yisheng Biotechnology, Shanghai, China). The levels of MDA, an indicator of lipid peroxidation, were determined using the MDA detection kit (ab118970, Abcam, USA) according to the manufacturer’s instructions. Glutathione (GSH) levels were measured using the GSH detection kit (CS0260, Sigma Aldrich, USA)101.
The levels of catalase (CAT) in cells and mouse serum were measured using the CAT detection kit (E-BC-K031-M, Wuhan Elabscience Biotechnology, Wuhan, China). The Total SOD detection kit (E-BC-K019-M, Wuhan Elabscience Biotechnology, Wuhan, China) was used to measure the levels of SOD in cells and mouse serum102.
Preparation and characterization of GA-MOS
To prepare a mixture of 10% Gum Arabic (GA) (food-grade, Hebei Runbu Biotechnology Co., Ltd., Hebei, China) and 20% MOS, GA was dissolved in distilled water, and then MOS was added. The mixture was homogenized using a Colour Squid homogenizer (IKA, Germany) at 7000× g for 10 min until complete dissolution and mixing occurred. Spraying drying was carried out using a laboratory-scale spray dryer (YC-500, Shanghai Yacheng Instrument Equipment Co., Ltd., Shanghai, China). The atomizer consisted of a dual-fluid nozzle with a diameter of 2.0 mm. The spray drying parameters were set as follows: maximum feed flow rate of 500 mL/h, maximum adjustable flow rate of the peristaltic pump at 2000 mL/h, and overall power of 2KW/220 V. The feed liquid was sprayed and dried when the desired constant inlet air temperature was reached. The powder was collected from the recovery chamber and cyclone separator, instantly quoted and sealed in PA/PE vacuum bags, and stored at room temperature.
The morphological evaluation of the samples was conducted using a scanning electron microscope (SEM) (EVO, ZEISS, Germany). Particles were affixed to specimen stubs using double-sided adhesive tape, coated with ~200 Å of gold, and observed at a voltage of 15 kV. X-ray diffraction (XRD) characteristics of the powder were analyzed using a diffractometer (STADI MP, STOE X, Germany). The diffraction pattern was recorded at room temperature with a scanning speed of 10°/min from 2θ = 5–90°. Fourier-transform infrared spectroscopy (FT-IR) (ReactIR™ FTIR spectrometer, METTLER TOLEDO, China) was used to scan the spectrum of the physically mixed materials, ranging from 4000 to 400 cm−1 in wavelength.
MTT assay for cell viability
Caco-2 cells were seeded in a 96-well plate at a density of 1 × 10⁴ cells per well and incubated for 24 h. Afterward, cells were treated with various concentrations of GA-MOS and incubated in the culture medium containing 0.5 mg/mL MTT (Sigma Aldrich, Shanghai, China, Catalog No: 298-93-1) for 4 h. Cell viability was determined by measuring the absorbance at 570 nm103.
Modeling of IBD in mice
Wild-type BALB/c male mice, aged 8–12 weeks and weighing 20–25 g, were obtained from the Experimental Animal Research Center at our institution. All animal studies were conducted in accordance with the guidelines outlined in our institution’s “Guidelines for the Care and Use of Laboratory Animals.” All experiments involving mice were approved by the Animal Ethics Committee (No. CMU2021257). The animals were housed individually in a temperature-controlled SPF-grade room with a 12-h light–dark cycle.
For the acute colitis mouse model (n = 100), 3.5% dextran sulfate sodium salt (DSS, wt/vol; MB5535, Dalian Meilun Biotechnology Co., Ltd., Dalian, China) was added to the drinking water and administered orally for 7 days, followed by a return to regular drinking water. The control group was fed with regular drinking water throughout the study. The health conditions of the mice were monitored daily, and the DAI was recorded to assess the severity of symptoms based on the sum of weight loss (0–4), stool consistency (0–4), and fecal bleeding (0–4). Mice were euthanized by cervical dislocation under anesthesia with 1.5% isoflurane (R510-22-10, RWD Life Science Co., Ltd., Shenzhen, China), and the length of the colon and macroscopic appearance were documented104.
After IBD establishment, different doses of GA-MOS (50, 100, 200, 300 mg/kg/d) were administered orally to the IBD group of mice using gavage to evaluate the therapeutic effect. Eventually, a dosage of 200 mg/kg/d was selected. Subsequently, mice in the IBD group were subjected to oral gavage with either MOS (200 mg/kg/d), GA-MOS (200 mg/kg/d), or an equal volume of saline for a continuous feeding period of 9 days. The mice were euthanized by cervical dislocation under anesthesia, and the colon tissues were collected for histopathological and Western blot experiments105.
The groups were as follows: Normal group (normal mice, saline control group), GA-MOS group (normal mice, GA-MOS by gavage), Normal group (normal mice, saline control group), IBD group (IBD mice, saline control group), IBD + MOS group (IBD mice, MOS by gavage), IBD + GA-MOS group (IBD mice, GA-MOS by gavage), Normal+sh-NC group (normal mice, saline control group, sh-NC intravenously injected into the tail vein), IBD+sh-NC group (IBD mice, saline control group, sh-NC intravenously injected into the tail vein), IBD + MOS+sh-NC group (IBD mice, MOS by gavage, sh-NC intravenously injected into the tail vein), IBD + GA-MOS+sh-NC group (IBD mice, GA-MOS by gavage, sh-NC intravenously injected into the tail vein), IBD + GA-MOS+sh-LGALS3 group (IBD mice, GA-MOS by gavage, sh-LGALS3 intravenously injected into the tail vein).
After modeling, lentivirus injections were performed via the tail vein using a working titer of 5 × 10⁶ TU/mL and a dosage of 10 μL per mouse, administered continuously for 1 week106.
Blood biochemical assay
Peripheral blood samples from mice were collected and analyzed using the Vitros 5.1FS automated biochemical analyzer (Ortho Clinical Diagnostics, USA). The levels of serum alanine aminotransferase (ALT) and aspartate aminotransferase (AST) were measured to assess liver function, while serum blood urea nitrogen (BUN) and creatinine (Cr) levels were measured to evaluate kidney function107.
Histological staining
Hematoxylin and eosin (H&E) staining: Tissue samples from the liver, heart, spleen, kidney, lung, and colon of the mice were collected and fixed. After sectioning, the paraffin blocks were immersed in xylene to remove the wax, followed by rehydration in 100% ethanol (Sigma Aldrich, USA), followed by 95% and 70% ethanol, and finally rinsed with water or mounted. The prepared sections were stained with hematoxylin (H8070, Solarbio, Beijing, China) for 5–10 min at room temperature. Subsequently, the sections were rinsed with distilled water, dehydrated in 95% ethanol, and then placed in an eosin staining solution (G1100, Solarbio, Beijing, China) for 5–10 min. Following routine dehydration, clearing, and mounting, the sections were analyzed using an optical microscope (Olympus, Tokyo, Japan)108.
Alcian Blue-Periodic Acid Schiff (AB-PAS) staining: Colon samples were fixed in a 4% formalin solution for 48 h. After fixation, the samples were sequentially immersed in 70%, 80%, and 90% ethanol solutions for 30 min each, followed by two immersions in 95% and 100% ethanol solutions for 20 min each. The dehydrated samples were then infiltrated with xylene, embedded in paraffin, and sectioned into 5-μm slices. The sections were stained with AB-PAS (BL1123B, Shanghai Golden Biotechnology Co., Ltd., Shanghai, China) and analyzed under an optical microscope109.
ELISA
Mouse blood serum samples were obtained by collecting venous blood and allowing it to coagulate at room temperature for 20–30 min. The samples were then centrifuged at 2000×g for 10 min to obtain the serum. The serum samples were stored at −80 °C. The experiments were conducted using IL-1β, IL-6, and TNF-α ELISA kits (ab197742, ab222503, and ab208348, respectively, Abcam, UK).
Initially, the antigens were diluted in an appropriate concentration of coating buffer. Then, 5% bovine serum (F8318, MSK, Wuhan, China) was added to the wells for the enzymatic reaction, followed by incubation at 37 °C for 40 min. Subsequently, the diluted samples were added to the wells, and then the enzyme-labeled antibody and substrate solution were added. Finally, 50 μL of stop solution was added to each well, and the experiment had to be completed within 20 min. The plates were read at 450 nm using a plate reader (Bio-Rad, USA), and a standard curve was plotted to analyze the data110.
Immunohistochemistry
The colonic tissues of the mice under investigation were fixed and embedded for further analysis. The embedded tissues were then sliced and subjected to deparaffinization, a process that removes the paraffin and renders the slices hydrophilic, facilitating subsequent immunostaining procedures. The deparaffinized tissue sections were treated with specific antibodies, namely IL-1β antibody (P420B, 1:50; Thermo Fisher, USA), IL-6 antibody (AMC0864, 1:50; Thermo Fisher, USA), TNF-α antibody (PA1-40281, 1:50; Thermo Fisher, USA), MPO antibody (PA5-16672, 1:50; Thermo Fisher, USA), or Ki-67 antibody (14-5698-82, 1:50; Thermo Fisher, USA). Subsequently, the sections were treated with Anti-Rabbit-HRP secondary antibody (12-348, 1:1000; Sigma Aldrich, USA), Anti-Mouse-HRP secondary antibody (AP160P, 1:1000; Sigma Aldrich, USA), or Anti-Rat-HRP secondary antibody (AP136P, 1:1000; Sigma Aldrich, USA). The binding of the secondary antibody to the primary antibody was visualized using a DAB staining reagent (ab64238, Abcam, USA). After staining, the tissue sections were deparaffinized and mounted for observation111. The stained sections were then examined under a microscope, and the positivity rate of the cells was quantitatively analyzed using ImageJ software. Furthermore, the expression levels of the various proteins were recorded.
16S rDNA sequencing
To evaluate the composition of the gut microbiota, we employed 16S rDNA sequencing technology to analyze the gut microbiota and established a cDNA library at Beijing Nuohu Genetic Biotechnology Co., Ltd. In brief, fresh colonic and cecal contents were carefully collected from each mouse and stored in sealed sterile tubes at −80 °C. The workflow for sample processing consisted of several key steps. We used a hexadecyltrimethylammonium bromide (CTAB) protocol (SL2071, Beijing Kulab Technology Co., Ltd., Beijing, China) for total genomic DNA extraction from fecal samples. We utilized a 1% agarose gel to monitor DNA purity and concentration. Subsequently, DNA samples were diluted to 1 ng/μL using sterile water. Next, we amplified different regions V3-V4 of the 16S rRNA gene and purified the mixed PCR products using the Qiagen Gel Extraction Kit (28706, Qiagen, Germany). Following the manufacturer’s instructions, we utilized the TruSeq DNA PCR-Free Sample Preparation Kit (Illumina, USA) to generate sequencing libraries. The quality of the libraries was evaluated using the Qubit@ 2.0 fluorometer (Thermo Scientific) and the Agilent Bioanalyzer 2100 system. Finally, we performed sequencing of the libraries on the Illumina NovaSeq platform112.
Relative abundance analysis of microorganisms
The samples were evaluated using multiQC113 and kneaddata (https://github.com/biobakery/kneaddata), with multiQC used for sequence quality control and kneaddate used to remove host and contamination sequences. A microbial species tree was generated using GraPhlAn114 and annotated to assess differences, yielding a relative abundance of microbial classifications. To evaluate the diversity of species complexity in the samples, an alpha diversity analysis was performed using the Simpson index, and a beta diversity analysis was analyzed using principal coordinate analysis (PCoA). The abundance and diversity of bacteria were compared using the Wilcoxon rank-sum test and Welch’s t test. The edgeR package in R software was utilized to calculate inter-group abundance differences, and volcano plots and Manhattan plots were generated. Linear Discriminant Analysis (LDA) Effect Size analysis was conducted, and bar plots of differential abundance were created for all significant differences, with an LDA score threshold of 2.0. The LDA scores indicate the degree of influence of significantly different species between groups, with higher scores indicating greater differences in features between the two groups115.
Microbial functional composition
The FAPROTAX dataset and related software can be found at http://www.loucalab.com/archive/FAPROTAX/. This dataset is a manually curated database of prokaryotic taxa used for predicting the major ecological functions of microbial communities. We used the R package to process the QIIME data and conducted a community phylogenetics investigation using PICRUSt. The Kyoto Encyclopedia of Genes and Genomes (KEGG) was utilized to predict the metagenomic pathways of each primer set116,117. Statistical analysis and visualization of the non-hierarchical results were performed using the STAMP software (v2.1.3). Differences in functional composition were compared using the Welch t test118.
Gas chromatography-mass spectrometry (GC-MS)
After collection, the mouse fecal samples were mixed thoroughly with 10 μL of ultrapure water per 1 mL and then left to stand for 30 min. Subsequently, the samples were centrifuged at 12,000 rpm and 4 °C for 20 min. The supernatant was carefully extracted and filtered through a 0.22-μm water membrane before being transferred to the gas phase bottle for measurement.
A DB-WAX 30 M column (I.D. 0.32 mm, 5 μm, Agilent, USA) was used for chromatography. The injector and detector temperatures were set at 250 °C. The temperature program was as follows: initially held at 50 °C for 3 min, ramped to 120 °C at a rate of 6 °C per min, held for 0.5 min, further ramped to 220 °C at a rate of 6 °C per min, and held for 5 min. The nitrogen flow rate was 3 mL/min, the hydrogen flow rate was 47 mL/min, and the airflow rate was 400 mL/min with a split ratio of 1:3. The injection volume was 1.0 μL. Quantification was performed using an external standard method. Based on the ratio of the peak area of the standard samples to that of the samples, the content of individual short-chain fatty acids in the samples was calculated119,120.
Statistical software and data analysis methods
Version 4.3.0 of the R language we utilized, and programming was conducted using the integrated development environment RStudio. Continuous data was presented as mean ± standard deviation (mean ± SD). Statistical analysis was performed using one-way analysis of variance (ANOVA) followed by Tukey or Newman-Keuls post hoc comparisons. Data analysis was conducted using GraphPad Prism 8 software (GraphPad Software, La Jolla, CA). A significance level of P ≤ 0.05 was considered statistically significant121.
Responses