NRF2 signaling plays an essential role in cancer progression through the NRF2-GPX2-NOTCH3 axis in head and neck squamous cell carcinoma

Introduction
Head and neck squamous cell carcinoma (HNSCC) represents a diverse group of cancers arising from the squamous cells lining the mucosal surfaces of the head and neck region, including the oral cavity, oropharynx, larynx, and hypopharynx [1]. HNSCC is one of the most common cancers worldwide, accounting for over 870,000 cases per year [2]. Tobacco use, alcohol consumption, and human papillomavirus (HPV) infection are the primary etiological factors [3]. Genetic alterations are common in HNSCC including growth factor receptors (e.g., EGFR), tumor suppressors (e.g., p53) and signaling pathways (e.g., PI3K), etc [4,5,6]. Despite advances in surgical techniques, radiation therapy, and chemotherapy, the overall survival rates for HNSCC have only modestly improved over the past few decades. The development of resistance to therapy, the presence of distant metastases at diagnosis, and the significant morbidity associated with treatment highlight the need for innovative therapeutic strategies. Recent advancements in immunotherapy and targeted therapies offer new hope for improving outcomes in HNSCC patients. However, the cure rate for advanced HNSCC patients remains poor and only 40–50% of patients survive for 5 years [7].
NRF2 signaling is pivotal in maintaining cellular redox homeostasis and defending against oxidative stress. NRF2 operates as a master regulator, controlling the expression of various genes involved in antioxidant response and detoxification processes to maintain cellular redox homeostasis. The regulation of NRF2 expression is intricately controlled through its interaction with KEAP1 to form a CUL3-based E3 ubiquitin ligase complex. This KEAP1-mediated ubiquitination and subsequent proteasomal degradation of NRF2 ensures that NRF2 levels remain low under unstressed conditions [8, 9]. Upon oxidative stress, modifications in KEAP1 lead to the stabilization and nuclear translocation of NRF2, where it binds to antioxidant response elements (ARE) in the DNA to activate the transcription of its target genes. Multiple studies have shown that NRF2 plays a paradoxical role in cancer development. Activation of NRF2 in normal cells promotes antioxidant defenses and detoxification, protecting against DNA damage and mutagenesis, thus acting as a tumor suppressor by eliminating potential cancer initiation [10, 11]. However, the constitutive activation of NRF2 in cancer cells enhances cancer cell proliferation, metabolic reprogramming, and resistance to chemotherapy and radiotherapy, thus promoting tumor progression and metastasis [12,13,14,15,16]. Clinical evidence also indicates that elevated expression of NRF2 is significantly associated with poor prognosis [16, 17]. This duality highlights the complexity of NRF2 signaling in the cancer milieu.
Glutathione peroxidases (GPXs) are selenium-containing enzymes crucial in the defense of oxidative stress by reducing peroxides with the oxidization of glutathione (GSH) to glutathione disulfide (GSSG) [18, 19]. There are eight GPX family members who have distinct cellular locations and substrate specificities, contributing to various physiological functions beyond their antioxidant roles [20]. GPX members play multifaceted roles in cancers as both tumor-suppressive and oncogenic activities depending on the context and specific family member involved [21,22,23]. GPX4 has been identified as a critical player in conferring resistance to ferroptosis, garnering attention as a potential novel target for anticancer therapies [24]. GPX7 has been demonstrated to be downregulated and hypermethylated in gastric cancer, and its reconstitution suppresses tumor cell growth [25]. GPX8 has been implicated in the promotion of cancer cell growth [26]. Recent studies have shown that GPX2 serves as a predictive marker for recurrence-free survival in prostate cancer and promotes cancer development through the Wnt/β-catenin/EMT pathway [27]. Previous studies also indicate that the expression level of GPX2 is a prognostic factor in esophageal squamous cell carcinoma (ESCC), correlating with clinicopathological features [28]. In addition, Kazi et al. suggests that GPX2 as a targetable factor influences immune escape in cold tumors, thus affecting the response to immune checkpoint inhibitors [29].
In this study, we observed that GPX2 was significantly overexpressed in patients with NRF2 mutations in HNSCC, contributing to accelerated tumor progression compared to patients with normal NRF2. We further found that NRF2 enhances GPX2 expression, influencing the NOTCH pathway by sustaining NOTCH3 levels. Reduction of GPX2 level led to a decrease in tumor cell growth both in vitro and in vivo. Moreover, increased levels of GPX2 were observed in HNSCC patients, correlating with poorer patient outcomes. This study sheds light on the critical role of the NRF2-GPX2-NOTCH3 axis in advancing HNSCC, suggesting that targeting the NRF2-GPX2-NOTCH3 axis might offer a novel strategy to enhance treatment efficacy in HNSCC.
Results
Enhanced NRF2 signaling correlates with poor survival rates in patients with HNSCC
The NRF2 degradation complex is crucial in the regulation of NRF2 signaling and comprises KEAP1 and CUL3 components. To investigate the role of NRF2 components in HNSCC, we performed an extensive analysis utilizing The Cancer Genome Atlas (TCGA) database. About 12% of all cancers carried mutations in at least one of these three genes (Fig. 1A). NRF2 mutations are present in about 6% of HNSCC cases (Fig. 1A), consistent with previous report [30]. In addition, we analyzed the occurrence of mutations in KEAP1 and CUL3, and identified at rates of 4% and 2%, respectively (Fig. 1A). Notably, the missense mutations of NRF2 in the Neh 2 domain primarily impaired its capacity to bind to KEAP1, enhancing its nuclear translocation and prolonging its activity (Fig. 1A, B). Mutations of KEAP1 were found not only in the DGR (Kelch) domain, which is crucial for NRF2 interaction, but also in various structural domains, and a similar pattern is observed in CUL3 as well (Supplementary Fig. 1). Following stress stimuli, the activation of NRF2 promotes a broad spectrum of downstream target genes involved in various cellular processes such as iron catabolism (FTH1, FTL), metabolism (G6PD, TKT), antioxidant signaling (TXN, GCLC, GCLM), and xenobiotic transformation (NQO1) [31]. Increased expression of these genes was observed in patients harboring NRF2 mutations (Fig. 1C). Subsequent analysis suggested that upregulation of NRF2 downstream genes correlated with decreased overall survival rate in patients (Fig. 1D and Supplementary Fig. 2) [32]. Notably, high expression of NRF2 markedly enhanced cell proliferation compared to cells with lower levels of NRF2, as evidenced by Ki67 staining (Fig. 1E). Furthermore, the expression levels of KEAP1 increased with the activation of NRF2, which may be due to a reciprocal feedback mechanism (Fig. 1C, E). The results indicate that missense mutations in NRF2 are associated with poor prognoses in patients with HNSCC.

A The oncoplot showed the mutation frequency of NRF2, KEAP1, and CUL3 genes. B Lollipop plot showed somatic alterations of the NRF2 gene in the TCGA-HNSCC cohort. The pie chart displayed the proportion of mutations in each domain. C Increased expression levels of KEAP1, FTH1, FTL, GCLC, GCLM, G6PD, NQO1, TKT, and TXN were observed in patients with NRF2 mutations in the TCGA-HNSCC cohort (n = 502). Mean ± SD, ***P < 0.001, ****P < 0.0001, ns, no significant. D K-M analysis showed that high expression levels of NRF2-regulated genes were correlated with a poor prognosis in HNSCC in the TCGA-HNSCC cohort (n = 499). E Representative immunohistochemical staining demonstrated that cells with high NRF2 expression exhibited markedly enhanced cell proliferation measured by Ki67 staining in HNSCC patients (scale bar = 100 μm). FPKM Fragments Per Kilobase of exon model per Million mapped fragments.
NRF2 is essential for HNSCC progression in vitro and in vivo
Multiple studies have demonstrated that the activation of NRF2 acts protectively against tumor initiation [11, 33, 34]. In contrast, sustained activation of NRF2 is associated with the progression of various cancers, substantially enhancing resistance to cancer treatments [35,36,37]. To elucidate the role of NRF2 in the progression of HNSCC, the NRF2 gene was specifically knocked out in the FaDu cell line using CRISPR-Cas9 technology. This knockout was confirmed by reduced expression of NRF2 target genes, NQO1 and GCLC (Fig. 2A, B). Deletion of NRF2 resulted in a notable decline in cell proliferation, demonstrated by decreased cell growth rates and colony formation capabilities (Fig. 2C, D). Deletion of NRF2 also led to a significant reduction in both the size and number of spheres formed (Fig. 2E). We further found that deletion of NRF2 markedly impaired the ability of migration and invasion (Fig. 2F). In addition, deletion of NRF2 significantly increased the cellular level of reactive oxygen species (ROS) determined by DCFH-DA flow cytometry (Fig. 2G and Supplementary Fig. 3). There was a significant increase in apoptotic cells in NRF2-deleted cells compared to control cells (Fig. 2H). Furthermore, following injection into nude mice (2×10⁶ cells per injection), tumors initiated by NRF2-deleted cells were observably smaller compared to those derived from control cells (Fig. 2I). Immunohistochemistry (IHC) staining revealed that the deletion of NRF2 significantly reduced Ki67 staining intensity (Fig. 2J). Suppressing NRF2 by shRNA knockdown in Detroit 562 cells significantly reduced proliferation, migration, and invasion capabilities, consistent with those observed in FaDu cells (Supplementary Fig. 4).
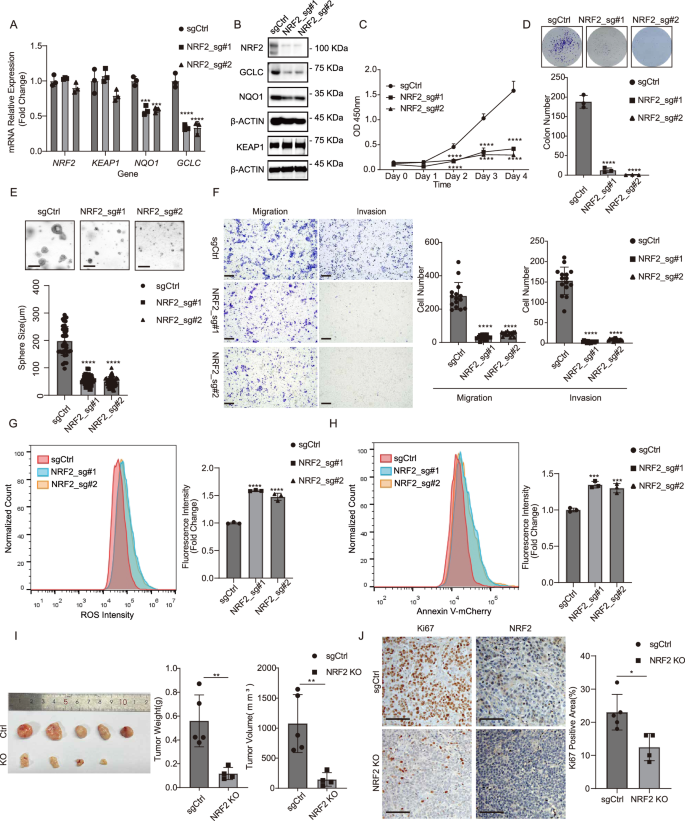
A The mRNA expression levels of NQO1 and GCLC in FaDu cells were reduced upon NRF2 knockout measured by RT-qPCR analysis. Mean ± SD, n = 3. ****P < 0.0001. B The protein levels of NRF2, GCLC, and NQO1 in FaDu cells were reduced following NRF2 depletion. C Proliferation of FaDu cells was significantly inhibited upon NRF2 knockout. Mean ± SD, n = 3, ****P < 0.0001. D Colony formation capability of FaDu cells was impaired upon NRF2 knockout. Mean ± SD, n = 3, ****P < 0.0001. E The ability of FaDu cells to form spheres was impaired upon NRF2 knockout (scale bar =200μm). Mean ± SD, n > 3, ****P < 0.0001. F The abilities of migration and invasion in FaDu cells were impaired upon NRF2 knockout (scale bar = 200 μm). Mean ± SD, n = 3, ****P < 0.0001. G NRF2 depletion dramatically induced ROS levels in FaDu cells measured by flow cytometry. Mean ± SD, n = 3, ****P < 0.0001. H NRF2 depletion dramatically induced apoptosis in FaDu cells assessed by Annexin V-mCherry staining. Mean ± SD, n = 3, ***P < 0.001. I NRF2 depletion significantly suppressed subcutaneous tumor growth in nude mice (n = 5 for each group). Mean ± SD, **P < 0.01. J Representative immunohistochemical staining demonstrated that NRF2 depletion markedly suppressed cell proliferation measured by Ki67 staining (scale bar = 100 μm). Mean ± SD, n = 5, *P < 0.05.
GPX2 is a potential downstream target of NRF2 signaling
To elucidate the role of NRF2 in the progression of HNSCC, we performed RNA sequencing analysis in both control and NRF2 knockout FaDu cells. Gene expression profiling, as well as the associated biological processes and pathways, were evaluated. We identified a list of differentially expressed genes. 707 genes (~66.95%) were upregulated, and 349 genes (~33.05%) were down-regulated following NRF2 knockout (Fig. 3A). By targeting differentially expressed mRNAs, the Kyoto Encyclopedia of Genes and Genomes (KEGG) pathway enrichment analysis revealed that the differentially expressed mRNAs were predominantly associated with cellular processes and metabolism (Fig. 3B). Heatmap cluster analysis of metabolic-related genes revealed that the gene expression profiles between the control and NRF2 knockout cells were distinct (Fig. 3C). Correspondingly, these gene expression differences were also represented in the volcano plot (Fig. 3D). Among these genes, the mRNA expression of GPX2 was notably suppressed in the NRF2 knockout cells (Fig. 3C, D). RT-qPCR and WB confirmed that the expression of GPX2 was decreased in FaDu and Detroit 562 cells after deletion of NRF2 (Fig. 3E and Supplemental Fig. 4A). In cohort study of TCGA database, the mRNA expression levels of GPX2 were positively correlated with NRF2 in both normal tissues and tumor tissues (Fig. 3F). Simultaneously, we observed a significant upregulation of GPX2 expression in tumor tissues with NRF2 mutations compared to normal tissues. Conversely, the low expression of GPX2 in tumor tissues without NRF2 mutations is attributed to their low NRF2 expression levels (Fig. 3G). The K-M analysis showed that high levels of GPX2 were associated with a poor survival ratio in HNSCC patients (Fig. 3H).
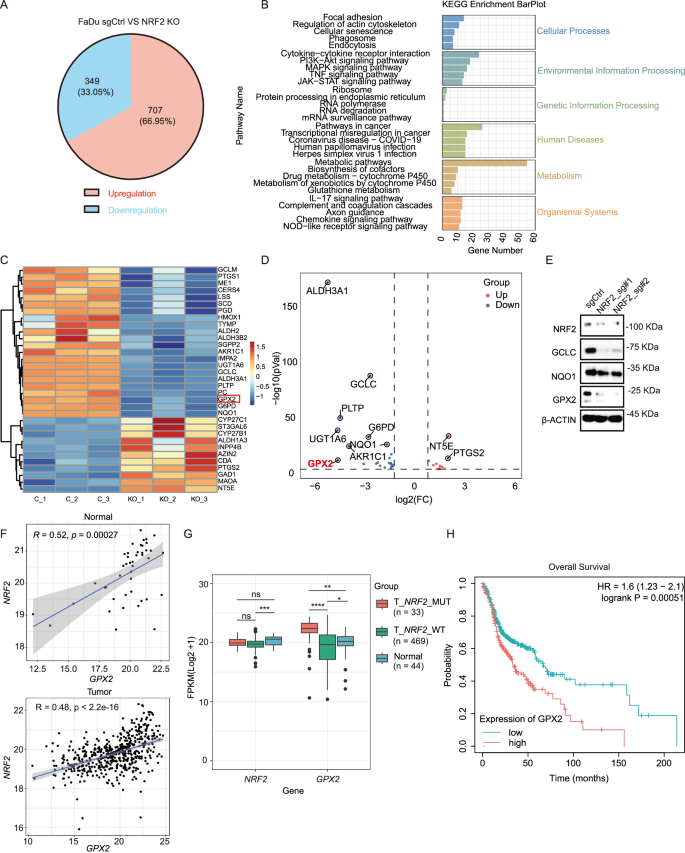
A RNA-Seq identified 707 upregulated and 349 downregulated genes following NRF2 depletion in FaDu cells. B Gene categories were significantly enriched (P ≤ 0.05) for genes with altered expression in KEGG pathways in FaDu cells upon NRF2 knockout. C A heatmap displays the changes in expression of various metabolic genes in FaDu cells upon NRF2 knockout. D Volcano plot showed the differential expression of genes (DEGs) following NRF2 depletion. Blue, downregulated genes; Red, upregulated genes. E Reduced protein levels of GCLC, NQO1, and GPX2 were observed in FaDu cells following NRF2 depletion. F The mRNA expression levels of GPX2 were positively correlated with NRF2 expression in both normal and tumor tissues (R = 0.52, p = 00027 vs R = 0.48, p < 2.2e-16). G Increased expression levels of GPX2 were observed in patients with NRF2 mutations in the TCGA-HNSCC cohort (n = 546). Mean ± SD,****P < 0.0001. H K-M analysis showed that high expression levels of GPX2 were correlated with a poor prognosis in HNSCC from the TCGA-HNSCC cohort (n = 499).
GPX2 promotes tumor growth in HNSCC
To explore the role of GPX2 in the malignant processes of HNSCC, we performed lentivirus-mediated shRNA knockdown of GPX2 in FaDu and Detroit 562 cell lines. The knockdown efficiency was confirmed by RT-qPCR and western blot (Fig. 4A, B and Supplementary Fig. 5A). Inhibition of GPX2 caused a significant reduction in cell proliferation measured by growth rate and colony formation assay (Fig. 4C, D and Supplementary Fig. 5B). GPX2 knockdown reduced the size of the tumor spheres formed in the 3D culture system (Fig. 4E). FaDu and Detroit 562 cells exhibited decreased migrating and invasive capability following GPX2 knockdown (Fig. 4F and Supplementary Fig. 5C). Meanwhile, GPX2 knockdown significantly increased the cellular level of ROS (Fig. 4G and Supplementary Fig. 5D). An increase in the proportion of apoptotic cells was also observed in GPX2 knockdown cells (Fig. 4H and Supplementary Fig. 5E). Moreover, GPX2 knockdown in FaDu cells led to smaller xenograft tumors and reduced proliferation than in controls (Fig. 4I, J).
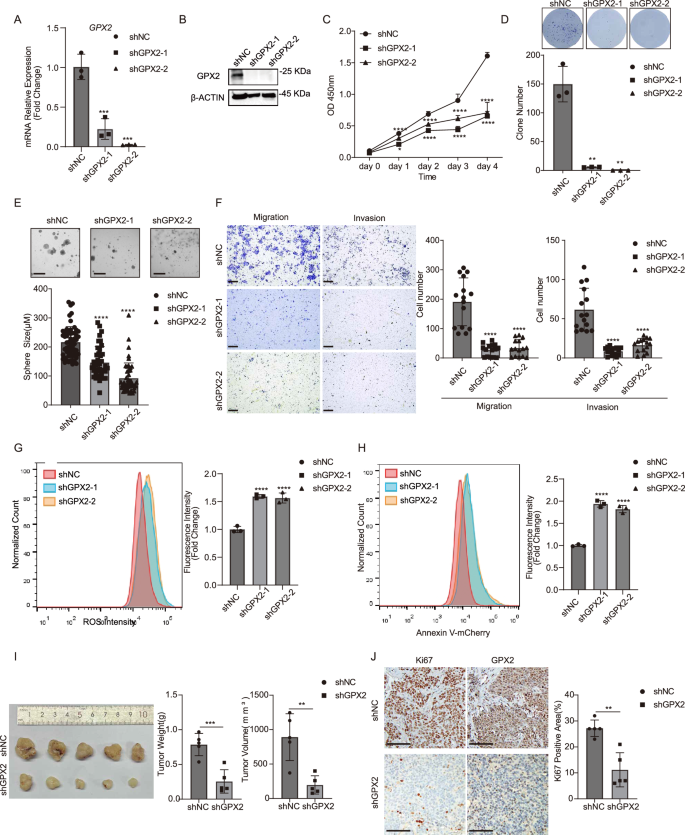
A GPX2 expression in FaDu cells was reduced upon GPX2 knockdown measured by RT-qPCR analysis. Mean ± SD, n = 3, ***P < 0.001. B The protein levels of GPX2 in FaDu cells were reduced following NRF2 depletion. C Proliferation of FaDu cells was significantly inhibited upon GPX2 knockdown. Mean ± SD, n = 3, *P < 0.05, ****P < 0.001. D Colony formation capability of FaDu cells was impaired upon GPX2 knockdown. Mean ± SD, n = 3, **P < 0.01. E The ability of FaDu cells to form spheres was impaired upon GPX2 knockdown (scale bar = 200 μm). Mean ± SD, n > 3, ****P < 0.0001. F The abilities of migration and invasion in FaDu cells were impaired upon GPX2 knockdown (scale bar = 200 μm). Mean ± SD, n = 3, ****P < 0.0001. G GPX2 depletion dramatically induced ROS levels in FaDu cells measured by flow cytometry. Mean ± SD, n = 3, ****P < 0.0001. H GPX2 depletion dramatically induced apoptosis in FaDu cells assessed by Annexin V-mCherry staining. Mean ± SD, n = 3, ***P < 0.001. I GPX2 depletion significantly suppressed subcutaneous tumor growth in nude mice (n = 5 for each group). Mean ± SD, ***P < 0.001. J Representative immunohistochemical staining demonstrated that GPX2 depletion markedly suppressed cell proliferation measured by Ki67 staining (scale bar = 100 μm). Mean ± SD, n = 5, **P < 0.01.
Depletion of GPX2 Expression disrupts NOTCH3 expression
NRF2 signaling is activated in cancer stem cells (CSCs) and contributes to CSC properties, such as proliferation, metastasis, and therapeutic resistance [13, 38]. Meanwhile, GPX2 can maintain the genomic integrity of pluripotent stem cells through antioxidant defense [39,40,41]. GPX2 is concentrated in stem cells and proliferative compartments of epithelial tissues to maintain tissue integrity and homeostasis [20]. To test whether GPX2 is involved in the maintenance of CSCs, we analyzed the proportion of CSCs in FaDu cells by flow cytometry analysis, using CD44 and ALDH activity, the common markers for CSCs [42, 43]. Loss of NRF2 or GPX2 markedly diminished the proportion of CSCs (Fig. 5A, B and Supplementary Figs. 6 and 7). We examined the expression levels of 17 genes that encode multidrug-resistant proteins(MRPs) for cancer stem cells and identified 4 genes (ABCC1, ABCC3, ABCC5, and ABCC10) with relatively high expression for further analysis [44]. Our result revealed that the deletion of NRF2 led to a reduction in the expression of ABCC1, ABCC3, and ABCC5, aligning with the previous findings that ABCC1 is significantly downregulated in glioblastoma cells following NRF2 knockout (Supplementary Fig. 8A, B) [45]. In contrast, the knockdown of GPX2 did not affect the expression of chemoresistance proteins but slightly increased the expression of ABCC1 (Supplementary Fig. 8C). Wnt, Hedgehog (HH), and NOTCH are canonical CSC pathways crucial to the tumorigenicity of CSCs [46]. We found that depletion of GPX2 significantly reduces HH and NOTCH signaling (Supplementary Fig. 9A, C). We further found that the NOTCH target gene, HES1, is highly expressed in HNSCC cells. In contrast, the expression levels of GLI1 and GLI2 are either low or undetectable (Supplementary Fig. 9B). To determine the specific NOTCH signaling implicated downstream of GPX2, we first examined all NOTCH ligands and receptors in the TCGA database. We revealed that the high mRNA expression levels of NOTCH2 and NOTCH3 are positively correlated with GPX2 (Supplementary Fig. 10). We further detected that GPX2 predominantly regulates the expression of NOTCH3 in HNSCC cells (Fig. 5C, D and Supplementary Fig. 9D). According to RNA-seq data from the FaDu cell line, we found a significant decrease of NOTCH3 following NRF2 knockout (Fig. 5C, D and Supplementary Fig. 11). The cohort analysis of the TCGA database demonstrated a strong association between the mRNA expression of NOTCH3 and GPX2 (R = 0.33, p = 6.1e-15; Fig. 5E, F and Supplementary Fig. 12).
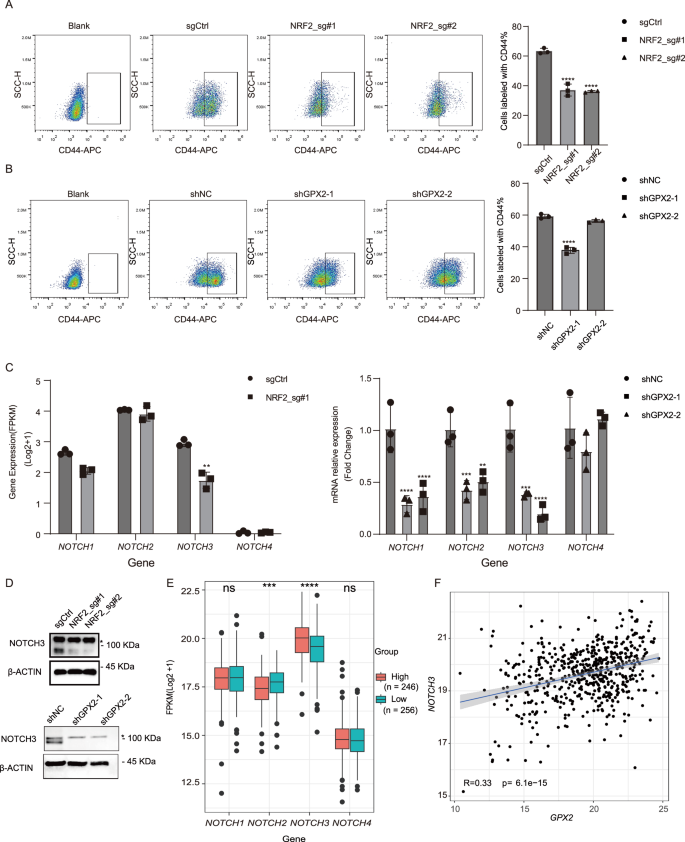
A The proportion of CSCs in FaDu cells was markedly diminished upon NRF2 knockout by CD44 staining. Mean ± SD, n = 3, ****P < 0.0001. B The proportion of CSCs in FaDu cells was markedly diminished upon GPX2 knockdown by CD44 staining. Mean ± SD, n = 3, ****P < 0.0001. C NOTCH3 expression in FaDu cells was significantly reduced upon NRF2 knockout by RNA-Seq. Additionally, the mRNA expression levels of NOTCH1, NOTCH2, and NOTCH3 in FaDu cells were reduced by RT-qPCR analysis. Mean ± SD, n = 3, **P < 0.01, ***P < 0.001, ****P < 0.0001. D The protein levels of NOTCH3 in FaDu cells were reduced following the depletion of either NRF2 or GPX2. “*” is an unspecific band. E Increased expression levels of NOTCH3 were observed in patients with high GPX2 expression in the TCGA-HNSCC cohort (n = 502). Mean ± SD, **P < 0.01, ****P < 0.0001, ns no significant. F The mRNA expression levels of NOTCH3 were positively correlated with GPX2 expression (R = 0.33, p = 6.1e-15). Abbreviations: FPKM Fragments Per Kilobase of exon model per Million mapped fragments.
NOTCH3 is critical for HNSCC progression
To determine whether activation of NOTCH3 is responsible for promoting the CSC phenotype of HNSCC, we performed lentivirus-mediated shRNA knockdown of NOTCH3 in FaDu cells. The knockdown efficiency was confirmed by RT-qPCR and western blot (Fig. 6A, B). Inhibition of NOTCH3 caused a significant reduction in cell proliferation, as measured by growth rate and colony formation assay (Fig. 6C, D). NOTCH3 knockdown reduced the size of the tumor spheres formed in the 3D culture system (Fig. 6E). Additionally, FaDu cells exhibited decreased migrating and invasive capability following NOTCH3 knockdown (Fig. 6F). NOTCH3 knockdown significantly increased the cellular level of ROS (Fig. 6G). An increase in the proportion of apoptotic cells was also observed in NOTCH3 knockdown cells (Fig. 6H). The depletion of NOTCH3 markedly diminished the proportion of CSCs (Fig. 6I and Supplementary Fig. 13). Moreover, NOTCH3 knockdown in FaDu cells led to smaller xenograft tumors and reduced proliferation than in controls (Fig. 6J). Consistently, high expression of GPX2 markedly enhanced NOTCH3 levels in HNSCC patients (Fig. 6K). Therefore, these results suggest that NOTCH signaling, mediated by NOTCH3, promotes the progression of HNSCC.
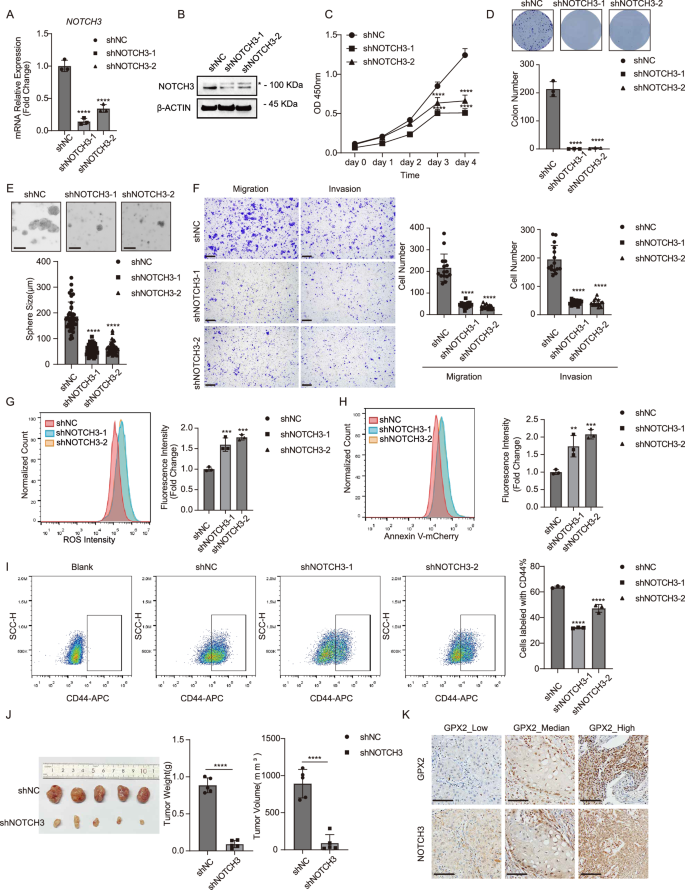
A NOTCH3 expression in FaDu cells was reduced upon NOTCH3 knockdown measured by RT-qPCR analysis. Mean ± SD, n = 3, ****P < 0.0001. B The protein levels of NOTCH3 in FaDu cells were reduced following NOTCH3 depletion. “*” is an unspecific band. C Proliferation of FaDu cells was significantly inhibited upon NOTCH3 knockdown. Mean ± SD, n = 3, ****P < 0.0001. D Colony formation capability of FaDu cells was impaired upon NOTCH3 knockdown. Mean ± SD, n = 3, ****P < 0.0001. E The ability of FaDu cells to form spheres was impaired upon NOTCH3 knockdown (scale bar = 200 μm). Mean ± SD, n > 3, ****P < 0.0001. F The abilities of migration and invasion in FaDu cells were impaired upon NOTCH3 knockdown (scale bar = 200 μm). Mean ± SD, n = 3, ****P < 0.0001. G NOTCH3 depletion dramatically induced ROS levels in FaDu cells measured by flow cytometry. Mean ± SD, n = 3, ***P < 0.001. H NOTCH3 depletion dramatically induced apoptosis in FaDu cells assessed by Annexin V-mCherry staining. Mean ± SD, n = 3, **P < 0.01, ***P < 0.0001. I The proportion of CSCs in FaDu cells was markedly diminished upon NOTCH3 knockdown by CD44 staining. Mean ± SD, n = 3, ****P < 0.0001. J NOTCH3 depletion significantly suppressed subcutaneous tumor growth in nude mice (n = 5 for each group). Mean ± SD, ****P < 0.0001. K Representative immunohistochemical staining demonstrated that GPX2 expression was strongly correlated with NOTCH3 in human HNSCC patients (scale bar = 100 μm).
Discussion
The role of NRF2 in the malignant progression of cancers has emerged as a focal point of contemporary oncological research. Notably, activation of NRF2 has been associated with a poorer overall survival rate in various cancers, suggesting that NRF2 may play a critical role in cancer pathogenesis [47]. Yet the molecular mechanisms of NRF2 regulating cancer progression remain unexplored. In this study, we elucidated that GPX2 functions as a downstream target of NRF2 in HNSCC. The patients exhibiting elevated activation of NRF2 experience an upregulation of GPX2 mRNA, correlating with decreased overall survival rates. We demonstrate that GPX2 regulates HNSCC cell proliferation, migration, and metastasis by regulating CSC phenotype. Analysis of TCGA database revealed that mRNA expression of NOTCH3 was significantly higher in patients with increased GPX2 expression. We further revealed that the inhibition of GPX2 notably reduced the expression of NOTCH3 in both FaDu and Detroit 562 cells. These findings suggest a pivotal role for the NRF2-GPX2-NOTCH3 axis in NOTCH3-mediated regulation of CSCs in HNSCC (Fig. 7).
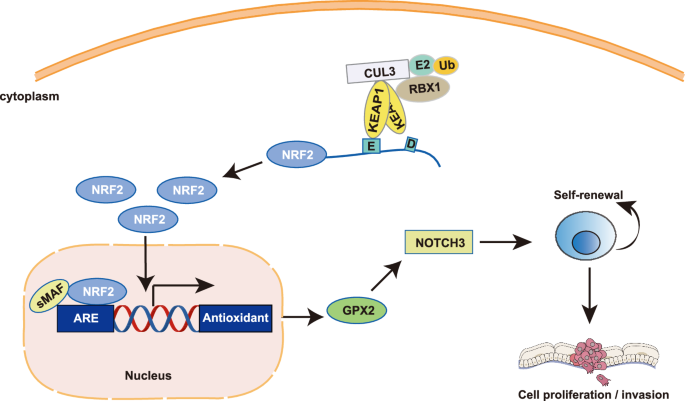
A schematic diagram indicates the proposed mechanism of the NRF2-GPX2-NOTCH3 axis regulation in HNSCC progression.
NRF2 mutations are specifically frequent in multiple squamous cell carcinomas (SCC) of the lung, skin, esophagus, and larynx [30, 48, 49]. Most of these SCC-associated NRF2 mutations harbor gain-of-function activity [50]. Our analysis of a cohort of HNSCC cases has elucidated the clinical relevance of NRF2 mutation. We identified that approximately 12% of patients exhibited mutations in the NRF2 complex. These mutations were strongly correlated with tumor progression and emerged as a significant prognostic factor.
Numerous studies have highlighted that activation of NRF2 contributes to cancer progression and metastasis, while also endowing resistance to chemotherapy and radiotherapy [12,13,14,15,16]. Our study suggests that NRF2 regulates the expression of multidrug-resistant proteins ABCC1, ABCC3, and ABCC5, potentially contributing to the chemoresistance observed in cancer cells with activated NRF2. Recent studies have revealed that NRF2 directly regulates the expression of gene groups that are related to cellular metabolism, in addition to the detoxification response [51]. Upon depleting NRF2, we revealed that the most significantly altered genes were predominantly linked to cellular metabolism. We further found that GPX2 was significantly reduced in NRF2 knockout cells.
GPX2 is glutathione peroxidase, playing a crucial role in maintaining cellular redox balance by regulating the levels of reactive oxygen and nitrogen species. It functions within the antioxidant system, leveraging the GSH (reduced glutathione) and GSSG (oxidized glutathione) cycle to protect cells against oxidative damage [52]. The antioxidant function of GPX2 is evident not only by its enzymatic activity but also by its upregulation in response to oxidative stress. A prominent pathway for the induction of GPX2 expression involves the KEAP1/NRF2 complex [53]. Kleeburger’s group further identified potential NRF2 activation sites within the GPX2 gene, suggesting a direct regulatory mechanism by NRF2 on GPX2 expression [54]. An increasing number of studies indicate that GPX2 is also involved in the development of cancers [27, 28]. Many studies have shown that high level of GPX2 promotes tumor growth, metastasis, and drug resistance, while reducing its expression helps inhibit tumor development [27, 55]. When we depleted GPX2 in HNSCC, the growth of tumor cells was significantly inhibited, while the proportion of apoptotic cells substantially increased. Indeed, GPX2 was demonstrated to play contrasting roles across various cancers. Inhibiting glutathione peroxidase (GPx) enzymes have been shown to enhance drug sensitivity [56, 57]. Elevated expression of the GPX2 is associated with chemoresistance in non-small cell lung cancers (NSCLCs) [58]. However, the knockdown of GPX2 does not affect the expression of chemoresistance proteins in HNSCC cancer cells. MRPs play key roles in facilitating GSH export and maintaining its homeostasis, as well as exporting oxidized glutathione derivatives(e.g., glutathione disulfide (GSSG), S-nitrosoglutathione (GS-NO), and glutathione-metal complexes) and other GSH S-conjugates [59]. Depletion of GPX2 disrupts the intracellular GSH/GSSG ratio, leading to an excess of GSH within the cells. This imbalance may explain why GPX2 inhibition does not reduce the expression of chemoresistance genes. Concurrently, MRPs mediate the export of GSH, its oxidized derivatives, and GSH S-conjugates, which are crucial for maintaining cellular homeostasis and potentially contribute to drug resistance. Loss of GPX2 reduces oxidative phosphorylation (OXPHOS) and enhances aerobic glycolysis to promote malignant progression in breast cancer [23]. This controversial function of GPX2 could be attributed to tissue-specific factors.
We observed increased apoptosis caused by the absence of GPX2 in HNSCC. Considering a susceptibility of stem cells to apoptotic stimuli [41, 60], the emerging evidence following GPX2 depletion prompts us to test whether GPX2 promotes tumor progression by affecting CSCs. By performing CD44 staining and ALDEFLUOR assay on GPX2 knockdown cells, we observed a significant reduction in the CSC population, indicating that GPX2 plays a role in the maintenance of CSCs. Aberrant activation of pathways regulating stem cell self-renewal, such as NOTCH, Hedgehog (HH), and Wnt, are also pivotal in the tumorigenic potential of CSCs [46]. Dysregulation of these pathways contributes to tumor progression [61]. We examined all three signaling pathways and found that NOTCH signaling was disrupted in GPX2-depleted HNSCC cells, especially NOTCH3. The NOTCH signaling has been reported to associate with CSCs [62]. NOTCH1 and NOTCH2 facilitate cancer metastasis and contribute to a poor prognosis [63,64,65]. NOTCH3 promotes tumor development in various cancers, although it has been shown to inhibit tumor growth in breast cancer through the activation of PTEN and subsequent inhibition of the AKT-mTOR pathway [66]. Kondratyev M et al. have also verified the oncogenic role of NOTCH3 in HNSCC [67]. Of note, NRF2 is a direct activator of the NOTCH3 enhancer, and the co-expression of NRF2 and NOTCH3 is associated with a poor prognosis in lung adenocarcinoma [68]. We further showed that loss of NOTCH3 dramatically reduced CSC population, subsequently preventing tumor growth and metastasis.
In conclusion, our findings illustrate that aberrant activation of NRF2 contributes to acquisition of malignant features and poor prognosis through NRF2-GPX2-NOTCH3 axis. Therefore, targeting the involvement of NRF2-GPX2-NOTCH3 axis holds potential as a therapeutic strategy for treating HNSCC characterized by NRF2 activation.
Materials and methods
Bioinformatic data collection and analysis
The transcriptome data and clinical information data of HNSCC patients were downloaded from UCSC XENA (https://xenabrowser.net/). Patients were divided into two groups based on the expression level of the corresponding genes. Volcano plot and boxplot were performed with R “ggplot2” package. The survival analysis was analyzed using the Kaplan-Meier plotter database (https://kmplot.com).
Tissue samples
Paraffin-embedded surgical tissue samples were collected from 5 patients with head and neck squamous cell carcinoma (HNSCC) who underwent curative surgery at Jiangxi Cancer Hospital (Jiangxi, China). The research was carried out in compliance with relevant national ethical guidelines and was approved by the Research Ethics Committee of Jiangxi Cancer Hospital under approval number (2024ky008).
Xenograft model
The animal experiments conducted in this study were ethically approved by the Institutional Animal Care and Use Committee of Zhejiang University (approval number: 20221576). Female and male Nu/Nu nude mice, aged six weeks, sourced from Slac (Shanghai, China), were utilized for the experiments. A total of 2 × 10⁶ cells were subcutaneously injected into the nude mice in a random manner. Tumor volumes were calculated using the formula: 1/2 × length × width2. The mice were euthanized ~30–36 days post-injection, and the tumors were subsequently collected for further analysis.
Cell culture
FaDu and Detroit 562 cell lines were purchased from Procell Life Science &Technology (Wuhan, China). Cells were maintained in Dulbecco’s Modified Eagle Medium (Gbico, MA, USA) supplemented with 10% fetal bovine serum (HATAKA, USA) and 1% penicillin-streptomycin (HATAKA) at 37 °C in a 5% CO2 atmosphere. Cells were verified through short tandem repeat (STR) analysis and routinely screened for mycoplasma contamination.
Generation of NRF2
KO, NRF2
KD, GPX2
KD, NOTCH3
KD cell lines
NRF2KO cells were established using pLentiCRISPRv2 expressing CAS9 and sgRNA described previously [69]. NRF2KD, GPX2KD, and NOTCH3KD cell lines were established using lentiviral infection. Lentiviral vectors containing short hairpin RNAs targeting NRF2, GPX2, and NOTCH3 were packaged into recombinant lentivirus using Lipofectamine™ 3000 (Thermofisher, MA, USA) in Opti-MEM medium according to the manufacturer’s protocol. The target sequence for shNRF2-1 is 5′- CTTGCATTAATTCGGGATATA-3′, for shNRF2-2 is 5′- CCGGCATTTCACTAAACACAA -3′. The target sequence for shGPX2-1 is 5′- GAAGGTAGATTTCAATACGTT-3′, for shGPX2-2 is 5′- CCTACCCTTATGATGACCCAT-3′. The target sequence for shNOTCH3-1 is 5′- GGTGATCGGCTCGGTAGTAAT-3′, for shNOTCH3-2 is 5′- CCAATGCCAACTGAAGAGGAT-3′.
Colony formation assay
Cells were resuspended and cultured in 6-well plates (1000 cells/ well) in medium with 10% FBS containing 5% CO2 about for 2 weeks. Cells were washed with PBS, fixed with 4% paraformaldehyde for 15 min and subsequently stained with 1% crystal violet (Biosharp, Beijing, China) for 10 min, subsequently imaged and quantified using ImageJ.
Cell growth assay
Cell growth was assessed through the utilization of the Cell Counting Kit-8 (CCK-8) (Vazyme, Nanjing, China). Cells were seeded at a density of 1500 cells per well into 96-well plates. 10 μl Cell Counting Kit-8 was added into each well. Then cells were incubated at 37 °C with 5% CO2 for 2 h. The absorbance was measured at 450 nm by a microplate reader (BioTeK, Winooski, USA) at different time points.
Transwell assay
For the invasion assay, 24-well plates, containing 6.5 mm upper transwell chamber with 8 μm polycarbonate membranes (Corning, NY, USA) suspended over the wells, were coated with 15 μl of ice-cold Matrigel™ (Corning, NY, USA). A total of 1 × 10⁵ cells was seeded into the upper chambers in 300 μl DMEM medium. A 500 μl volume of DMEM medium supplemented with 10% FBS was added to the lower chamber. Following a 48-h incubation, the cells located on the lower side of the membrane were fixed in 4% paraformaldehyde at room temperature for 20 min, stained with 1% crystal violet for 10 min, subsequently imaged and quantified using ImageJ. For the migration assay, a procedure similar to invasion assay was performed using the migration chamber without Matrigel and 5 × 10⁴ cells were seeded.
Immunohistochemistry
The sections were deparaffinized and sequentially hydrated with xylene and gradient alcohol, respectively. They were further repaired with a citrate buffer, using 3% hydrogen peroxide to quench endogenous peroxidase activity, and then were blocked with BSA. Subsequently, the sections were incubated with primary antibodies (mouse anti-Ki67, BD Pharmingen, 610968, 1:1000; mouse anti-NRF2, Santa Cruz, 365949, 1:50; rabbit anti-GPX2, GeneTex, GTX100292, 1:1000; rabbit anti-NOTCH3, Abcam, ab23426, 1:1000; mouse anti-NQO1, Proteintech, 67240-1-Ig, 1:10000; rabbit anti-KEAP1, Abclonal, A1820,1:200) overnight at 4 °C, followed by incubation with a secondary antibody kit (Proteintech, Cat No. PK10006) at room temperature for 1 h, and staining with DAB reagent. Finally, the sections were restained with hematoxylin, dehydrated through gradient alcohol, mounted, and photographed under a microscope (Olympus BX61, Shinjuku-ku, Japan).
Quantitative real-time PCR
Total RNA was extracted from cells with RNAex Pro RNA Reagent (AG, Changsha, China) and SteadyPure RNA Extraction Kit (AG) following manufacturer’s instructions. Reverse transcription was performed with Evo M-MLV Premix for qPCR (AG) with 500 ng RNA. The target cDNA was amplified by SYBR Green Pro Taq HS qPCR Kit (AG) and Bio-Rad CFX96 for detection (Bio-Rad, CA, USA). Gene expression was analyzed using the 2−ΔΔCt method with ACTB as a control. The primers are listed in Supplementary Table 1.
Western blot
Cells were lysed by RIPA lysis with 1% PMSF on ice for 30 min, and then centrifuged with 12,000×g at 4 °C for 30 min. The protein concentration was determined by an enhanced BCA protein assay kit (Beyotime). Equal amounts of protein were separated by an appropriate concentration of the SDS-PAGE gel and transferred into a polyvinylidene difluoride (PVDF) membrane with a Mini Trans-Blot Module (Bio-Rad). 5% skim milk was used to block the membrane for 1 h at room temperature. The membrane was incubated with different primary antibodies (rabbit anti-NRF2, Abclonal, A3577,1:1000; rabbit anti-NOTCH3, Abclonal, A13522,1:1000; rabbit anti-GCLC, Abclonal, A4499, 1:1000; mouse anti-NQO1, Proteintech, 67240-1-Ig,1:10000; rabbit anti-GPX2, Abclonal, A15999, 1:1000; rabbit anti-β-ACTIN, Bioworld, AP0060, 1:2000) at 4 °C overnight and incubated secondary antibodies (Goat-Anti-Mouse, ZENBIO,511103, 1:5000; Goat-Anti-Rabbit, ZENBIO,511203, 1:5000) sequentially for 1 h at room temperature. Target proteins were visualized using BeyoECL Plus kit (Beyotime).
3D sphere formation
Single cells (3000/well) were resuspended in the complete growth medium mixed with Matrigel (80% concentration), and then seeded in 24-well plates. The plates were incubated at 37 °C for 20 min to allow gelation. Upon completed gelation, 400 μl of completed growth medium was added in each well and cultured in a humidified incubator at 37°C with 5% CO2. Medium was changed every 3 days. The spheres were photographed and the size was measured on day 14.
Cell apoptosis measurement
To measure cell apoptosis, resuspended cells were incubated with Annexin V-mCherry (Beyotime, Shanghai, China) for 15 min in the dark. Zombie Aqua (Biolegend, San Diego, USA) was used as a counterstain to discriminate necrotic/dead cells from apoptotic cells. Stained cells were analyzed in an ACEA NovoCyteTM flow cytometer. Data were analyzed with FlowJo software (Ashland, Oregon, USA).
Flow cytometric analysis
To perform cell surface marker staining, the cells were dissociated with 0.25% Trypsin-EDTA and stained with PE-conjugated anti-CD133 (Cat. #311104; BioLegend, San Diego, USA) or APC-conjugated anti-CD44 (Cat. #338808; BioLegend) antibodies in FACS buffer (1 X PBS, 2% FBS, 0.2 mM EDTA) for 30 min with live/dead staining dye (Zombie Aqua, Biolegend) to exclude dead cells (Supplementary Fig. 3). Stained cells were analyzed in an ACEA NovoCyteTM flow cytometer. Data were analyzed with FlowJo software (Ashland, Oregon, USA).
ALDEFLUOR assays
The cellular ALDH activities were measured with the ALDEFLUOR assay (STEMCELL Technologies, Vancouver, Canada). Cells were resuspended and incubated with 1 μM ALDEFLUOR and incubated at 37 °C with 5% CO2 for 40 min. PI staining was used to exclude dead cells (Supplementary Fig. 6A). For negative controls, ALDH activity was blocked with 15 μM of the selective ALDH inhibitor DEAB. After incubation, cells were washed and underwent FACS analysis in an ACEA NovoCyteTM flow cytometer. ALDH activity was determined by the ALDEFLUOR signal (488 nm excitation, 515/20 nm emission). ALDH-positive cells were identified by fluorescence exceeding the region for control cells that were under identical conditions but with DEAB. Data were analyzed with FlowJo software (Ashland, Oregon, USA).
Reactive oxygen species analysis
The oxidation-sensitive fluorescent probe DCFH-DA(Beyotime) was used to detect the generation of ROS following the manufacturer’s instructions. Briefly, Cells were digested and washed three times with HBSS without phenol red and then incubated with 10 μM DCF-DA for 30 min in the dark at 37 °C. Cells then were analyzed in an ACEA NovoCyteTM flow cytometer. Data were analyzed with FlowJo software (Ashland, Oregon, USA).
Statistical analysis
The data was analyzed using GraphPad Prism version 9.5 software and presented as mean ± SD, derived from experiments with a minimum of three replicates. Differences between 2 groups were analyzed by a 2-tailed Students’ t test. A P value of 0.05 or less was considered statistically significant. Differences among 3 or more groups were analyzed using one-way ANOVA. The determination of sample size was informed by preliminary data, which provided insights into the variance within each group and the distinctions between them.


Responses