Offshore wind energy: assessing trace element inputs and the risks for co-location of aquaculture

Introduction
The global necessity to decarbonise energy generation means that renewables are the most appropriate solutions, with offshore wind one of the fastest-growing sectors1. For example, to meet UK-net zero targets there are currently 45 OWFs with 13 GW generating capacity, but the ambition is 100 GW by 2050. However, a 1.5 °C mean global temperature-compliant scenario will require 2500 GW by 20502. The speed and scale of this transition will have significant consequences across social, economic and environmental domains. Critical to ensuring that the transition does not generate a) unintended consequences for marine ecosystems and human health or b) risks to the blue economy (e.g. aquaculture) is a full assessment of OWF impacts. Whilst many effects of OWFs (e.g. anthropogenic sound on cetaceans or flight obstruction for sea birds) have now received considerable attention3, our study is the first to estimate contaminant inputs directly released from structures at scale and identify potential toxicological risks.
Steel makes up 90% of an Offshore Wind Turbine (OWT) with components protected from corrosion via different strategies4. In the underwater zone, methods include coatings, a corrosion allowance (i.e. thicker steel), galvanic anode cathodic protection (GACP) or impressed current cathodic protection (ICCP). Aluminium (Al)-based galvanic anodes (Al-GACP) and to a lesser extent zinc (Zn)-based galvanic anodes (Zn-GACP) are routinely used offshore resulting in substantial amounts of anode dissolving over the structure’s ~25-year life5. Whilst limited work5,6,7,8 has identified GACP to be a contaminant source (mainly trace elements [TEs]), there has been no assessment of the inputs under the OWFs expansion forecast. For example, a recent impact review by Rezaei et al.9 highlights corrosion as an issue, but provides no novel data on inputs. Our first aim is to generate UK/European seawater inputs for current and predicted OWF capacity incorporating diverse engineering approaches (e.g. OWT type and use of coatings) and ICCP. Inputs of Al, Zn (zinc) and In (indium), identified by Kirchgeorg et al.5 to be dominant TEs present in anodes, are then compared to other TE input sources. Whilst we recognise that many organic substances are released from OWFs10, TE ubiquity in OWF engineering, high relative toxicity in marine systems, and exceptional persistence make them a priority for research to inform OWF expansion.
OWT protection systems can increase TE seawater concentrations, but chemical persistence can lead to sediment accumulation11. EIAs (environmental impact assessments) are usually required for OWF construction, however, commercial sensitivity, data obfuscation and limiting monitoring to construction stages have resulted in significant data gaps for environmental concentrations6. Zn impacts have been heavily studied supporting the formalisation of W/SQVs (water and sediment quality value)11. Despite Al’s abundance, it is relatively understudied for marine toxicity. Yet, it is genotoxic and impacts reproduction/growth (see references within Botté et al.12) with studies now confirming direct Al-GACP impacts (e.g. ref. 13). An initial assessment for In indicates lower relative toxicity14. Using available industry sources, we collate the TE concentration data for OWF developments. This will enable us to compare these against relevant offshore water and sediment concentrations, thus assessing the current evidence for enrichment near OWF developments. Comparisons with W/SQVs provide additional information on toxicity risk against standard thresholds.
Co-location of activities at OWFs offers the opportunity to provide products which have ecological, economic or social value15. Aquaculture is key to mitigating declining global catches, but with space constraints nearshore, co-location with offshore energy production could have significant benefits including mounting cage and hatchery systems16. Lower trophic species make up ~50% all aquaculture production with 8.2 million tonnes of mussels/oysters and 34.7 million tonnes of seaweeds produced in 201917. In addition to food, they can provide other key ecosystem services e.g. carbon sequestration and nutrient bioremediation18. Nitrogen, phosphorus and carbon are used for both shell and tissue growth, and are removed from the ecosystem when the organisms are harvested19. These NBSs (nature-based solutions) are, therefore, an attractive investment proposition for co-location with significant policymaker and industry interest especially in the context of offsetting OWF impacts and contributing to nascent carbon/nutrient/biodiversity trading schemes.
Seaweed and bivalves accumulate contaminants in tissues from feeding or by direct uptake, with elevated concentrations having significant toxicological effects11,20 plus risks for human health via consumption21. Firstly, we collate tissue concentrations for three dominant aquaculture species: Pacific oyster (Magallana [Crassostrea] gigas), blue mussel (Mytilus edulis) and sugar kelp (Saccarhina latissima)17. Using standardised consumption levels we calculate the percentage of an adult’s TWI (Tolerable Weekly Intake) that would be accounted for by consuming tissue with ‘typical’ and ‘high’ concentrations, thus providing the first data to inform ecotoxicological risks to the organism or for humans via consumption.
Currently, co-location remains at the pilot/research stage within Europe22, but as demand is already established (e.g. in 2023 Amazon Com. announced €1.5 million investment to create the world’s first co-located commercial-scale seaweed culture facility in the North Sea) it is essential that the industry is fully cognisant of potential TE contamination risks prior to commercial scale deployment. The juxtaposition of significant OWF TE inputs with potentially elevated sediment/water/tissue concentrations will provide the energy industry, aquaculture practitioners, offshore regulators and global investors with a ‘road map’ for implementing changes in policies so unintended consequences of rapid OWF expansion to the blue economy, ecosystems and human health are minimised.
Methods
Numbers of OWTs and associated structures
To determine TE inputs the number and type of OWTs are required. As this information is not available globally, we used the 4C Offshore website23 for waters around the UK (a global leader in offshore wind). The website has locations, names, turbine numbers and foundation types (monopile, jacket, gravity and floating), plus offshore sub-station (OSS) numbers fully commissioned as of June 2023 within the North Atlantic, Channel, North, Celtic and Irish Seas. This level of detail is unprecedented; providing a comprehensive dataset that is transferable to other regions/countries as well as being scalable. HVDCCs (High Voltage Direct Current Converter) stations are needed to convert the generated electricity to direct current so it can be transported over greater distances from the OWF to shore. These also require corrosion protection, but as Dogger Bank (currently under construction) will be the first UK OWF to utilise an HVDC connection (https://www.sserenewables.com/offshore-wind/projects/dogger-bank/), HVDCC stations were not included in UK calculations for current inputs. As protection systems data were not available on the 4C Offshore website, a Google search was conducted to identify the method (GACP or ICCP) per OWF (it was assumed that the same method was used for every turbine and associated OSS for an OWF). Where detailed information was not forthcoming, for example, if it was stated that “sacrificial anodes” were used, but didn’t specify whether that referred to Al-GACP or Zn-GACP, or where there was an unknown strategy, the proportions of known methods were calculated and these applied (Supplementary Table 1).
Anode protection levels and TE inputs
Anodes corrode in place of the steel, therefore, the anode mass directly corresponds to lifetime inputs. There are many design and construction standardisation organisations that produce codes and guidance for the offshore wind industry (e.g. International Electrochemical Commission [IEC], International Organisation for Standardization Commission [ISO], European Committee for Standardization [CEN], British Standards Institute [BSI], American Petroleum Institute [API], Deutsches Institut für Normung [DIN], Det Norske Veritas [DNV]). These are used to assure the use of the best techniques with specific cathodic protection design guidance provided by DNV-RP-B40124 and DNVGL-RP-041625. The latter states that ‘it is mandatory that external surfaces in the submerged zone shall have cathodic protection. The use of a coating is optional and is then primarily intended to reduce the required cathodic protection capacity’. Price and Figueira26, state that protective coatings are required for atmospheric, splash and tidal zones; however, they are optional for the submerged surfaces’, whilst Erdogan and Swain27, cites Mathiesen et al.28, and Osvoll et al.29, who state that all towers and transition pieces are coated, but the majority of the monopiles are uncoated. Finally, Momber et al.30 stated: ‘permanently exposed sections (under water zone) are found to be uncoated in almost all commercial specifications. These areas are predominantly protected with cathodic protection systems. In three cases only, submerged sections were coated, whereby the coating was a one-layer EP epoxy coating.’ In the permanently submerged underwater zone it was the mass of the OWT that is taken forward for the calculations of anode protection required based on DNV-RP-B40124 and DNVGL-RP-041625. Based on the evidence above and that the proportion of OWFs that use coatings in the underwater zone is not available for the UK we assumed that currently within the UK all structures are uncoated.
To estimate the mass of TEs released (excluding those at very low concentrations such as lead and cadmium), it was necessary to calculate the amount of anode required to protect each turbine type, OSS platform and HVDCC station. ICCP uses chemically inert anodes to deliver a direct current emitting significantly lower levels of chemicals31. As Al, Zn and In are not listed as a constituent of ICCP-anodes5 ICCP was not included. The annualized amount of Al-anode required to protect uncoated structures has been calculated by Kirchgeorg et al.5, but for a limited number of types (monopiles, jackets and OSS platforms), thus excluding those rapidly gaining in popularity (gravity and floating platforms). Over a 25-year lifetime 13 t is required to protect a single monopile foundation, 22.5 t for a jacket foundation and 150 t for an OSS platform (Supplementary Table 2). Gravity OWTs have a foundation jacket with diverse dimensions, however, Mathern et al.32 state that they are of concrete construction and so do not contribute to the anode calculations. The steel shaft that they support does require anode protection and, although lengths do vary28, as the stated dimensions reflect a similar surface area to monopiles these were assigned 13 t over the lifetime of anode protection in our calculations. Inputs from floating OWTs were calculated using the Hywind OWF. Although we recognise that the surface area of steel to be protected ultimately determines the amount of anode required, surface area data are not available for structures. Therefore, in line with previous studies5 we use the ratio of mass for scaling; Hywind floating structures weigh 2300 tonnes33, v. a monopile mass (805 t)5, a floating platform was estimated to require 37 t of Al-anode over its lifetime. HVDCC stations are assumed to be mounted on jackets with a mean mass of 5131 t (based on nine German HVDCC stations [mass sourced from online data sources]) in the submerged zone23 and were incorporated into the calculations.
To calculate the amount of Al, Zn and In the mean proportions of each metal in anodes were calculated (Al: 96.5%; Zn: 4.125%; In: 0.0325% [Supplementary Table 3])5. The technical performance of anodes differs with Al-GACP having higher electrochemical capacity and lower density (2651 Ah kg−1, 2.78 kg dm3) than Zn-GACP (780 Ah kg−1, 7.13 kg dm3). More Zn anode (2.5x) is, therefore, required for the same level of protection. This was incorporated into the calculations, but using mean TE proportions (Zn: 94.5%; Al: 0.3%) from Reese et al.34 that make up the Zn-GACP anodes. Although country-specific limitations on the use of Zn-GACP are recognised (e.g. Germany) the proportion of OWTs that use Zn-GACP is calculated from the UK protection strategy as no other European country data were publicly available (Supplementary Table 4). Internal corrosion protection within monopiles and that retrofitting where anodes have failed/or been used up were not included as these data were not publicly available. For national and European scaleup current numbers were scaled to 2030 and 2050, based on government pledges. The UK has 13 GW installed capacity, but its ambition is 50 GW by 2030 (https://www.gov.uk/government/news/new-plans-to-make-uk-world-leader-in-green-energy) and 100 GW by 2050 (https://www.rechargenews.com/wind/time-is-limited-and-2022-will-be-key-to-the-uk-hitting-its-offshore-wind-goals/2-1-1140860). The EU has equally ambitious goals: 109–112 GW by 2030 and 281–354 GW by 2050 (https://energy.ec.europa.eu/news/member-states-agree-new-ambition-expanding-offshore-renewable-energy-2023-01-19_en). For all OWT types and OSSs the current proportions of each structure type were retained for future UK scaling and both current and future scenarios in Europe. However, we identified country-specific divergence in the number of HVDCC stations with nine in Germany in 2023. We, therefore, used this for the current scaling in Europe, but used ten HVDCCs (includes Dogger Bank) for the future scaling in UK23. Different coatings are also available for application to OWF structures with more robust coatings generating more reductions. Therefore, our future emissions estimates incorporated Category 1: 16%27; Category 2: 54.5%27, and Category 3: 71% mean of estimates27,28,35 (Supplementary Table 5).
OWT generating capacity has already increased by ~x4 since the first OWFs were built, therefore, it is expected that in the future fewer OWTs will be required to produce the same amounts36. However, we assume here that there is a 1 to 1 relation between increasing GW generation capacity and number of OWTs. We recognise that this may result in an overestimate of the amount of TE released, but this assumption is justified as it was not possible to find a robust estimate of future OWT efficiency changes nor which technological advances will be applied more widely to the industry and what impact they will have on generating capacity.
TEs enter the marine environment from many sources including rivers, direct discharges (e.g. industrial inputs) and from the atmosphere. We used the UK as a source country comparison with data available for both rivers/direct discharge37 and atmospheric inputs38). OSPAR37 also collate river/direct discharge data by input region, which can be compared with OWF inputs at the European scale as the majority of OWFs are in the North Atlantic23, thus combining the North Sea, Channel, Kattegat and Skagerrak areas. Richir et al.39 also calculated additional Zn inputs from anti-fouling paints and sacrificial anodes on recreational vessels.
EIAs and monitoring sacrificial anodes inputs
In the UK, EIAs are collated ahead of commissioning any OWFs with The Crown Estate holding these documents40. By mining this database, information and reports were interrogated to demonstrate whether TEs were measured pre- and post- construction; and if anode metal release and marine corrosion, in general, were mentioned/discussed. Each report was word searched (“metal”, “anode”, “aluminium”, “zinc”, “indium”, “corro” [covers “corroded” / “corrosion” / “corrode” etc], “sediment” and “water”) to extract detail. Where documents could not be located on the Marine Data Exchange, a Google search of publicly available documents was also conducted (Supplementary Table 6].
Background TE concentrations (water and sediment)
Data were extracted from the global literature using Web of Science/Google Scholar and assessed for relevance (geographic location) and checked for suitable sediment digestion technique, use of calibration and reference standards. Briefly (see details in references cited in Table 1) water samples for In were pre-filtered, acidified and analysed using the isotope dilution method, Al was determined using electron capture detection-gas chromatography, whilst samples for Zn were digested with HCl followed by graphite furnace atomic absorption spectrophotometry. Water was also analysed by inductively coupled plasma-mass spectrometry for all TEs without isotope dilution41. For sediment, In was measured using neutron-activation analysis, Zn was measured on digested <2 mm fraction by direct reading DC arc emission spectrometry for the older samples42 and by inductively coupled plasma-mass spectrometry of the digested <63 µm fraction prior to normalisation for the more recent samples43. In contrast, Leleyter et al.44 used the <1 mm fraction, whilst both, BSH and Hereon41 and Ebeling et al.45 used the <20 µm fraction. Only TE seawater (µg or ng l−1) and sediment concentrations (presented as mg kg−1 dry mass) from offshore areas (>100 km from the coast) in the North Sea and North Atlantic Ocean were selected. Not only are these geographically more relevant to the location of the majority of UK and European OWFs, but they are likely to be less influenced by coastal inputs, reflecting the offshore nature of OWFs. TE concentrations vary with mean sediment particle size11, therefore, concentrations for mud, sand and gravel were selected if available, which also accounts for diverse substrates used for OWF construction.
Internationally, Water and Sediment Quality Guidelines have been established which set W/SQVs; thresholds or ecologically ‘safe’ concentrations. These serve as reference tools for management and are determined using risk-based assessments. Whilst several SQVs exist for Zn46 the recently revised ANZECC/ARMCANZ were used as the most current47. These consist of Effects Range Low (ERL) and Effects Range Median (ERM): below the ERL, adverse effects on the biota rarely occur; between the ERL and the ERM, adverse effects on the biota may occasionally occur; above the ERM, adverse effects on the biota are frequent. WQVs for Zn were also extracted from OSPAR48 for marine waters, but the absence of marine Al S/WQVs prompted Golding et al.49 and van Dam et al.50 to derive WQVs, which have been included. No WQV and SQV exist for In.
TE tissue concentrations for co-culture species
Whole tissue concentrations (µg g−1 dry mass) of Al and Zn (no In-data were obtained) were sourced for the three species. As no published tissue concentration data were available from organisms in close proximity to OWFs, we used the global ecotoxicological literature. For Zn, Rainbow11 generated ‘typical’ (clean and low anthropogenically-impacted sites) and ‘high’ ranges (highly contaminated sites) for M. gigas and M. edulis, from a number of datasets (see references cited within Rainbow11). The less frequent analysis of tissue concentrations for Zn in S. latissima and Al (all species) meant that the lowest and highest reported concentrations were used. However, it should be noted that a high concentration did not necessarily correspond with a sampling location that could be expected to be polluted (Supplementary Table 7).
Food is a major source of contaminant exposure to humans and a health risk, so setting maximum recommended limits (thresholds) for seafood is one regulatory approach. For many reasons detailed in Rainbow11, guidance consumption values are preferred. Published TWI limits of 1 mg kg−1 of human body mass for Zn and Al51,52 were paired with mean adult human mass (68.5 kg)53 to generate adult TWIs. No data are available for In. Dry mass of tissues for M. gigas54 and M. edulis55 from marketable-sized individuals were multiplied by a routine number consumed in one adult meal (i.e. six oysters and 30 mussels) (https://www.whitestoneoysters.com/blogs/an-oyster-life/how-many-oyster-should-you-order; https://www.gofish.co.uk/fresh-shetland-mussels.html). Rubio et al.56 state that algal consumption should be limited to ~5 g of dehydrated algae per day and was assumed to be equivalent to dry mass. For each TE/species combination the highest and lowest values were used to generate percentage TWI contributions.
Results
Marine inputs
Currently, there are 2652 OWTs with 13 GW generating capacity of electricity for the UK supported by 42 OSSs (Fig. 1, Supplementary Table 1). The majority of OWTs are monopiles with a small number of jacket and gravity systems and only 11 floating platforms located in two OWFs. We estimate that 2143 OWTs use GACP dominated by Al-GACP, but with 262 OWTs using Zn-GACP and 245 using ICCP. The dominance of the monopile design is linked to the highest TE inputs (Al: 936 t y−1, Zn: 286 t y−1, In: 0.3 t y−1). Adding in the other designs and excluding the negligible ICCP amounts generates current UK OWF sector input estimates of: 1380 t y−1 Al, 497 t y−1 Zn and 0.5 t y−1 In (Fig. 1), which would be multiplied by 25 to calculate the release over the functional OWT/OSS lifetime.

a Numbers of fully commissioned (as of 2023) OWT designs and OSSs and the associated proportion protected in UK waters by: Al-GACP (grey), Zn-GACP (orange) and ICCP (green). Input amounts (t y−1) for each TE by OWT design including OSS and combined (total), b grey: Al, c orange: Zn, d blue: In.
Based on Fig. 1’s annualised data with the inclusion of HVDCC stations we can calculate the inputs for Europe’s current capacity to be: 3219 t y−1 Al, 1148 t y−1 Zn and 1.2 t y−1 In (Fig. 2). The UK’s generation capacity target for 2030 is expected to double to 100 GW by 2050 generating annual UK TE input estimates of: Al: 10,683 t y−1, Zn: 3850 t y−1 and In: 3.9 t y−1. Europe’s current generating capacity of 30 GW is expected to increase ~9–12× by 2050 releasing 30,148–37,980 t y−1 Al, 10,756–13,550 t y−1 Zn and 10.9–13.7 t y−1 In. Finally, if we use the International Renewable Energy Agency’s (IRENA) prediction that 2500 GW2 is required to achieve a 1.5 °C compliant scenario then 268,220 t y−1 Al, 95,692 t y−1 Zn and 97 t y−1 In would be released globally by 2050.
Although both Al and In have many anthropogenic sources including fossil fuel consumption, electronic manufacture and industrial activities12,14, input estimates have not been generated. In contrast, OSPAR37 estimated combined direct and riverine annual Zn inputs of 1662–1754 t into the North Sea, Channel, Kattegat and Skagerrak. OSPAR37 also estimated that the rivers and direct discharges from the UK inputted 1028–1184 t annually, whilst UK atmospheric emissions for 2019 were 460 t38. Additional Zn inputs from UK recreational vessels using Zn-GACP protection and anti-fouling coatings are also substantial (1006 t y−1)39, although the location is not specified (Fig. 2).

a Current and predicted (government ambition) future OWF electricity generating capacity (GW) for UK (magenta) and Europe (purple). Error bars symbolise ranges for 2030 (109–112 GW) and 2050 (281–354 GW) for Europe. TE inputs (t yr−1) of b Al (grey), c Zn (orange) and d In (blue) currently and predicted for 2030 and 2050. Current Zn OWF inputs are compared to: D + R (UK): direct + river discharges from the UK; D + R (NA): direct + river discharges into the North Atlantic, combining the North Sea (stippled), Channel (checker) and Kattegat and Skagerrak (striped) areas. Contributing OSPAR countries: Belgium, Denmark, France, Germany, The Netherlands, Norway, Sweden and The UK with data from OSPAR37. Atmos. (UK): UK atmospheric emissions are from Richmond et al.38. Rec. ves. (UK): inputs from recreational vessels registered in the UK (2019) from Zn-GACP (stippled) and from anti-fouling coatings (checker) are from Richir et al.39. NB: Only the maximum range is presented for future European generating capacity, D + R (UK) and D + R (NA) inputs for simplicity. Box: different categories of coatings if applied to a structure would reduce the amount of anode needed by 16, 54 or 71%, respectively, assuming the coating lasts for 25 years.
Water and sediment TE concentrations
TE concentrations for the North Sea/Atlantic region are presented in Table 1. The 0.26 µg l−1 Al concentration in North Atlantic surface waters from Alibo et al.57 is within the range reported by BSH and Hereon41 for OWFs in the German Bight (southern N. Sea, 2016–20). Both are much lower (~x100) than WQVs49,50. Unlike coastal/inshore areas, published Zn concentrations for offshore are sparse. A mean of 0.76 µg l−1 was generated for central North Sea sites sampled by Tappin et al.58. Like Al, this concentration falls within the range recorded by BSH and Hereon41, but unlike Al, was higher than the lower limit of the WQV range generated by OSPAR48. In is rarely measured in seawater, but Alibo et al.57 recorded a North Atlantic surface water concentration of 0.067 ng l−1, which is towards the high end of the range measured by BSH and Hereon41.
Sediment concentrations depend on the TE characteristics, particle size and associated conditions such as hydrodynamics and bioturbation processes. Unlike many other TEs, Al is not routinely measured in offshore sediments for contamination assessments. Therefore, the 28,000 mg kg−1 48 in Table 1 is for unconsolidated Channel sediment. The mean concentrations presented from OSPAR43, which collects Al-data to normalise concentrations of other TEs, range from 19,000 mg kg−1 from the Shetland basin at the border of the N. Sea and N. Atlantic to 78,000 mg kg−1 from the southern N. Sea, closer to the German coast. All concentrations align with the 13–90,000 mg kg−1 range reported by BSH and Hereon41 from an OWF in the German Bight. Stevenson’s42 extensive sampling enabled data to be separated into mud, sand and gravel for Zn with mean concentrations well below the 200 mg kg−1 ERL for all types. Concentrations varied more widely from the OSPAR43 data with a mean of just 18 mg kg−1 from the Shetland basin, increasing to 136 mg kg−1 closer to the German coast, but with mean concentrations also below the 200 mg kg−1 ERL. The 807 mg kg−1 upper value published by BSH and Hereon41 is nearly twice the revised ERM, whilst the lower range value approaches the ERL47 and is close to the OSPAR43 concentrations from the southern N. Sea (Netherlands and Germany). In contrast, the range (collected over variable distances from OWTs) reported by Degraer et al.59 from Belgian OWFs is two orders of magnitude lower. Only one study60 recorded In concentrations from the region. The 0.049 mg kg−1 mean of two North Atlantic deep-sea muds is much lower than the range reported by BSH and Hereon41. A recent scientific study by Ebeling et al.45 also found the mean Al concentration (from 2022) to align with those reported by OSPAR43 and the mean 0.09 mg kg−1 In concentration to be similar to the range reported by BSH and Hereon41. In contrast, the mean Zn concentration (242 mg kg−1) is above the ERL, although some distance below the ERM.
Tissue concentrations
Typical/low and high tissue Zn and Al concentrations for the three species are represented in Fig. 3 and in Supplementary Table 7, but to the authors’ knowledge, no data have been published for In. M. gigas is an excellent Zn-accumulator with concentrations at least an order of magnitude higher than M. edulis from all site types. S. latissima does not accumulate high amounts of Zn with values ranging between 8 and 74 µg g−1 for wild and cultured seaweed, although the sites are unlikely to be anthropogenically contaminated. This is substantially lower than the range for M. gigas from both typical and highly contaminated sites. Although Al concentrations vary less dramatically across the species than Zn, M. edulis accumulates higher amounts at both levels (low: 168 µg g−1, high: 1237 µg g−1) compared to M. gigas with S. latissima also able to accumulate high tissue concentrations.
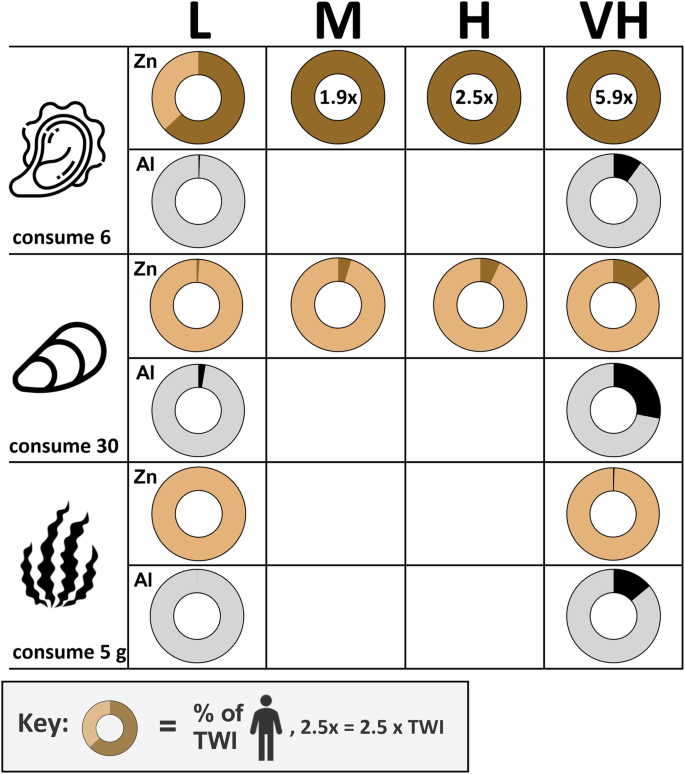
TWIs represented by darker colour of each ring as a percentage of a standard (68.48 kg) adult’s TWI if they consume 6 fresh oysters, 30 fresh mussels or 5 g of dried S. latissima seaweed with different TE tissue concentrations. Zn and Al tissue concentrations (µg g−1 dry mass) of M. gigas, M. edulis (M. galloprovincialis for Al) and S. latissima are represented as L (low), M (medium), H (high) and VH (very high), where available. For Zn for M. edulis and M. gigas the lower and higher values of the tissue concentration range from sites that are typical/low impact represent L and M, respectively. The lower and higher values of the range from sites that are highly anthropogenically impacted represent H and VH, respectively. For S. latissima (both TEs) and Al (M. edulis and M. gigas) L and VH correspond to maximum and minimum values from the global literature (Supplementary Table 7).
For M. gigas, one portion (six) of marketable-sized oysters would provide between 63% and 189% of a 68 kg adult’s TWI for Zn if the tissue had the lower range concentrations (L, M) of a typical/low impact site. However, this would increase to 252–589% if the tissue concentration was representative of H and VH sites. A portion of mussels from a highly contaminated site (H, VH) would provide 7–14% of Zn compared to just 0.8–3% for those with low tissue concentrations (L, M). The consumption of 5 g dry mass of S. latissima with a high Zn tissue concentration (VH) would provide only 0.54%. For M. edulis and S. latissima with high Al tissue concentrations, portions of both species would provide 28% and 14% of TWI, respectively.
Discussion
Metal corrosion is an age-old problem that has necessitated a diverse range of protection methods. Most prominent is GACP5, with our data confirming this for UK OWTs with a heavy bias to Al-GACP. This extensive use is due to high electrochemical capacity, low mass and low cost24, presumably generating operational savings compared to Zn-GACP. Structure type did not seem to determine GACP method as monopiles, jackets and OSSs were also protected with Zn-GACP, however, no specific reason was given for GACP selection.
Our estimates of current Al annual inputs from OWFs seem high, but are impossible to compare as, despite Al being intrinsic to human society, anthropogenic inputs have not been estimated12. The calculated 4% of OWTs using Zn-GACP and that Zn only makes up on average 4.1% of Al-GACP34 would result in lower Zn inputs from OWTs. However, as 2.5× the amount of Zn is needed it is about ~35% of the Al input, again with the majority also coming from monopiles. For Zn, GACP inputs at different spatial scales have only recently been calculated for recreational vessels39. Despite the much lower levels of anode protection per vessel needed, the higher estimate from UK vessels is due to vessel numbers (~500,000 UK-registered in 2019). In Europe, direct and riverine Zn discharge levels are country-specific, but inputs into the North Atlantic from multiple countries exceed 1000 t yr−1 37. Diverse sources including hydrocarbon combustion, mining and sewage11 mean that OWF Zn inputs are currently lower for the UK, but are already close to equivalent for Europe and the North Atlantic region. Anthropogenic marine inputs of In are estimated to be much smaller than either Zn or Al, but are also from atmospheric deposition (e.g. hydrocarbon combustion) and riverine/direct inputs (e.g. electronics manufacturing)14. Despite White and Hemond14 generating an anthrobiogeochemical cycle, no current relevant input amounts could be sourced to compare with our estimates. Although we have focused on the most abundant TEs released from GACP, others can also be present as impurities34. In addition, we strongly recommend our approach for other contaminants of known environmental risk as Blake et al.10 also highlighted the release of organics from epoxy/polyurethane coatings and other OWF operational processes.
Future government commitments to decarbonise energy generation can often be politically-motivated, but declining costs and subsidies have made offshore wind increasingly competitive/investable61. Regardless of the exact time the European target is reached, the capacity increase could potentially mean a ~12× increase in TE inputs from GACP. Globally, some estimate that 1000 GW of capacity will be installed by 205061, although the 2500 GW to keep to a 1.5 °C temperature increase2 would translate to even higher TE inputs. Disproportionate future investment in floating platforms may also lead to much higher inputs as the structures are generally larger requiring more GACP. Concomitant with the maturation of the OWF industry will be the use of larger foundation sizes. This will lead to an increase in the amount of anode per turbine, although it may be offset as fewer OWTs per OWF are needed combined with a higher power output per OWT36. In addition, other technological advances in construction may become more popular and increase the inputs from GACP. For example, gravity foundations can be constructed of steel or concrete/steel mix rather than concrete alone; these would also require cathodic protection32.
Corrosion protective coatings are made of metallic, inorganic or organic materials, applied to a metal’s surface to prevent corrosion and are well described in design guidance62. However, a number of studies26,27,30 state that they are infrequently used and optional in the underwater zone. Our current UK data reflect this by assuming that all structures are uncoated. Coatings are an obvious way for the industry to reduce TE inputs from anodes with the percentage reductions dramatically increasing across the three categories. However, it is important to recognise coatings can degrade rapidly resulting in failure before the 25-year lifetime of the OWT. As reapplication is extremely challenging to apply in situ62 this may explain the low current uptake. Coatings also release diverse chemicals themselves, which may have their own impacts/risks10, but their routine application across the industry would be an obvious way to reduce TE inputs from anodes by up to 71% (Supplementary Table 5).
As evidenced by the data in Fig. 1 and Supplementary Table 1, ICCP is currently an emerging technique in OWF construction in the UK with a low number of OWTs protected by this method. ICCP results in low (mg to g) TE inputs5, but no Al, Zn and In. Regardless of the potential impacts and risks of co-location from GACP (discussed below) we strongly recommend that ICCP is used for all future installations of OWTs, OSS platforms and HVDCC stations, drastically reducing TE inputs and negating associated risks. It is now possible to retrofit ICCP to monopiles31, which would also reduce current inputs. The extremely low industry take-up in countries like the UK compared to regular use in others (e.g. Germany) is surprising as it is an existing solution that ‘addresses’ the critical TE input issue. Whilst we recognise potential additional costs (e.g. direct electric current and monitoring), these should be framed against the risks highlighted below.
The collated data presented in Table 1 confirm that for Zn, offshore N. Atlantic water and sediment concentrations are orders of magnitude lower than many coastal areas and the generated W/SQVs. The exception is the 0.76 µg l−1 mean generated from data collected by Tappin et al.58, which falls within the WQV range of OSPAR48. It is not clear why this WQV is low compared to a chronic value of 81 µg l−1 stated by Buchman46, but WQGs should be seen as a starting framework rather than pass/fail thresholds47.
Despite Al’s toxicity (see below) and implied high anthropogenic inputs12 sampling in the North Atlantic has been limited63. This may be because a clear anthropogenic signal would be challenging to discern from background Earth concentrations with a corollary being a missing SQV and formalized WQV. We, therefore, recommend that this gap is rectified for Al as a priority. Unsurprisingly, the In concentrations are orders of magnitude lower than Zn and Al and its rarity is also reflected in only a few studies from the N. Atlantic and no W/SQVs. Although not as urgent as Al, determining baseline concentrations would be important to support the industry expansion.
Searches of the industry data repositories and associated reports found only one measuring all three TEs in water41 around OWTs. BSH and Hereon41, reported TE upper values for water exceeding the offshore background concentrations. Whilst the 0.21–0.67 µg l−1 Al range is much lower than derived WQVs49,50, the reported Zn concentration range does fall within the WQV range of OSPAR48. For sediment, the higher range values for all three TEs exceed the offshore background concentrations often by an order of magnitude and in some cases the lower range values do too. The higher TE concentrations (mainly sediment) reported by BSH and Hereon41 indicate a significant effect from sampling close to OWFs. However, it should be noted that the report does not allow for appropriate interrogation; specifically, analysis of different grain sizes; distinguishing an OWF signal from elevated background concentrations found within the German Bight or a broader comparison with other background TE concentrations reported in Table 1 and by Birch et al.64. In contrast, Degraer et al.’s59 study from the Belgium N. Sea recorded extremely low Zn sediment concentrations indicating minimal OWF contamination (Table 3). However, the authors state that this study was “..too limited to conclude that Zn concentrations have not increased by OWFs”. In addition, the concentrations are even lower than those expected at sites with minimal contamination (e.g. East Shetland basin) supporting cautious interpretation. The recent publication by Ebeling et al.45 does state concentrations of all three TEs to be within the known variability of North Sea sediments, but again this could be due to the proximity of the sampled OWF areas to major European estuaries. The paucity of OWF studies available, and the associated opaque detail of the two industry reports presented here highlight the significant data gaps within the EIA process resulting in an inability to assess current and future ecotoxicological risks of TE release from OWFs.
An EIA assesses the potential impact on the physical, biological and human environment during construction, operation and decommissioning (Supplementary Table 6). EIAs are a statutory part of the UK pre-construction/consenting phase, but just 6% of the 32 mentioned ‘marine corrosion’ as a broad issue (Fig. 4). ‘Metal release from anodes’ was mentioned in 25%, however, some stated a potential risk, whilst others were contradictory. Of those that collected samples during the pre-construction phase, 66% measured Zn, 20% measured Al and none measured In, with a further 20% of reports having no relevant data. Only four reports included Zn measurements during the operational phase and with sampling due to additional OWT construction within an existing OWF. Generally, sampling that did occur was not robust making it impossible to disentangle background effects and time; i.e. BACI sampling was not stated in any report. Considering the amounts of TEs released across the North Atlantic combined with toxicity risks (see below), it is very surprising that sacrificial anodes are largely ignored as part of the UK regulatory process. This paucity of data may be because an EIA will only assess an impact if it has a significant effect. Therefore, an overlooked impact will not have any data on effects and so not be included in an EIA. This ‘circular argument’ may be UK-specific, but is reflected in reports from Belgium (e.g. ref. 59) and Germany (e.g. ref. 41). It is also a systemic scientific oversight as: a) none of the 117 primary studies recorded in a global database65 investigated TE effects; b) was not identified as an issue within key OWF reviews (e.g. ref. 3); and c) was not highlighted in a benthic impact evidence map from the Scottish government (https://www.gov.scot/publications/benthic-species-specialist-receptor-group/). Whilst it is beyond this study’s scope to discuss country/region-specific legislation, we strongly recommend that all regulators embed scientifically robust TE (and organics) sampling strategies into EIAs. For example, Wang et al.66 have recently taken this approach, although it is unclear if this was part of Chinese regulatory processes. Regulatory changes (e.g. extending the EIAs into the operational phase) will be critical to ensure that risks to the benthos and most importantly species co-located for their ecosystem service provision and/or destined for human consumption are identified.
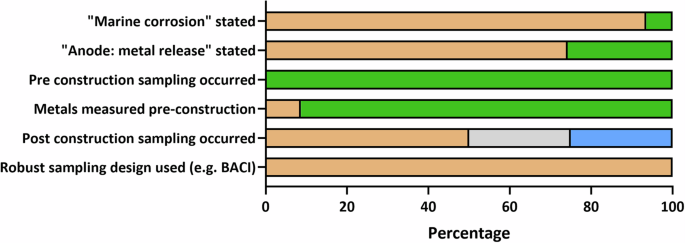
Thirty-two reports searched including those for planned OWF extensions Yes: green, No: orange. Zn: blue, Al: grey if mentioned/included in text as measured in sampling. Reports sourced from The Marine Data Exchange database40 and Google searches.
TE toxicity is heavily influenced by speciation and bioavailability. For example, Al binds to organic matter67 and TEs generally associate with the finer sediment fractions11. TEs from anodes can also be released as dissolved species or as particles influencing their bioavailability and dispersal68. Bioturbating organisms, water currents and anthropogenic disturbance all alter TE bioavailability11. Our analysis confirms that this complex ecotoxicology area is not given sufficient importance within the industry. A full appreciation that translates into appropriate sampling regimes47 will be required to assess toxicity risk for any co-located NBS or cultured species. Finally, as OWF investment has multi-decadal timescales, assessing bioavailability will become more important as TE bioavailability/toxicity can change with ocean acidification69.
Co-location of NBSs or aquaculture can connect food security, renewable energy, biodiversity and natural capital and is, therefore, generating significant traction within policymaker and industry spaces as well as garnering broader conservation support. Yet, TEs from food is a major route of exposure for humans with seafood a specific focus for legislation. A standard portion of all three species with the highest Al tissue concentrations could provide up to 28% of an adult’s TWI. This would also be the case for Zn for M. edulis and S. latissima. In contrast, M. gigas’ ability to readily accumulate Zn even in areas of low contamination could mean that just six oysters would provide up to 5.89× the TWI for an adult. Our analysis clearly shows that if the three species are cultured in areas with high concentrations of Zn and Al (which is currently unknown for OWFs that are protected by Al-GACP and/or Zn-GACP) they are highly likely to accumulate significant quantities in their tissues. Many studies have assessed the levels of TE contamination in seaweeds and bivalves, the ecotoxicological impacts (e.g. see references within Rainbow11) and human health risks (e.g. see references within Rubio et al.56; Farrell et al.21). It would be premature to compare our findings in the context of ecotoxicological effects on the organism or risks for humans via consumption, but our data highlights the potential risks, which if realised, could have substantial impacts on the commercial viability of co-located aquaculture farms. It could also limit future investment of other NBSs at OWFs. For example, creating co-located reefs of the European flat oyster (Ostrea edulis)70, a species that can accumulate even more Zn (20,000 µg g−1) than M. gigas (14,000 µg g−1)11 could impact the ecosystem services of the reef and lead to bioaccumulation in higher trophic guilds. It is, therefore, imperative that future aquaculture farms and NBS efforts co-located with existing OWFs routinely measure TE tissue concentrations.
Improving OWF sustainability credentials by co-locating aquaculture and other NBS initiatives is of great interest to operators, investors and governments. Global energy decarbonisation must be rapidly accelerated. However, to avoid potentially significant consequences for the blue economy, receiving ecosystems and human health we strongly recommend OWF operators and regulators work in partnership to:
-
1.
Install ICCP in all future developments and retrofit to monopiles in existing OWFs.
-
2.
Apply coatings to OWF structures, although inherent toxicological risks need to be assessed.
-
3.
Extend EIAs with robust scientific monitoring designs into the operational and decommissioning phases.
-
4.
Include appropriate contaminants in EIA monitoring e.g. Zn, Al, In and organics from other coatings.
-
5.
Monitor tissue concentrations in co-located culture/restored species and compare these to human health and biological toxicity thresholds.
-
6.
Include other relevant industries that require corrosion protection e.g. tidal, wave energy, floating solar.
Responses