On-site quantitative detection of fentanyl in heroin by machine learning-enabled SERS on super absorbing metasurfaces

Results
A super-absorbing metasurface chip is employed to perform trace sensing of a mixture containing fentanyl and heroin. Subsequently, the obtained sensing data were evaluated using proficient machine learning algorithms, demonstrating the capability for accurate detection and quantification of fentanyl concentrations within heroin samples. Figure 1a illustrates the design and working mechanism of the three-layered metasurface, which is intended to enhance the SERS signal. The subsequent sub-sections will provide comprehensive details on chip fabrication, the working mechanism, detection, and ML mechanism.

a Schematic depiction of trace sensing of mixture of fentanyl and heroin using the three-layered metasurface consisting of an Au nanoparticle layer, a 100 nm Al2O3 spacer layer, and a 180 nm thick Ag film. b SEM image showing a top view of the absorbing metasurface. The scale bar is 200 nm. c Absorption spectrum of the metasurface from 450 to 1100 nm under normal incidence. d Simulated electric field distribution across the nanoparticles in the red dotted squares in (b) under normal incidence at 785 nm. e Photograph of the 2-inch metasurface.
Metasurface fabrication and characterization
The development of the super-absorbing metasurface, illustrated in Fig. 1a, utilizes a meticulously designed three-layer structure that comprises a nominal 4 nm layer of Au nanoparticles (NP), a 100 nm aluminum oxide (Al2O3) spacer layer, and a foundational 180 nm thick Ag film. The precise thicknesses of these layers were optimized through a series of rigorous prior experiments and simulations, as referenced in27,28,29,30. For example, varying the thickness of Au allows for tuning of the absorption peak. As the nominal thickness increases from 0.8 to 4 nm, the highest absorption peak shifts from 450 nm to 785 nm. Additionally, the thick Ag film effectively eliminates the optical transmission and induces strong magnetic resonance in the structure, while the spacer layer localizes the electromagnetic fields near the nanostructures and reduces non-radiative losses. The integration of a dielectric spacer layer with a metasurface comprising gold nanostructures plays a pivotal role in achieving significant electromagnetic field enhancement. The mechanism is primarily driven by the localized surface plasmon resonance (LSPR) phenomenon exhibited by gold nanostructures. Upon light illumination, these nanostructures support collective oscillations of free electrons, resulting in confined electromagnetic fields at their surfaces. The dielectric spacer layer further amplifies this effect by modulating the coupling between the incident light and the plasmonic nanostructures. Specifically, the dielectric spacer adjusts the near-field interactions between adjacent nanostructures and the substrate, ensuring optimal conditions for constructive interference. This configuration creates a resonant cavity where the electromagnetic field is tightly confined and intensified. Additionally, the dielectric spacer layer minimizes non-radiative losses to the substrate, thus preserving the plasmonic resonance and maximizing field intensity. The refractive index and thickness of the dielectric layer are critical parameters in tuning the resonant wavelength and field enhancement factor. Through careful design, the metasurface-dielectric composite achieves a synergistic effect, enabling the amplification of electromagnetic fields by several orders of magnitude. This enhanced field is instrumental in applications such as surface-enhanced spectroscopy, nonlinear optical phenomena, and photodetection, where the interaction of light with matter is greatly magnified.
Notably, the Au NPs remain isolated due to the controlled density of the Au deposition, as confirmed by the top-view scanning electron microscopy (SEM) image in Fig. 1b. These SEM images, processed using ImageJ software, reveal the distribution of the nanoparticle size, highlighting a significant coverage of ~33%, as detailed in Fig. S1. The metasurface is characterized by its exceptional ability to absorb light across a wide wavelength range (580–1100 nm), achieving an impressive 95% absorption at 785 nm, as shown in Fig. 1c. In contrast, the absorption of the structure without the spacer layer is only about 3% at 785 nm. Intriguingly, the trapped light is primarily localized within the Au nanoparticle layer, creating electromagnetic hotspots that enhance the Raman signal for detection of analytes. To unveil the field localization feature, we extracted a portion of the SEM image of the top film shown in e (i.e., the red dotted square) and imported it into the simulation model. We then simulated the spatial distribution of the electric field at 785 nm. As illustrated in Fig. 1d, the NPs exhibit extensive coverage of strong hot spots, facilitating high-sensitivity and rapid sensing through signal enhancement, a crucial requirement for effective SERS-based detection27,28. Intriguingly, the uniform appearance of the metasurface across the 2-inch wafer, as depicted in Fig. 1e, underscores the consistency and reliability of this technology for the quantitative detection of trace chemicals. Additionally, the absorption spectra measured at different locations (Fig. S2) further corroborate the high uniformity of the metasurface. This high level of uniformity ensures that the Raman response is consistent across different areas of the metasurface, facilitating the accurate and dependable identification of low-concentration analyte molecules. Through this design and meticulous fabrication process, the super-absorbing metasurface represents a practical solution for sensitive detection, offering enhanced capabilities for the identification of trace substances.
Localized field enhancement
To estimate the localized field enhancement for SERS, we first utilized the super-absorbing metasurface for the detection of 1,2-bis(4-pyridyl)-ethylene (BPE) molecules under a portable Raman spectroscopy with an objective lens of 20×. Figure 2a illustrates the workflow of Raman analysis. A droplet of a 4 μL BPE solution at a concentration of 10−3 M was carefully deposited onto the metasurface chip (upper frame). The droplet was then allowed to dry naturally under ambient air (lower frame). Since BPE molecules possess a highly delocalized π-electron system with chemically active pyridyl nitrogen atoms facilitating binding to metal surfaces, they have been extensively used as stable, non-resonant probing molecules to evaluate the performance of SERS substrates and reveal the localized field enhancement effect. For comparison, we acquired a normal Raman spectrum on a silicon wafer and a SERS spectrum on the superabsorbing metasurface with a portable Raman spectrometer under identical acquisition parameters (see details in the Experimental Section). For both silicon wafer and metasurface substrates, 4 μL 10−3 M BPE solutions were dropped on the substrate and dried in ambient air. The “fingerprint” Raman peaks for BPE molecules at 1020 (ring breathing), 1197 (υ(C–C), δ(C–N)p), 1339 (δ(C–H)p, υ(C–C)), 1608 (δ(C–N)p, υ(C–C)p, δ(C–H)p), and 1637 cm−1 (υ(C = C)v) were observed on both substrates in Fig. 2b. However, the SERS signal from the super absorbing metasurface (the red curve) is much stronger than the normal Raman signal from the silicon wafer (the blue curve), demonstrating the field enhancement effect, akin to findings reported in ref. 19. Using the 20× objective lens, we estimated the average enhancement factor, EFave, within a 4.9 μm2 area to be approximately 2.19 × 10⁷. This calculation, EFave = (ISERS/NSERS)/(IRaman/NRaman), where ISERS and IRaman represent the intensities of SERS and normal Raman signals respectively, and NSERS and NRaman denote the number of probed molecules in each measurement type, is elaborated in Section S1 of the supporting information.
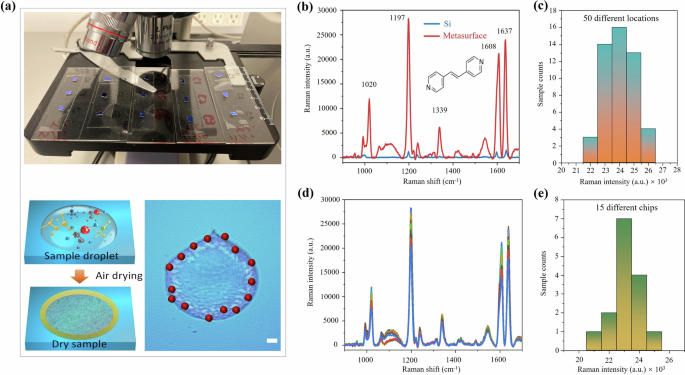
a Dried BPE on a superabsorbing metasurface. Upper panel: Photograph of 15 different chips. Lower panel: Illustration of a dried droplet on the metasurface chip, and microscopic images of sensing locations on a single chip. Scale bar: 100 μm. b Comparison between the normal Raman spectrum on a silicon wafer (blue) and the SERS spectrum on the superabsorbing metasurface (red), each treated with 4 μL 10-3 M BPE molecules. The inset displays the chemical structure of the BPE molecule. c Histograms of Raman intensities at the 1197 cm−1 Raman peak obtained from 50 different locations on a single chip. d The Raman spectra of 4 μL 10−3 M BPE on the 15 different chips. e Histograms of Raman intensities at the 1197 cm−1 Raman peak obtained from 15 different chips.
Spatial uniformity and chip-to-chip reproducibility
To achieve quantitative sensing, it is essential to ensure spatial uniformity on a single chip and chip-to-chip reproducibility. In order to demonstrate uniformity and reproducibility, Raman intensities were recorded at 50 different locations on the dried droplet. The corresponding Raman spectra are shown in Fig. S3. The resulting intensity histogram, displayed in Fig. 2c, reveals a relative standard deviation (RSD) of 4.26%, indicating excellent spatial uniformity. To ensure the reproducibility of our metasurface fabrication process, we fabricated metasurfaces on more than four sapphire wafers, with 3 to 4 chips selected from each wafer for SERS data collection (see Fig S4). The selection was randomized to avoid bias, and each chip underwent identical characterization procedures. The results exhibited consistent SERS performance across chips, indicating that minor variances in the fabrication process do not significantly affect the metasurface performance. This consistency underscores the reliability of the fabrication method for producing high-performance metasurfaces on a wafer scale. A total number of 15 chips treated with the same concentration of BPE solution were prepared, and Raman intensities were measured using a portable Raman spectrometer (Fig. 2d). Figure 2e shows the corresponding histogram of the Raman intensities with an RSD of 4.14%. The low RSD values observed both across 50 locations on a single chip and among 15 different chips affirm the metasurface’s suitability for quantitative sensing. Thus, our metasurface chip exhibits essential characteristics for on-site drug sensing, including high field enhancement suitable for detecting low-concentration drug solutions, as well as exceptional spatial uniformity and reproducibility for quantitative sensing. Subsequently, we will investigate the chip’s real-world performance in drug sensing, using fentanyl as a prominent example.
Fentanyl in the context of drug adulteration and public health
Recent public news have identified fentanyl as both a readily accessible, cost-effective alternative to heroin and a frequent adulterant in illegal drug markets1,2, exacerbating the risks to users and contributing to geopolitical tensions3,4. The widespread practice of adulterating heroin with fentanyl, often without the user’s knowledge, underscores an urgent need for the rapid detection of fentanyl within heroin mixtures31,32. The concentrations of illegal drugs may contain 0.02 to 5.1 μg fentanyl, which is more than double the potentially lethal dose of 2 μg. In some instances, fentanyl solutions prepared for illegal use can be as concentrated as 1 μg/mL, which is far more potent than medically prescribed formulations33,34. In response, our research leverages advanced metasurface technology to detect fentanyl in heroin, conducting extensive tests to demonstrate the method’s efficacy. These efforts not only enhance the scientific domain’s capabilities in rapid detection technologies but also significantly impact public safety and health, emphasizing the importance of our work in addressing drug abuse.
Sensing of fentanyl in aqueous solutions
Our investigation commenced with the analysis of SERS spectra of pure fentanyl solutions at various concentrations, employing the developed super-absorbing metasurfaces. In the experimental setup, 4 μL of fentanyl solutions were applied to the metasurface and air-dried. The captured SERS spectra, as illustrated in Fig. 3a, b, revealed a characteristic peak at 1002 cm−1, indicative of the C-C-C trigonal stretch in benzene19,35,36, which confirmed the presence of traces of fentanyl. Notably, the electromagnetic field enhancement facilitated by the metasurface enabled the detection of fentanyl at concentrations as low as 1 μg/mL, with the peak intensity increasing in proportion to the concentration range of 1–100 μg/mL. This foundational work sets the stage for addressing more complex scenarios prevalent in the context of drug abuse and public health.
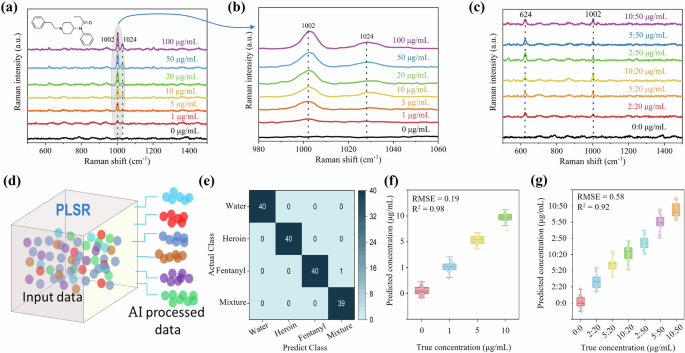
a, b SERS spectra of 4 μL fentanyl solutions with different concentrations. The inset displays the chemical structure of the fentanyl molecule. c SERS spectra of 4 μL fentanyl in heroin mixtures with different concentrations. d Machine learning-enabled SERS workflow. e Confusion matrix of actual versus predicted analytes. f PLSR results of predicting the concentration of fentanyl solutions. g PLSR results of predicting the concentration of fentanyl in heroin mixtures.
Detection of heroin and fentanyl mixtures
First, we examined the SERS spectra of pure heroin solutions with different concentrations using the super-absorbing metasurface. Similarly, we dropped 4 μL heroin solutions (1–100 μg/mL) onto the metasurface and allowed them to dry in air. The resulting SERS spectra, shown in Fig. S5, clearly exhibit a characteristic peak at 624 cm−1 (except 1 μg/mL), which is attributed to the ring modes of the heroin molecule37. This peak is a recognized diagnostic marker in SERS analysis for the detection and quantification of heroin. The peak value increases gradually with increasing heroin concentration. Given the distinct characteristic peak positions of heroin and fentanyl, it becomes feasible to differentiate fentanyl within its mixture with heroin. We thus dropped 4 μL fentanyl in heroin mixtures on the metasurface and allowed it to dry completely in the air. Figure 3c shows the spectra of fentanyl in heroin mixtures with varying fentanyl:heroin concentrations of 10:50, 5:50, 2:50, 10:20, 5:20, 2:20 μg/mL. The characteristic peaks of heroin and fentanyl, at 624 cm−1 and 1002 cm−1, respectively, were distinctly observable, suggesting the potential utility of our chip in practical scenarios for identifying fentanyl within heroin mixtures.
For accurate quantitative sensing, it is essential that the signal intensity directly correlates with the concentration of the chemical solutions analyzed. However, due to variations in the localized field enhancement across nanopatterns, many pioneering studies have reported significant inconsistencies in SERS signal intensity at different positions on the substrate9,19,20. Therefore, achieving a high degree of uniformity in SERS substrates is critical for the reliable interpretation of signal intensity as a measure of concentration — a fundamental requirement for quantitative analysis and the effective application of ML in data interpretation. The remarkable uniformity demonstrated by our three-layer super-absorbing metasurface highlights its capacity to greatly improve the precision of ML algorithms, a topic we will explore in greater detail in the subsequent section.
ML enabled sensing
Traditional approaches for quantifying fentanyl concentration from SERS spectra typically involve identifying characteristic peaks at various fentanyl concentrations to establish an intensity relationship18. Subsequently, this relationship is employed to predict the analyte with unknown concentration. Considerable efforts have been invested in achieving both quantitative and differential detection of fentanyl using SERS. The Langmuir equation is a foundational model for quantitative detection in SERS13,19,38,39, as it describes the adsorption of analytes onto surfaces. However, in addition to the substantial data requirement, its application often necessitates significant preprocessing, manual intervention, and expert knowledge to achieve accurate results. This complexity arises from the need to account for various factors influencing adsorption, such as temperature, immersion time, and surface heterogeneity. For instance, the adsorption process is dynamic and can be influenced by several factors, including temperature and immersion time, which must be carefully controlled and understood to apply the Langmuir model effectively40. Additionally, the Langmuir model assumes a homogeneous surface with energetically equivalent sites, an idealization that may not hold true in practical scenarios, further complicating its application41.
Although deep learning necessitates the collection of substantial training data, it offers several distinct advantages in this application. First, deep learning models, particularly the ML method, are capable of capturing non-linear relationships and complex spectral patterns that may not be easily addressed using conventional equations. Second, once trained, these models can perform rapid and automated analysis of SERS spectra without the need for extensive manual data treatment. This significantly reduces the operational complexity for end-users and promotes scalability for large-scale applications. Finally, the ability of deep learning models to generalize across varied experimental conditions enhances robustness and reliability, addressing the reproducibility challenges associated with SERS measurements. Thus, despite the initial data collection effort, ML methods represent a transformative approach that overcomes the limitations of traditional techniques and expands the practical utility of SERS for real-world scenarios. Notably, SERS analysis of lab-grade fentanyl analogues demonstrated the ability to differentiate fentanyl, furanylfentanyl, and carfentanil using PCA, achieving estimations of fentanyl concentrations with 70% accuracy42. Furthermore, multivariate data analysis has proven effective in resolving fentanyl in binary and ternary opioid mixtures43. However, challenges remain in achieving on-site quantitative detection of fentanyl and its mixtures using SERS: The calculation method should be user-friendly for untrained operators in non-clinical or mobile environments, enabling quick responses.
To address these limitations, we utilized ML methods (Fig. 3d, see details of partial least squares regression (PLSR) model in the Methods) for automated and intelligent prediction of fentanyl presence and its content. The confusion matrix in Fig. 3e demonstrates the ability of the PLSR model to differentiate between fentanyl, heroin and their mixture. It highlights the model’s classification performance, showing clear distinctions between the two substances in mixed samples, thus confirming the effectiveness of the PLSR approach for this purpose. We initiated the process with pure fentanyl solutions categorized into four distinct concentrations: 0, 1, 5, and 10 μg/mL. Person A collected 200 SERS spectra for each concentration, serving as the training data for the PLSR model. Persons B, C, D, and E (untrained operators) collected 10 SERS spectra for each concentration, respectively, forming the prediction dataset and the result is shown in Fig. 3f. The intentional involvement of multiple individuals in obtaining the prediction dataset aims to diligently rule out any potential influence of operator variability on the accuracy of our ML model. Additionally, this approach allows us to assess whether a well-trained PLSR model can effectively handle data from diverse sources, for example, different individuals.
The PLSR results show the model’s accuracy, reaching an impressive 99.37%, attributed to the outstanding uniformity of our chips. The root mean square error (RMSE) and determination coefficient (R2), calculated to be 0.19 and 0.98, respectively, confirm the model as a good fit for the dataset. Furthermore, an analysis of the relationship between the PLSR model’s accuracy and the number of training and prediction samples is presented in Fig. S6. The results indicate that an increase in the number of training samples leads to a higher overall accuracy in predictions. Conversely, an increase in the number of prediction samples does not significantly alter the overall accuracy. This not only strengthens the robustness of our model but also demonstrates its adaptability to real-world scenarios where data may originate from various operators or sources.
Subsequently, we employed the PLSR method to effectively quantify the concentration of fentanyl in heroin mixture. Specifically, Person A randomly collected 600 spectra for each concentration, serving as the training data. Following this, Person B and C collected 10 SERS spectra for each concentration, respectively, to be used as the prediction data. The results, depicted in the plot shown in Fig. 3g, indicate an impressive overall accuracy of 93.57% accompanied by a good fit with RMSE = 0.58 and R2 = 0.92. With the successful application of the PLSR method in both pure fentanyl solutions and fentanyl in heroin mixtures, our next endeavor involves addressing a more challenging practical scenario: i.e., detecting fentanyl in spiked saliva solutions.
Sensing in saliva
In practical scenarios for street-level substance abuse testing, collecting samples such as saliva, urine, and blood is a common practice18,37. Saliva testing holds particularly advantages due to its non-invasiveness, making it the most suitable option for street testing. However, drug detection in saliva is more complex than in water due to its composition as a complex biofluid containing various viscous elements. The collected human whole saliva, shown in Fig. 4a1, often appears turbid, which can interfere with accurate SERS measurements44. To address this challenge, pretreatment separation processes become necessary. In this study, we employed highly diluted hydrochloric acid and centrifugation to prepare clarified saliva in Fig. 4a2, effectively removing cellular debris, bacteria, and high molecular weight proteins45. As illustrated in Fig. 4a3, the centrifugation process resulted in the isolation of solid waste, while the supernatant liquid was extracted for subsequent sensing in Fig. 4a4, a5.
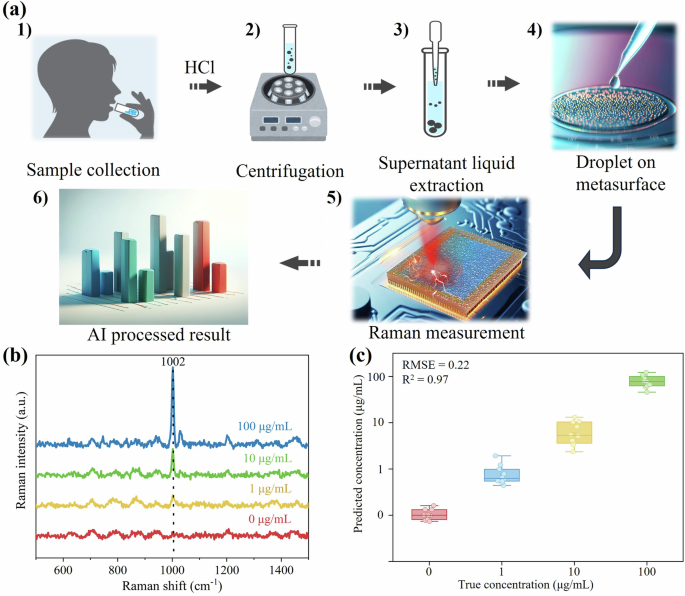
a Schematic diagram illustrating the process of sensing fentanyl saliva solutions with a superabsorbing metasurface. b SERS spectra of 4 μL fentanyl saliva solutions with various concentrations. c PLSR results presenting the predictions of fentanyl saliva solution concentrations.
To demonstrate the practical application in Fig. 4a6, we prepared 4 μL fentanyl spiked saliva solutions, and the obtained SERS spectra of these samples with concentrations of 0, 1, 10, and 100 μg/mL were shown in Fig. 4b. The characteristic peaks at 1002 cm−1, representing fentanyl, were clearly visible. We then employed the PLSR method to predict the concentrations of unknown fentanyl spiked saliva solutions. For this analysis, 200 spectra of each concentration served as the training data, and 10 spectra of each concentration were used as the prediction data. The results, displayed in Fig. 4c, demonstrated that our metasurface successfully detected 1 μg/mL of fentanyl in saliva solution, achieving an impressive overall accuracy of 97.5%. The fitting parameters, with RMSE = 0.22 and R2 = 0.97, further validated the reliability and precision of our model. Remarkably, our proposed metasurface design, incorporating Au NPs and Al2O3 layers, exhibited high stability in the environment. After being stored in an ambient laboratory environment at approximately 22 °C with humidity ranging from 20% to 60% for 18 months, the degradation rate of the Raman intensity is only approximately 10%, demonstrating its potential to fulfil practical application requirements.
Discussion
In conclusion, our research has successfully developed a cutting-edge three-layer super-absorbing metasurface, composed of a 180 nm thick Ag film, a 100 nm Al2O3 spacer layer, and a 4 nm Au layer. The unique structure of the metasurface, featuring isolated Au nanoparticles, exhibits exceptional light absorption (>90%) across a broad wavelength range of 580–1100 nm, resulting in a remarkable absorption efficiency of 95% at an excitation wavelength of 785 nm. This outstanding characteristic leads to significant field enhancement, creating hotspots between randomly distributed Au nanoparticles. Notably, the consequent enhancement factor is greater than 2.19 × 10⁷. The practicality of our approach is further improved by the use of a portable Raman spectrometer for SERS signal measurements. The metasurface demonstrates excellent uniformity and reproducibility across different chips, ensuring reliable and quantitative responses. In particular, the overall filling ratio is about 33% with particle size ranging from 3100 to 3700 nm2. Our fabricated metasurface successfully captured SERS spectra for fentanyl solutions, fentanyl in heroin mixtures, and fentanyl-spiked saliva solutions, displaying the ability to detect varying concentrations of fentanyl with precision. The practical applicability of SERS systems hinges not only on achieving low detection limits but also on their adaptability for rapid, on-site detection in real-world scenarios. While solution-based SERS platforms (Table S1) achieve remarkable detection limits (<0.1 µg/mL), they often require liquid-phase sample preparation and bulky laboratory equipment, making them unsuitable for field deployment and point-of-care diagnostics. Moreover, these systems face significant challenges in terms of nanoparticle stability and aggregation, which can compromise their performance over time. In contrast, our on-chip metasurface platform circumvents these limitations by enabling direct analysis of solid-state samples without the need for solvents or extensive sample preparation. This approach minimizes risks of contamination, simplifies the workflow, and allows for compact and portable instrumentation. As a proof of concept, we successfully analyzed saliva samples placed directly on our metasurface chip without requiring any intermediate solvent, highlighting the system’s ease of use. Importantly, our system achieved the lowest detection limit of 1 µg/mL, which is not only superior but also one of the best reported for solid-state SERS fentanyl detections to date.
Introducing the PLSR method enabled accurate prediction of unknown solution concentrations, achieving an impressive accuracy rate of above 93% when sufficient training data were employed. This implementation eliminates the need for redate treatment or specialized personnel, streamlining the process, and making it easily accessible. The potential of our proposed method for on-site quantitative detection of fentanyl in heroin is considerable, and it addresses the challenges typically associated with portable fentanyl detection. With its rapid and accurate identification capabilities, our method holds significant promise in combatting fentanyl-related deaths and contributing to the prevention of illicit drug-related risks. By providing an efficient and reliable means of detecting fentanyl in illicit drug supplies, our research underscores its importance in safeguarding public health and safety.
Methods
Fabrication of metasurface
The fabrication process initiates with the careful preparation of 2-inch sapphire wafers, which undergo extensive cleaning through sequential sonication in acetone, methanol, and deionized water, followed by drying with nitrogen gas. The construction of the metasurface begins with the deposition of the 180 nm Ag film using an e-beam evaporator (Kurt J. Lesker AXXIS) at a deposition rate of 0.8 Å s−1 under vacuum pressure of 5 × 10⁻⁷ Torr. Follow by the 100 nm Al2O3 film with atomic layer deposition (Cambridge Nanotech Savannah S100) under a pressure of 10−2 Torr at 250 °C., and concludes with the Au layer by e-beam evaporator at a deposition rate of 0.5 Å s−1. Each step is conducted under specific conditions to ensure the formation of isolated Au nanoparticles on the Al2O3 layer, avoiding the continuity typical of a percolation threshold. This results in a unique nanocavity configuration, with the Ag film providing reflective properties, the Al2O3 layer serving as a spacer, and the Au nanoparticles facilitating absorption.
Characterization
The morphology of the metasurface was analyzed using SEM with a Carl Zeiss AURIGA CrossBeam. The absorption spectra were measured using microscopic Fourier transform infrared spectroscopy (Bruker, VETEX 70 + Hyperion 1000) with a 20× objective lens. SERS signals were measured using a portable Raman spectrometer (B&W Tek Inc, BWS465-785S, 16.9 cm × 33.3 cm × 24.2 cm and 5.0 kg), equipped with laser excitation at 785 nm. All measurements were taken under an excitation laser power of 50 mW and an integration time of 10 s.
Preparation of fentanyl and heroin solutions
To prepare the fentanyl solution, 100 μL of 1.0 mg/mL commercially obtained fentanyl solution (Sigma Aldrich) was placed in a microcentrifuge tube and allowed to complete evaporation of the organic solvent. Next, 1 mL of deionized water was added to create a 100 μg/mL fentanyl solution, which was thoroughly mixed using a Mini Vortex Mixer (VWR Scientific). The resulting fentanyl solution was further diluted to create lower concentration solutions using deionized water. The heroin solution and fentanyl in heroin mixture solution was also prepared in this method.
To prepare the fentanyl saliva solution, the saliva underwent a pretreatment process involving acidification and centrifugation. Specifically, 10 mL of 50 mM hydrochloric acid was added to 10 mL of saliva and thoroughly mixed using a mini vortex mixer. After allowing the mixture to stand for 5 min, it was centrifuged at 14,000 rpm for 10 min. The resulting supernatant liquid was carefully transferred into a clean tube for future use. Next, the original drug solution was added to a microcentrifuge tube for complete evaporation of the organic solvent. Once the solvent had evaporated, the pretreated saliva solution was added and mixed thoroughly.
Machine learning method
The spectra were analyzed using the PLSR method in Matlab R2021b (The MathWorks Inc.). PLSR is a multivariate technique that establishes a linear relationship between a set of dependent variables and a set of predictor variables. It combines feature processing techniques such as principal component analysis and multiple regression to extract sample information, calculate maximum correlation, and establish a model between independent and dependent variables. The quality of the quantitation analysis was evaluated using RMSE and R2 46.


Responses