Oncogenic and microenvironmental signals drive cell type specific apoptosis resistance in juvenile myelomonocytic leukemia
Introduction
Juvenile myelomonocytic leukemia (JMML) is a rare and highly aggressive myeloid neoplasia of early childhood, characterized by constitutive active RAS signaling. Mutations in KRAS, NRAS, RRAS, or RRAS2 or in their regulators PTPN11 (encoding for SHP2), CBL, or NF1 [1,2,3,4,5,6,7] in JMML cells, enhance proliferation and myelomonocytic differentiation upon cytokine stimulation (i.e., GM-CSF) [8]. Monocytes and granulocytes infiltrate bone marrow (BM), spleen, liver and other organs, causing fever, thrombocytopenia, hepatosplenomegaly, respiratory distress, and diarrhea [1, 9,10,11,12]. Most patients require allogeneic stem cell transplantation (HSCT).
Resistance to apoptosis is a key cancer hallmark contributing to tumor emergence and persistence [13,14,15]. The intrinsic apoptosis pathway is controlled by BCL-2 family proteins [16,17,18,19,20,21], divided into anti-apoptotic (BCL-2, BCL-XL, MCL-1), pro-apoptotic BH3-only (BIM, PUMA, BID, NOXA, BMF, BAD, BIK, HRK), and pro-apoptotic effector proteins (BAX, BAK, BOK) [22,23,24,25,26,27,28,29]. Once activated, effector proteins multimerize and lead to mitochondrial outer membrane permeabilization, cytochrome c release, and cell death [28, 30]. Pro- and anti-apoptotic proteins interact to regulate cell fate. Every cell requires one or more BCL-2 protein/s for survival. In cancer cells, this “BCL-2 protein addiction” is modulated by the driver mutations and microenvironmental signals [31,32,33]. The fact that cancer cells, at the same time, accumulate pro-apoptotic proteins (known as “mitochondrial priming”) is used during cancer therapy since cytotoxic drugs induce apoptosis more readily in cancer than in healthy cells.
RAS activation influences cell death decisions by regulating BCL-2 proteins, by inhibiting pro-apoptotic and activating anti-apoptotic proteins, as observed mostly in cell lines [34, 35]. Here, we investigated BCL-2-regulated apoptosis in a genetically engineered mouse model for JMML. Using mice expressing the PTPN11/SHP2D61Y mutation in the hematopoietic system [1, 36], we found survival benefits in leukemic monocytes and neutrophils, mediated by higher BCL-XL and/or MCL-1 expression. Adjacent non-leukemic cells acquired similar but transient apoptosis resistance. Surprisingly, SHP2D61Y expressing hematopoietic stem and progenitor cells (HSPCs) showed no apoptosis resistance. Inhibition of BCL-2 proteins by selective BH3-mimetics revealed differential “addiction” in monocytes and neutrophils. In vivo treatment with the BCL-XL inhibitor A1155463 reduced myeloproliferation but did not cure the mice. In conclusion, apoptosis resistance in JMML is restricted to few cell types and influenced by microenvironmental signals.
Methods
Genetically engineered JMML mouse model
Animal procedures were carried out in accordance with the regulatory requirements of German law. MxCre and Ptpn11D61Y/+ were provided by Benjamin Neel and bred to obtain MxCre;Ptpn11D61Y/+. All mice received three doses of poly I: C (300 μg/dose/mouse) every other day. Leukemic mice were euthanized and analyzed at different disease stages (Supplementary Fig. 6). All mice were euthanized when showing distress.
Mice genotyping
The DNA from ear punches was PCR assayed for Neo-Stop cassette and MxCre using the primers shown in Supplementary Table 4 (Supplementary Fig. 6).
In vivo treatment
The BCL-XL inhibitor A1155463 (Selleck Chemicals) was dissolved in 2% DMSO, 30% PEG300, 2%Tween80 and administered intraperitoneally (ip), daily for 28 days (5 mg/kg/day). Mice were euthanized one day after treatment, and hematopoietic cell compartments were analyzed.
Transplantation JMML mouse model
CD45.1+ (WT) mice were sub-lethally irradiated (3 Gy). Leukemic splenocytes from terminally ill S3-MxCre;Ptpn11D61Y/+ mice were isolated and transplanted intravenously (1 × 10⁶ CD45.2 in PBS) into the irradiated mice. Recipients received riketron in drinking water for four weeks after irradiation. Engraftment and myeloproliferation were assessed in peripheral blood via flow cytometry.
Flow cytometry
For surface staining, single-cell suspensions from BM, spleen, blood, and liver and lung MNCs were stained with antibodies as in Supplementary Table 3, and the gating strategy was performed as shown on Supplementary Fig. 7. For intracellular staining, cells were stained for surface markers, then fixed and permeabilized using a buffer set (eBioscience concentrate and diluent), followed by intracellular protein staining per the manufacturer’s instructions. For phospho-flow, cells were stained for surface markers, incubated with 3.7% formaldehyde, then 90% cold methanol, and stained with pMAPK and pmTOR phosphoantibodies. For apoptosis staining, after surface staining, cells were resuspended in binding buffer (BB) containing Annexin V (AV) and 7AAD, incubated for 15 min, and measured on a BD Fortessa. Freshly isolated CD11b+ or LSK cells were cultured for the specified time points before apoptosis staining.
Cell isolation and culture
LSK cells
Lineage-negative (Lin–) cells were isolated from BM using the lineage depletion Kit (Miltenyi Biotec). Followed by sorting of Sca+cKit+ cells and cultured in IMDM medium (Gibco), with 10% FCS (Thermo Fisher), 1% penicillin/streptomycin (ThermoFisher), stem cell factor (SCF), thrombopoietin (TPO) and Fms-related receptor tyrosine kinase 3 ligand (FLT3L) at 100 ng/ml each (ImmunoTools).
CD11b+ cells
CD11b+ myeloid cells were isolated using a MACS kit (Miltenyi Biotec) with two column separation rounds and cultured in IMDM medium supplemented with 30% FCS, 1% P/S, 25 mM HEPES (Sigma-Aldrich), 0,1 mM MEM non-essential amino acids (Gibco) and 0,1 mM sodium pyruvate (Gibco), 2-B-mercaptoethanol (Gibco). Where indicated, CD11b+ cells were stained for CD45.1 and CD45.2 and sorted. CD11b+ CD45.1 and CD45.2 were cultured individually or in co-cultures. Neutralizing antibodies for anti-CD74 (R&D systems), anti-ITGAM (Invitrogen) or TNFα (Immunotools) were added as indicated.
Apoptosis induction
Apoptosis of LSK and CD11b+ cells was assessed after treatment with BH3-mimetics: ABT737 (Selleck Chemicals), ABT199 (Selleck Chemicals), A115546, S63845 (Synthesis) and Runx inhibitor (Tocris). After BH3 mimetic treatment, cells were stained for myeloid markers, stained with AV and 7AAD, and measured on a flow cytometer. Specific apoptosis was calculated as: 100 × (% live cells without treatment − % live cells with treatment)/% live cells without treatment.
Cytokine bead array
Cytokines found in BM and spleen secretomes were quantified using a cytokine bead array (CBA) kit, according to the manufacturer’s instructions (BD Bioscience).
RT-MLPA
mRNA was isolated from BM-LSK cells and spleen CD11b+ of MxCre and S3 MxCre;Ptpn11D61Y/+ mice using Fast Spin columns (Zymo Research) and reverse transcribed into cDNA for RT-MLPA (MRC-Holland). cDNA was ligated to two oligonucleotides, and the amplicons were separated by capillary electrophoresis (ABI-3130xl Genetic Analyzer). Data was analyzed using Sequence Pilot software (JSI Medical Systems) and normalized taking the sum of all peaks as 100%.
Western blot
CD11b+ myeloid cells were lysed with 1x Laemmeli buffer and sonicated. Lysates were resolved in 12% SDS-PAGE and transferred to PVDF membrane, which were incubated overnight with primary antibodies diluted in 5% BSA in TBST: Bim (C.Signaling Technology), Bid (BD), Noxa (Enzo), Bmf (NBPI), Bak and Bax (C.Signaling Technology). Mouse or rabbit HRP-conjugated secondary antibodies were incubated with the respective membranes. β-actin (Sigma-Aldrich) was used as a loading control. Membranes were developed using Fusion equipment. For protein determination, equal volumes extracted from CD11b+ cells were run per Western blot, and β-actin band intensities were quantified using ImageJ. Supplementary Table 2 lists the antibodies.
RNA isolation and sequencing
RNA isolation
RNA was isolated from CD11b+ cells (BM and spleen of S3 MxCre;Ptpn11D61Y/+ and MxCre mice; 3 mice/genotype) with the RNeasy Micro kit (Qiagen) following the kit instructions. RNA sequencing was performed at the Genomic and Proteomic Core Facility of the German Cancer Research Center.
RNA Sequencing and data analysis
RNA sequencing libraries were prepared using the TruSeq Stranded mRNA Library Prep Kit (Illumina) according to the manufacturer’s protocol. The 100 bp paired-end reads were trimmed using TrimGalore (v0.6.5) and mapped to the mouse reference genome (GRCm38) using STAR (v2.5.3a). Read counts were normalized, and differential expression was calculated using the R packages DESeq2 (v1.22.2) and limma (v3.38.3). Gene set enrichment analysis was performed using GAGE tools (v2.44.0). The next-generation sequencing data is deposited at NCBI GEO (GSE277667).
Whole exome sequencing (WES) and data analysis
Genomic DNA was extracted from splenocytes of control MxCre and MxCre;Ptpn11D61Y/+ S3 mice by using the DNeasy Blood &Tissue Kit (Qiagen). Skin DNA was used as a germline control. WES libraries were prepared using the Agilent SureSelectXT Mouse All Exon kit. Adapter and quality trimming were performed using Trimmomatic (v0.39), and the trimmed reads were mapped to the mouse reference genome (GRCm38) using the BWA-MEM aligner. The aligned reads were processed using Samtools and the GATK toolkit (v3.8.1). Variants were identified using Samtools mpileup and VarScan (v2.4.3) and annotated with Annovar and SnpEff (v4.3).
BM and spleen secretome
Two femurs per mouse were flushed with 2 ml PBS to collect secretome content. Spleens were smashed and resuspended in 2 ml PBS. The supernatants were used for TNFα cytokine assay or further processed for mass spectrometry.
Mass spectrometry-based proteomics
Tryptic peptides from secretome lysate were labeled with TMT10plex reagent, pooled and fractioned as described previously [74] [75]. Nanoflow LC-MS/MS was performed on a Dionex 3000 (Thermo) coupled online to an Orbitrap Fusion LUMOS (Thermo). Samples were measured in DDA mode with a MS3 method and 50 min linear gradient. Database search against the mouse reference proteome (UP000000589) and common contaminants was performed with MaxQuant (v. 1.6.3.3) with standard settings for reporter ion MS3 [78]. The spleen and bone marrow TMT set corrected TMT reporter intensities were total sum and row-wise normalized for statistical analysis. The mass spectrometry proteomics data have been deposited to the ProteomeXchange Consortium via the PRIDE (PMID 34723319) partner repository with the dataset identifier PXD055845.
Histology
BM/sternum, spleen, liver, and lung sections from indicated mice were fixed in 4% paraformaldehyde. The samples were decalcified in EDTA for 5–10 days and embedded in paraffin. The sections were stained with haematoxylin and eosin (H&E). Images were acquired using a Zeiss microscope.
Statistics
The unpaired/non-parametric Mann-Whitney test was used to analyze all experiments. P values: *P < 0.05, **P < 0.01, ***P < 0.001, ****P < 0.0001. Analysis was performed on GraphPad Prism.
Results
Monocytes and granulocytes isolated from MxCre;Ptpn11
D61Y/+ mice show increased apoptosis resistance
Mice expressing SHP2D61Y in the hematopoietic system and known to develop JMML-like myeloproliferation were generated by treating MxCre;Ptpn11D61Y/+ mice with PolyI:C [1]. We defined terminally ill mice as “stage 3” (S3) and earlier disease stages as “stage 1 and 2” (S1, S2), respectively (Fig. 1A). MxCre;Ptpn11D61Y/+ mice developed massive splenomegaly and succumbed 130–400 days post polyI:C injection (median 274 days, Fig. 1B, C). Flow cytometry revealed increasing infiltration of monocytic, granulocytic, and erythroid progenitors in the spleen, lung, and liver (Supplementary Fig. 1A–F). The number of HSPCs defined as lineage marker negative, Sca1 and cKit positive (LSK) cells, remained stable in the BM but increased in the S2–3 spleens (Supplementary Fig. 1G). Activated SHP2 signaling was confirmed by increased MEK and mTOR phosphorylation in SHP2D61Y expressing myeloid cells (Supplementary Fig. 1H). Histopathology confirmed myelomonocytic organ infiltration (Supplementary Fig. 2). Flow cytometry immediately after organ isolation revealed higher viability of monocytes and neutrophils from spleen, especially in S2-3 mice (Fig. 1D). BM myeloid cells were generally more viable, with no significant differences between the genotypes (Supplementary Fig. 3A). SHP2D61Y expressing LSK cells, lymphocytes and erythroid progenitors from the spleen (Fig. 1E) and BM (Supplementary Fig. 3B) showed no survival benefit.

A Schematic representation of the experimental procedure. All experimental mice (controls -WT, MxCre, Ptpn11D61Y/+ and JMML mice – MxCre;Ptpn11D61Y/+) were injected with 300 μg poly I:C/mouse (in 3 doses every other day) to activate the oncogenic mutation. The experimental mice were analyzed at different stages of the disease: preleukemic – defined as stage 1 – S1 (5 weeks after polyI:C injection); leukemic – defined as stage 2 – S2 (5 months after polyI:C injection) and full-blown myeloproliferative disease – defined as stage 3 – S3 (7+ months after poly I:C injection – terminally ill mice). B Representative spleens are shown for: control mice (MxCre, Ptpn11D61Y/+) and JMML mice MxCre;Ptpn11D61Y/+ (S1, S2, S3). C Survival curves are shown for control mice (WT) and JMML MxCre;Ptpn11D61Y/+ mice. The percentage of live cells (AV− 7AAD−) was determined in the following splenic hematopoietic cell types: D CD11b+ myeloid cells; CD11b+Ly6Cmedium – circulatory monocytes; CD11b+Ly6Chigh – inflammatory monocytes and CD11b+Ly6G+ – neutrophils; E LSK – stem and progenitor hematopoietic cells, B220+ – B cells, TCR-β+ – T cells and Ter119+ – erythrocytes obtained from the spleen. All the above cell populations were determined ex vivo and assayed by flow cytometry for the indicated genotypes. The gating strategy was performed as described in Supplementary Fig. 7. All data are presented as mean ± SEM (n = 3–10; ≥5 independent experiments).
To confirm their reduced susceptibility to apoptosis, myeloid cells from S2 and S3 spleens were cultured for 24 and 48 h without pro-survival cytokines. Increased survival of S2-3 bulk myeloid cells (CD11b+), monocytes and granulocytes were observed compared to controls (Fig. 2A–C), with stronger effects in S3 cells. SHP2 mutant LSK cells showed no viability differences when cultured with or without cytokines compared to controls (Fig. 2D). Clonal evolution as the reason for the increased apoptosis resistance in late disease stages was excluded by whole exome sequencing (WES). In splenocytes of three S3 mice, no JMML-associated mutations (i.e., secondary RAS pathway lesions, mutations in JAK2, JAK3, or SETBP1) [37] were identified. Mutation numbers and variant allele frequencies (VAF) were similar in leukemic and control mice (Supplementary Fig. 3C, D, Supplementary Table 1).

The primary murine LSK and CD11b+ cells were cultured for 24 h and 48 h. The percentage of living cells (AV–7AAD–) was determined by flow cytometry for the following cell populations: A myeloid cells – CD11b+ cells; B monocytes – CD11b+Ly6C+; C neutrophils – CD11b+Ly6G+ after for 24 h (left panel) and 48 h (right panel) of culture. D LSK-stem and progenitor cells were cultured for 48 h in the presence and absence of cytokines (FLT3L, TPO and SCF), and living cells were determined as AV–7AAD– by flow cytometry. The gating strategy was performed as described in Supplementary Fig. 7. All data are presented as mean ±SEM (n = 1–10; ≥3 independent experiments).
BCL-XL and MCL1 are upregulated in SHP2D61Y expressing myeloid cells
To understand SHP2D61Y mediated apoptosis resistance at the molecular level, we analyzed levels of pro- and anti-apoptotic BCL-2 proteins. RT-MLPA revealed an approximately twofold increase of Bcl-xl and Mcl-1 mRNA in spleen-isolated CD11b+ cells. While proapoptotic antagonists Bim, Bad and Bok were mildly but not significantly upregulated (Fig. 3A). Increased mRNA levels of Bcl-2, Bcl-xl, Mcl-1 and A1, but also Bid and Bax were observed in the non-resistant LSK cells (Supplementary Fig. 3E). BCL-XL and MCL-1 protein levels were slightly but not significantly higher in CD11b+ and LSK cells from S1-S3 mice, when compared to controls (Fig. 3B, C). In cultured SHP2D61Y monocytes, BCL-XL and MCL-1 levels were higher than in controls. In neutrophils, only MCL-1 was upregulated (Fig. 3D). Western blot analysis revealed upregulation of several pro-apoptotic proteins in S1 myeloid cells but downregulation during disease progression (Fig. 3E, F).
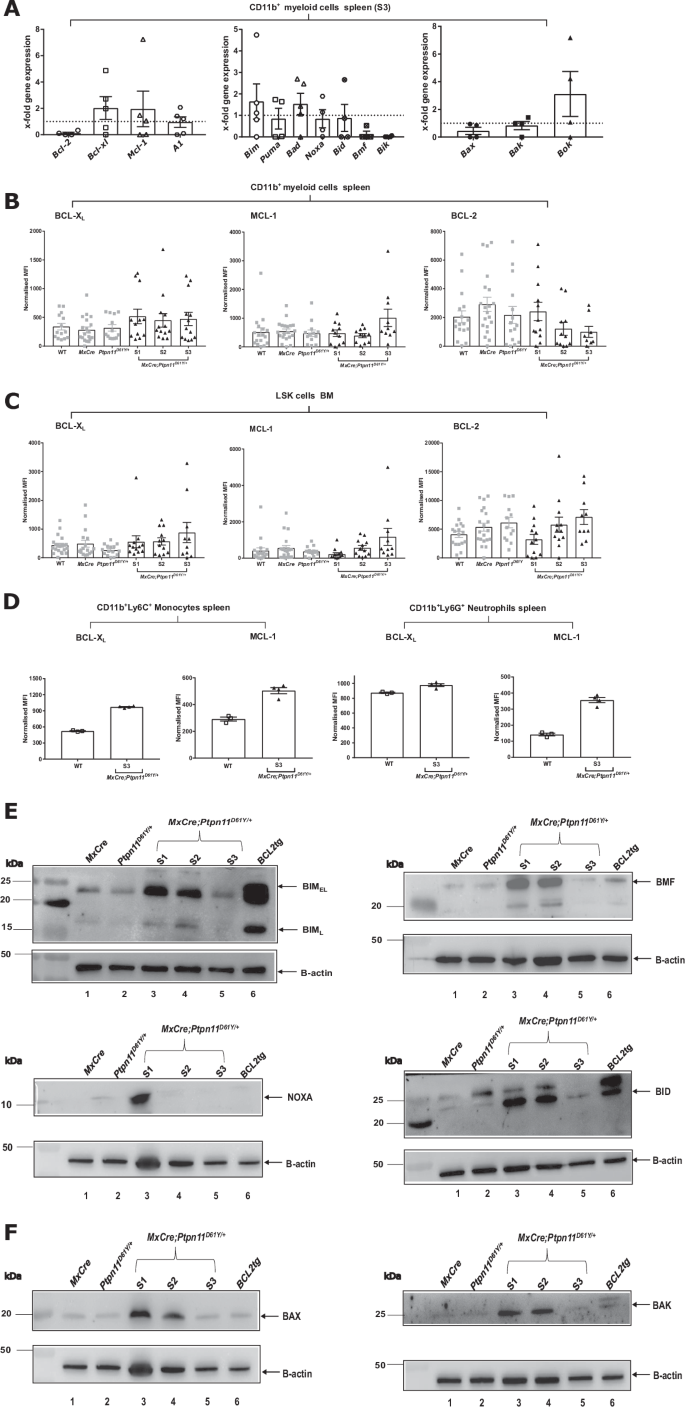
A The mRNA levels of BCL-2 family members (anti-apoptotic, pro-apoptotic and pore-forming) were determined by RT-MLPA in primary CD11b+ myeloid murine cells. Myeloid cells were isolated from S3 MxCre;Ptpn11D61Y/+ and control MxCre mice. Protein levels of pro-survival BCL-2 family proteins (BCL-XL, MCL-1 and BCL-2) were determined ex vivo by intracellular flow cytometry for the following cell types: B CD11b+ myeloid cells and C LSK–stem and progenitor cells. D The freshly isolated murine CD11b+ cells from disease stage 3 were cultured for 24 h and the pro-survival BCL-2 family proteins (BCL-XL, MCL-1) were determined in CD11b+Ly6C+ – monocytes and CD11b+Ly6G+ – neutrophils. Representative western blots showing the expression levels of pro-apoptotic BCL-2 proteins for the following BCL-2 family members: E BIMEL and BIML, BMF, NOXA, BID and pore-former proteins F BAX and BAK. BCL2 tg cells are the positive control for western blot. All data are presented as Mean ±SEM (n = 1–10; ≥3 independent experiments). The western blot analysis were performed on freshly isolated primary murine CD11b+ cells for an n = 2 with 5–7 mice/lysates. Antibodies used for WB are listed in Supplementary Table 2.
Apoptosis resistance is driven by the oncogenic signaling
RNAseq with gene set enrichment analysis (GSEA) revealed strong enrichment of cell cycle-related gene sets and downregulation of the apoptosis gene set in S3 leukemic spleen myeloid cells when compared to MxCre-tg controls (Fig. 4A). Unexpectedly, the levels of PTPN11 mRNA were higher in BM LSK than in splenic myeloid cells, this not correlating with the increased apoptosis resistance (Fig. 4B). Upregulated KRAS signaling (HALLMARK_KRAS_SIGNALING_UP) in myeloid cells versus immature LSK cells suggests that RAS/MAPK activity downstream of SHP2 explains their differing apoptosis susceptibility (Fig. 4C, Supplementary Fig. 4). To confirm that SHP2 and the RAS/MAPK signaling directly regulate BCL-XL and MCL-1 expression, we inhibited MEK and, additionally the transcription factor RUNX1, which has been shown to drive myeloproliferation downstream of SHP2 [38]. BCL-XL expression was reduced in bulk CD11b+ cells and specifically in monocytes, when both MEK and RUNX1 were inhibited (Fig. 4D). In contrast, MCL-1 expression was most profoundly reduced by MEK inhibition alone (Fig. 4E). Only combined MEK and RUNX1 inhibition induced apoptosis in both cell types (Fig. 4F).

A The bubble plot representing the top up-(left) and downregulated (top) hallmark gene sets in the comparison of S3 CD11b+ leukemic cells with the control (Mxcre or WT) cells. The gene ratio is represented on the y-axis, the bubble size corresponds to the gene count and the color map represents the adjusted p value. B The Ptpn11 mRNA expression level in the bone marrow LSK and spleen CD11b+ cells in the S3 leukemic (MxCre;Ptpn11D61Y/+) and control (MxCre or WT) cells. The y-axis represents the logCPM (CPM- counts per million reads). C The gene set enrichment analysis of hallmark KRAS signaling up-regulated gene sets in the comparison of S3 spleen CD11b+ leukemic cells and LSK leukemic cells. The genes are ranked based on the fold change and the y-axis represents the running enrichment score (top) and the ranked list metric (bottom). The normalized enrichment score (NES), p value and adjusted p-value are shown in the table. Myeloid CD11b+ cells isolated from leukemic S2 mice or MxCre controls were treated with trametinib and/or Runx inhibitor for 24 h and then analyzed for expression of pro-survival proteins: D BCL-XL and E MCL-1 and F % of specific apoptosis for myeloid cells (CD11b+ cells), monocytes (CD11b+Ly6C+) and neutrophils (CD11b+Ly6G+). All data are presented as Mean ±SEM (n = 1–10; ≥3 independent experiments).
Microenvironmental signals contribute to apoptosis resistance in vivo
The generally higher viability of myeloid cells in BM than in the spleen prompted us to study the microenvironmental contribution to cell death decisions in leukemia. First, we transplanted leukemic mice into CD45.1 + WT recipients to generate chimeras (Fig. 5A, left). Suppl Fig. 5A shows the proportion of leukemic cells. Again, BM cells were more viable than spleen cells (Supplementary Fig. 5B). In chimeric spleens, increased survival rates were noted for both leukemic and recipient WT cells (Fig. 5B). Next, we performed co-culture experiments with WT and leukemic cells (Fig. 5A, right). We observed survival advantages (Fig. 5C) and elevated BCL-XL and MCL-1 levels in leukemic myeloid cells, both in the absence and presence of WT cells (Fig. 5D, E). Interestingly, also WT cells and, particularly, neutrophils showed elevated BCL-XL levels comparable to the ones of leukemic cells (Fig. 5D). Yet, they were not apoptosis-resistant (Fig. 5C), indicating that SHP2D61Y expressing myeloid cells influence the survival of adjacent WT cells only in vivo. To identify pro-survival molecules in the leukemic microenvironment, we performed secretome mass spectrometry. Spleen supernatants contained more proteins than the BM supernatant (Fig. 5F). We identified proteins with known anti-apoptotic function at high abundance in leukemic spleens (i.e.ITGAM/CD11b, TNFα and CD74) and confirmed these findings by flow cytometry and cytokine assay (Fig. 5G, Supplementary Fig. 5C–F). Blocking either ITGAM or CD74 or adding TNFα in vitro did not induce apoptosis in WT or S3 myeloid cells (Supplementary Fig. 5G–I), indicating that other not yet identified microenvironmental signals affect cell survival within the leukemic spleen.

A Schematic representation of the experimental procedure. Sub-lethally irradiated (3 Gy) WT (CD45.1) mice were transplanted with splenocytes (1 × 10⁶ cells) from S3 – terminally ill MxCre;Ptpn11D61Y/+ mice (CD45.2) (left panel). Representative spleens are shown for the control and the engrafted mice (middle panel). Schematic representation of the 24 h single cultures and co-cultures of leukemic – CD45.2 and WT – CD45.1 myeloid CD11b+ cells (right panel). The single cultures consisted of control CD45.1 – designated as c-CD45.1; single culture CD45.1- designated as s-CD45.1; single culture CD45.2 – designated as s-CD45.2. The co-culture conditions consisted of co-culture of CD45.1 and CD45.2 – designated as co-CD45.1 or co-CD45.2. The cells used for the condition: single cultures CD45.1 and CD45.2 were sorted from successfully engrafted recipient mice, while the control CD45.1 was obtained from not transplanted mice. Leukemic CD45.2 and WT CD45.1 myeloid cells were determined via flow cytometry. B Percentages of live cells (7AAD–) within the spleen residing CD45.1 and CD45.2 determined in engrafted and control mice for CD11b+ – myeloid cells, CD11b+Ly6Cmedium – circulatory monocytes, CD11b+Ly6Chigh – inflammatory monocytes, CD11b+Ly6G+ – neutrophils, was assessed ex vivo. C The CD11b+ cells were cultured for 24 h in single cultures or co-cultures. The percentage of living cells (AV−7AAD−) was determined by flow cytometry for: CD11b+ – myeloid cells; CD11b+Ly6C+ – monocytes and CD11b+Ly6G+ – neutrophils from BM and spleen. In vitro expression of pro-survival proteins: D BCL-XL and E MCL-1 was determined in the myeloid compartment isolated from spleen, CD11b+ – myeloid cells, CD11b+Ly6C+ – monocytes and CD11b+Ly6G+ – neutrophils via intracellular staining after 24 h culture. F Significantly differently expressed proteins identified by mass spectrometry were selected and plotted based on log2 fold change obtained for BM or spleen supernatant from S3 leukemic vs MxCre. Significant changes in BM (turquoise), spleen (orange), or both (gray). Significant proteins only identified in either BM or spleen are marked by dashed boxes. The total number of identified proteins for BM and spleen are depicted as box insert. The gating strategy was performed as described in Supplementary Fig. 7. All data are presented as Mean ± SEM (n = 7–9; ≥3 independent experiments).
BCL-XL inhibition has potent anti-leukemic activity in vivo
To identify the anti-apoptotic BCL-2 protein(s) required for leukemic cell survival, we used selective BH3-mimetics in vitro [39,40,41,42,43,44]. Splenic myeloid cells were most sensitive to BCL-XL inhibition (Fig. 6A). Leukemic monocytes were sensitive to both combined and selective inhibition of BCL-XL and BCL-2 (Fig. 6B), while neutrophils were most sensitive to MCL-1 inhibition (Fig. 6C). Greatest sensitivity to BH-3 mimetics was found in the terminal S3 stage. BM-derived LSK cells did not show increased sensitivity to BH3-mimetics when cultured in the presence of cytokines (Fig. 6D). Under cytokine deprivation, they became slightly sensitive to BCL-XL and MCL-1 inhibition (Fig. 6E). Based on the promising in vitro effects, we used the BCL-XL inhibitor A1155463 in vivo (Fig. 7A). Treatment for 28 days resulted in significant reduction of the spleen size in S2 mice (Fig. 7B). Analysis of all hematopoietic cells revealed significant decrease in monocytes and neutrophils but also HSPCs and erythroid progenitors in the spleen of treated mice (Fig. 7C–G), along with reduced infiltration in the blood and lungs (Fig. 7E). Interestingly, no effects were observed in BM or liver (Fig. 7D, E).
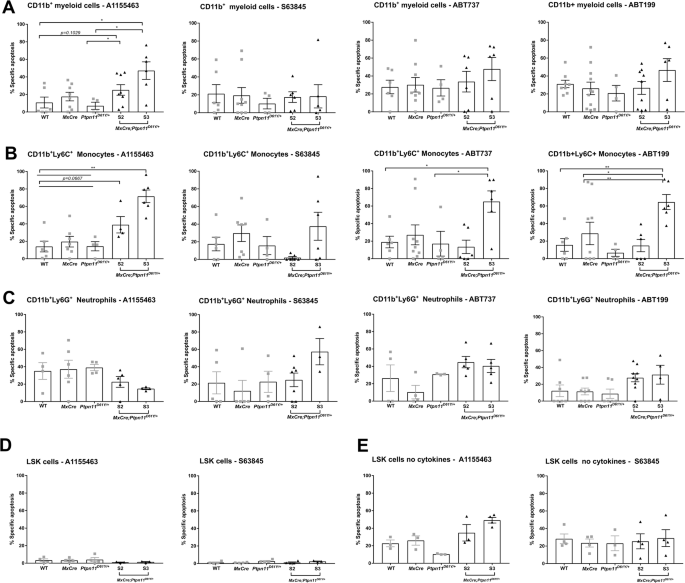
CD11b+ myeloid cells were treated with BH-3 mimetics, A1155463 (10 μM), S63845 (1 μM), ABT737 (3 μM), ABT199 (5 μM) for 48 h. Then, cells were stained for the surface markers CD11b+, Ly6G+, and Ly6C+ followed by staining for AV and 7AAD, and the viable cells were determined as AV–7AAD– on flow cytometry. The percentage of specific apoptosis induced by BH3 mimetics was calculated for the specific cell types: A CD11b+ – myeloid cells, B CD11b+Ly6C+ – monocytes and C CD11b+Ly6G+ – neutrophils. Freshly isolated LSK stem and progenitor cells (cultured with or without cytokines) were treated with the BCL-XL (A1155463) or MCL-1 (S63845) inhibitor for 48 h. The percentage of specific apoptosis was calculated for LSK cells: D in the presence (of TPO, FLT3, and SCF) and E in the absence of cytokines. The gating strategy was performed as described in Supplementary Fig. 7. All data are presented as Mean ±SEM (n = 1–3; ≥3 independent experiments).

A Schematic representation of experimental procedure. Mice were treated with the BCL-XL inhibitor A1155463 (5 mg/kg/day) for 28 days (daily); on day 29 the mice were sacrificed and analyzed, and the leukemic burden was assessed. B Representative spleens (figure and weight) after in vivo treatment with the A1155463 or vehicle mice. Absolute cell counts are shown for the following cell populations of the BCL-XL inhibitor A1155463 or vehicle-treated mice: myeloid cells – CD11b+ – myeloid cells; CD11b+Ly6Cmedium – circulatory monocytes; CD11b+Ly6Chigh – inflammatory monocytes; CD11b+Ly6G+ – neutrophils residing in the C spleen and D BM. E Number of CD11b+ myeloid cells residing in the blood, liver and lung. F LSK stem and progenitor hematopoietic cells. G Erythrocytes: – CD71+Ter119high – Early erythroblasts (EB); (EB) – CD71+Ter119intermediate – Pro-erythroblasts; CD71–Ter119+ – late EB. All data are presented as Mean ±SEM (n = 3–7; =3 independent experiments).
Discussion
Our study aimed to characterize and target BCL-2-regulated apoptosis signaling, with the ultimate goal of identifying novel therapeutic approaches for high-risk JMML. Constitutively active RAS signaling, downstream of SHP2, was shown to exert anti-apoptotic effects [34, 35]. In hematopoietic cells, SHP2D61Y or SHP2E76K mutants were shown to have increased viability by upregulation of BCL-2 and BCL-XL and downregulation of BIM. Similarly, Ptpn11E76K/+ transformed erythroleukemic TF-1 cells showed BCL-XL upregulation [45]. Here, we compare different primary cell types at the same time, using a mouse model reminiscent of JMML and different culture conditions. We found that oncogenic SHP2D61Y conferred survival advantages specifically to myeloid cells but not to HSPCs, despite high Ptpn11 mRNA levels in LSK cells. Survival advantages were accompanied by BCL-XL and/or MCL-1 upregulation in Ptpn11 mutant myeloid cells and reversed by inhibition of the SHP2 downstream signaling, establishing a direct link between the oncogene and these anti-apoptotic proteins. This suggests that apoptosis resistance, alongside increased proliferation and differentiation, drives SHP2 myeloproliferation [13, 15]. The increased activation of RAS signaling in mature but not immature cells may explain why PTPN11 mutations, when acquired as a first hit, lead to differentiating myelomonocytic leukemia rather than acute myeloid leukemia. It raises, however, the question, of why PTPN11 and/or KRAS mutations in HSCs allow relapse after transplantation. Most likely, PTPN11 and/or KRAS mutated HSCs acquire features providing selective fitness not linked to cell death signaling (i.e. immune escape mechanisms, metabolic fitness or others). Understanding the specific reasons for higher KRAS signaling in mature cells and the selective fitness of HSCs requires further detailed studies of the differentiation process, the regulatory networks involved, and the functional demands placed on both immature and mature cells.
In monocytes, both BCL-XL and MCL-1 expression were directly linked to SHP2D61Y but regulated differently: BCL-XL expression was regulated by both MEK and RUNX1, whereas MCL-1 was regulated by MEK alone. In neutrophils, no clear link between SHP2D61Y and the anti-apoptotic proteins was established. In addition, cell death decisions were affected by extracellular signals, which increased survival even in WT bystander cells. It was shown earlier that an abnormal microenvironment contributes to myeloproliferation in JMML mouse models, with CCL3/MIP-1 α playing an important role [46,47,48]. Here, we identified BCL-XL as a novel player in this setting.
Our model revealed a cell type-specific “BCL-2 protein addiction”, where BCL-XL and BCL-2 expression were essential for monocyte survival, whereas MCL-1 was crucial for neutrophils. Further analysis is needed to elucidate the regulation and engagement of these proteins. Differences in SHP2 signaling itself (i.e. activation levels and abundance of downstream signaling components), and other cell type-specific pathways, such as lineage-specific transcription factors, may influence the expression of BCL-2 family members. Potential candidates include NFkB and ETS, which were shown to influence BCL-2 protein expression, or the master transcription factors for myelomonocytic differentiation GATA2, PU.1 and GFI1 [49,50,51]. Similarly, the abundance of pro-apoptotic BH3-only proteins activated by developmental cues may differ between monocytes and granulocytes. Transcriptomic analyses and co-immunoprecipitation assays using highly purified cell populations will be necessary to fully delineate the apoptosis signaling pathways for each cell type.
Interestingly, apoptosis resistance increased during disease progression, with the most resistant granulocytes and monocytes at the lethal leukemia stage. Since there was no evidence of clonal evolution, we hypothesize that this is due to a gradual expansion of Ptpn11-mutant cells following polyI:C induction, combined with their selective advantages. However, we observed a strong downregulation of pro-apoptotic BH3-only and effector BCL-2 proteins in the late disease stage. At the same time, the response to BH3-mimetics changed, with a newly acquired BCL-2 dependency at the late disease stage. Most likely, niche-derived signals influence not only the abundance of BCL-XL but also of pro-apoptotic proteins. Along this line, apoptosis resistance could be transferred to bystander WT cells in vivo but was not maintained in culture, suggesting a complex interplay of cell types and soluble factors contributing to apoptosis resistance. Indeed, several proteins with known anti-apoptotic function in granulocytes (i.e., CD74, TNFα, and ITGAM/CD11b) [52,53,54,55] were enriched in the microenvironment of leukemic mice. While these signals may cooperate to increase the viability of bystander cells in vivo, oncogene-driven cell-intrinsic signals are sufficient to ensure the survival of leukemic SHP2D61Y cells.
Finally, we asked whether JMML could be cured by the BCL-XL inhibitor, based on our in vitro data. Treatment significantly reduced leukemic burden and interestingly affected cells not sensitive in vitro (i.e HSPcs and erythroid progenitors). Again, this supports the hypothesis that niche-derived signals change apoptosis signaling in vivo [46,47,48] and highlights the need for disease-relevant in vivo models. Not unexpectedly, BCL-XL inhibition used as monotherapy did not cure the mice. In patient-derived JMML cells, we recently identified synergistic effects of BCL-XL and MCL-1 inhibitors. Along this line, azacitidine reduced MCL-1 levels, explaining its synergy with BCL-XL inhibition in PDX mice [56]. Alternatively, therapeutic modulation of the microenvironment might increase the susceptibility of JMML cells towards BCL-xL inhibition. Future strategies could focus on disrupting LSK-niche interactions using small molecule inhibitors, integrin blockers to modulate ECM dynamics, or interventions targeting niche-derived survival cytokines. Anti-CXCR4 therapies, such as plerixafor, used in AML [57] to disrupt interactions with the bone marrow microenvironment, could be explored as a potential treatment in JMML.
The JMML PDX and genetically modified mouse models provide complementary insights into RAS dysregulation on apoptotic signaling. While the PDX model excels in translational relevance by mimicking key JMML features in patients (including methylation signatures), its reliance on immunodeficient mice limits the study of RAS effects on the complete hematopoietic and immune system. The genetically modified mouse model used in this study, in contrast, preserves immune interactions and enables detailed investigation of leukemogenesis in an immunocompetent setting, offering a more comprehensive view of disease progression on the full hematopoietic compartment. A more comprehensive understanding of apoptosis and other cell death forms, such as necroptosis and pyroptosis [58] in both models are crucial for harnessing cell death in therapeutic applications and to develop effective combination therapies.
Responses