Optically generated droplet beams improve optoacoustic imaging of choroid thickness as an Alzheimer’s disease biomarker

Introduction
The rapid progress in optical imaging technologies has revolutionized the realms of life sciences and medical sciences. To achieve diffraction-limited resolution in optical microscopy, a tight focal spot is typically necessary. This limits the depth of field (DoF) leading to a degradation of lateral resolution away from the focal plane1. This constrained DoF poses challenges for rapid high-resolution imaging of specimens with uneven surfaces or for three-dimensional (3D) volumetric imaging which usually demands time-consuming axial scanning and intricate image processing.
To achieve an extended DoF, researchers have explored various methods, namely dynamic remote focusing2, decoupled illumination and detection3, and multi-plane microscopy through spatial and spectral multiplexing4,5. However, these approaches often involve complex optical systems, susceptibility to misalignment in multi-plane imaging, and the need for accurate calibration. Computational microscopy adopts wavefront correction techniques for DoF-extension6. However, image reconstruction algorithms involve illuminating a thin sample which is not always the case. Deep learning techniques have been applied to enhance DoF, requiring extensive training with substantial ground-truth data, posing challenges in obtaining subject-specific data7.
In parallel, researchers have adeptly utilized propagation invariant beams like Bessel or Airy beams for extending the DoF in microscopy8,9. However, these methods often yield suboptimal image quality due to the presence of side lobes. To address these challenges, different approaches to suppress the side lobes of the Bessel beam have been proposed10,11,12,13,14. The fundamental concept involves the generation of two co-propagating Bessel beams with different k wavevectors, each exhibiting side lobes with a spatial phase difference, facilitating destructive interference between the lobes. These Bessel beams, with suppressed side lobes, are referred to as droplet beams in the literature15,16,17. They have been employed to enhance contrast in light sheet microscopy imaging13, but their application in hybrid microscopic techniques has yet to be explored. Furthermore, designing appropriate metasurface nanostructures can enable the realization of droplet beams11, promising integration into various nanophotonic procedures where Bessel beams have already demonstrated success, such as fabrication of three-dimensional integrated circuits18, surface machining19, nanolithography20, and near-field optical trapping21.
Optoacoustic microscopy (OAM) is one such hybrid technique that typically utilizes optical pulses to stimulate the emission of broadband sound waves in biological tissues22. To maximize detection sensitivity, spherically focused transducers are typically used, particularly in delicate samples such as ocular tissue samples23. In OAM, either ultrasonic detection or optical excitation can be improved to achieve better performance. Attempts to extend the working distance in OAM have been reported by using line-shaped, Bessel-like beams employing optical elements24, fiber-optic methods25, or metasurface technologies26,27,28. For example, imaging studies of mouse ears demonstrated a seven-fold increase in working distance when using Bessel beams instead of Gaussian beams24. In another study by matching the Bessel illumination with axicon detection, the DoF was increased by 17-fold over conventional configurations29. Furthermore, needle-shaped multiple foci beams have been explored to achieve an extended DoF, offering a depth nearly 28 times the Rayleigh length26. Recently, ultraviolet (UV) metalenses utilizing extended Nijboer-Zernike wavefront shaping theory have been proposed for UV-OAM systems to enable in vivo imaging without the need for exogenous markers, playing a crucial role in pathological diagnosis27,28. These UV metalenses can effectively extend the DoF to approximately 220 μm while maintaining a good resolution of 1.1 μm. Nevertheless, these approaches encounter obstacles, including pronounced side lobes that may affect image quality or imaging speed or demand specialized diffractive optic elements and intricate post-processing procedures. This research work presents, for the first time, the use of droplet beams in OAM, significantly extending the DoF to approximately 80 times the Rayleigh length. We illustrate the advantages of droplet illumination with improved contrast in fluorescent bead imaging and subsequent optoacoustic imaging of mice’s eye posterior ocular cavities. This technique facilitates the measurement of choroidal layer thickness, serving as an early biomarker for Alzheimer’s disease (AD).
Results
Droplet beam
To elucidate the fundamental concept behind the droplet beam, we revisit the generation of the zeroth-order Bessel beam. This beam is a result of the superposition of plane waves propagating at a fixed angle θ relative to the optical axis. The shared wave vector components ensure no phase shift along the axis among the interfering plane waves. Consequently, the beam exhibits z-invariant field distribution and self-healing properties30,31. While experimental realization of an ideal Bessel beam is not possible, one can always form a Bessel–Gauss beam which is nothing but a Bessel beam modulated by a Gaussian envelope. To introduce droplet characteristics i.e., z-dependence while preserving, to a great extent, diffraction-free properties, we overlay two coaxial Bessel beams, each possessing slightly different wave vectors ((kcos {theta }_{1}), (kcos {theta }_{2})). The outcome is the formation of an interference light-droplet structure whose electric field can be given by:
Here, (k=sqrt{{{k}_{{r}_{i}}}^{2}+{{k}_{{z}_{i}}}^{2}}=2pi /lambda) with ({k}_{{z}_{i}}=kcos {theta }_{i}) and λ being the wavelength. J0 is the zeroth-order Bessel function, (r=sqrt{{x}^{2}+{y}^{2}}) is the distance from the beam axis in the xy plane. Ai denotes the amplitudes of the superposing component beams and wg is the waist of the initial Gaussian beam which illuminates the axicon. The period length of the droplet beam can be controlled by optimizing amplitudes and propagation angles θi’s of the interfering wavefronts. The Bessel–Gauss beam produced has a radial and longitudinal wave vector that can be calculated from axicon parameter ((a=k,{tan }^{-1}(frac{{k}_{r}}{{k}_{z}}))). The Fourier transform of the Bessel beam results in the formation of a ring structure. A conventional lens can be used to achieve this Fourier transform, where the radius of the ring (({R}_{i}=frac{{k}_{{r}_{i}}f}{k})) is determined by the focal length of the lens. The droplet beam propagation is then simulated using the Fresnel diffraction integral, as detailed in ref. 32.
In our experiments, the initial droplet beam design aimed to achieve a DoF exceeding 1 mm, with a central lobe diameter (full width at half maximum, FWHM) ranging around 1 μm. This design would exploit most of the DoF of a typical ultrasonic transducer (UT) used for OAM while maintaining high lateral resolution. Furthermore, the choice of the microscope objective was limited to low numerical apertures (NA ≤ 0.25) but with a long working distance (WD ≥ 10 mm). The extended working distance was necessary to ensure sufficient clearance between the objective and the sample, allowing accommodation of a UT during the integration of droplet illumination into the OAM.
Figure 1a illustrates the configuration of the experimental setup used for the generation of droplet beams. This entails a modified Mach–Zehnder-type interferometer assisted with Bessel beams, where each arm is equipped with distinct lenses to produce coaxial rings. A continuous wave solid-state laser (Sapphire, Coherent) emitting a Gaussian beam at 488 nm illuminates a fused silica axicon with an angle of 0. 5° (AX1205-A, Thorlabs) to generate a Bessel–Gauss beam. The beam is then split into two parts using a 50:50 beam splitter. A set of lenses with focal lengths L1 and L2, as depicted in Fig. 1a, are introduced into the optical path to then generate annular beams (ring-shaped) with distinct spatial frequencies. Each lens is positioned precisely one focal length from the axicon’s focus, approximately located at the first beam splitter (BS1). The beams from the two arms are combined using mirrors and another beam splitter, forming coaxial rings (Fig. 1d at the rear aperture of a focusing objective (U Plan × 10, NA = 0.25, Meiji). The diameters of the two resultant rings are less than that of the objective’s back aperture, preventing beam clipping. The generated droplet beam is then characterized by a detection system consisting of a CCD camera (Fl2G-13S2M, Point Grey), a tube lens (f = 200 mm), and a microscope objective (Plan Apo, ×50, Mitutoyo). The axicon, focusing objective, and detection system are mounted on XYZ stages to aid precise alignment.

a Schematic of the experimental setup for generating and characterizing droplet beams. L lens, BS beam splitter, and M mirror. b The beam profile is captured when only the arm labeled as b in (a) is imaged. c The beam profile is captured when only the arm labeled as c in (a) is imaged. d Image showing rings generated by both arms at the position indicated by d in (a).
To find an optimal droplet beam profile, we considered different lens combinations that control the central lobe diameter, depth of focus (period), and energy distribution within the side lobes (radial vector). Notably, there is a trade-off between the efficiency of side lobe suppression and propagation invariant distance. The parametric dependence is extensively outlined in Section 1 of the Supplementary Information. Here, we compare the simulation and experimental results of two lens configurations: L1 = 500 mm with L2 = 1000 mm, and L1 = 750 mm with L2 = 1000 mm. It should be noted that for each configuration, the position of optics L1, L2, M1, M2, and BS2 were adjusted to have the rings on the back aperture of the objective. The generated beams were imaged by blocking one of the arms (location b or c in Fig. 1) of the Mach–Zehnder interferometer. The intensity profiles of the simulated and experimental beams exhibit only slight deviations. The spatial frequency for all lenses, 500 mm (Fig. 2a), 750 mm (Fig. 2b), and 1000 mm (Fig. 2a, b) shows good agreement between the simulated and the experimental profiles. Furthermore, the intensity ratio of the central lobes to the side lobes is also very close for all cases, indicating the validity of the approach.
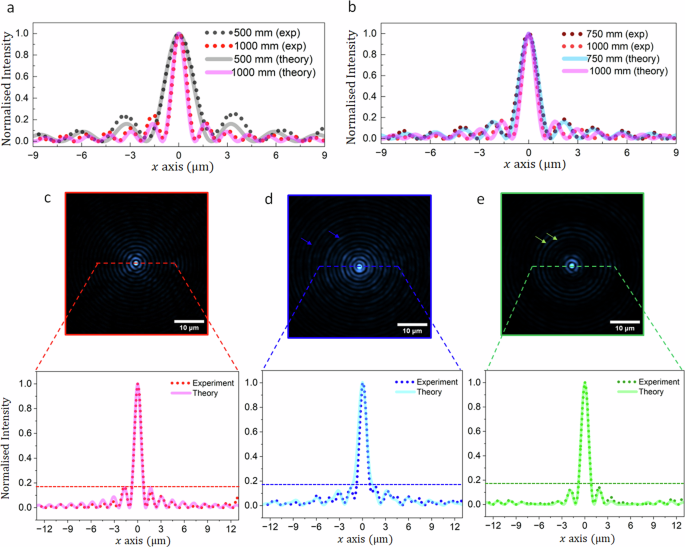
a, b Bessel beams were acquired using two different lens configurations labeled as L1 and L2 in Fig. 1a. c–e Bessel and droplet beams were generated by these two lens combinations. The solid lines represent theoretically predicted profiles, and the dotted line indicates experimentally obtained from beam profiles.
The droplet beam profile, arising from Bessel beam interference, shows significant side lobe suppression, ranging from complete extinction in the outer lobes to a 20% reduction in the first side lobe, compared to the reference Bessel beam generated with L2 = 1000 mm (Fig. 2c). The reference beam was imaged by blocking the beam in the short arm of the interferometer at location ‘b’ of Fig. 1a. The droplet beams generated in both cases (Fig. 2d, e) present suppressed first few side lobes. The simulated profiles are presented with solid lines along the respective experimental profiles. The suppression can be estimated through the acquired intensity profiles for the beams at the location of the dashed lines in each image (Fig. 2c–e). Comparing the relative intensity of side lobes to the central lobe, the reference Bessel beam’s first, second, and third side lobes exhibit intensities of approximately 16%, 12%, and 7%, respectively. In contrast, the droplet beam in Fig. 2d (with L1 = 500 mm) shows relative side lobe intensities of 14%, 11%, and 7%, respectively, thus showing marginal suppression for the first two side lobes and no discernible suppression for the third side lobe. However, the droplet beam presented in Fig. 2e (with L1 = 750 mm) exhibits 13% and 4% relative intensity for the first and second side lobes respectively, while the third lobe is reduced to background level. The power contained in the side lobes of the droplet beam is experimentally estimated to be 25% higher for the first lens combination (L1 = 500 mm, L2 = 1000 mm) compared to the second lens combination (L1 = 750 mm, L2 = 1000 mm). Moreover, the propagation invariant distance for the second configuration is approximately twice that of the first configuration. Therefore, the droplet beam from the second lens combination should exhibit a decreased background and an extended DoF when used for imaging. Notably, both droplet beams exhibit a central lobe diameter closely resembling that of the reference Bessel beam. The intensities of side lobes and their suppression levels closely align with theoretical predictions, affirming the simulation’s ability to foresee suppression levels for designing droplet beams with the desired DoF and diameter characteristics.
Microscopy
Figure 3a illustrates the integration of the interferometric setup mentioned earlier into an upright microscope operating in reflection geometry. Here, a pulsed laser (Helios, Coherent) emitting at 532 nm with pulse width τ = 1 ns and pulse repetition rate of 10 kHz was used. Time-variant intensity, like pulsed radiation, is essential for inducing thermo-elastic expansion and generating ultrasound waves in OAM. To demonstrate side lobe suppression and reduced image background, fluorescent microspheres were initially imaged using Gaussian, Bessel, and droplet beam illumination.
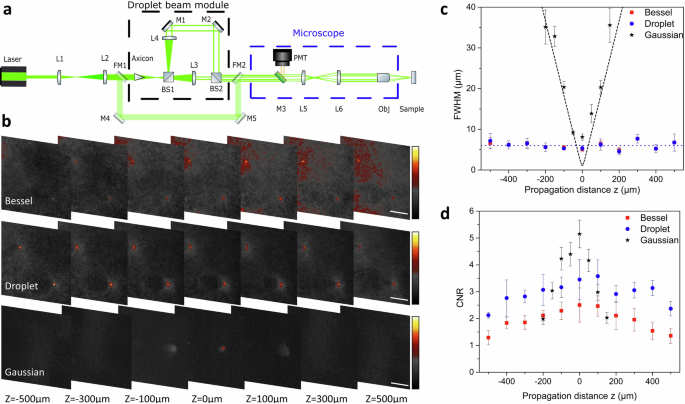
a Experimental setup integrating Bessel, droplet, and Gaussian illumination into the microscope. BS1-2 beam splitter, FM1-2 flip mirrors, L1-6 optical lenses, M1-5 optical mirrors, Obj microscope objective, PMT photomultiplier tube. b Images acquired when illuminating microspheres (d = 0.5 μm) with Bessel, droplet, and Gaussian illumination, respectively for different propagation distances z. All scale bars are 24 μm. c FWHM of the microspheres along the propagation axis using the different beams. d Calculated CNR of the microspheres for the same distances and respective beams.
Two flip mirrors (FM1 and FM2 in Fig. 3a) facilitate switching between Gaussian beam and “non-diffracting” beam illumination. During droplet illumination, both interferometer arms propagated freely, whereas, for Bessel illumination, the short arm was obstructed, resulting in sample illumination solely with the reference Bessel beam, as previously detailed. Furthermore, to reduce the optical path length the half-degree axicon was replaced with a 1-degree fused silica axicon (AX121-A, Thorlabs). Due to the change in the wavelength of the laser source and the axicon angle, all lenses and path lengths of both arms used in the interferometric setup were adjusted accordingly for optimal suppression. The coaxial Bessel rings created at the exit of the droplet module, are relayed to the back aperture of the objective through a set of lenses present inside the microscope (L5 and L6 in Fig. 3a).
The microscope body is a modified upright microscope (Axiophot, Zeiss) with an epi-illumination port for guiding the excitation light. The excitation beam is focused on the sample using the microscope objective (Meiji 10×) and the back-scattered fluorescence is collected by the same objective. This fluorescence signal is then directed through a dichroic mirror to a photomultiplier tube (PMT) (Hamamatsu H9305-03). The detected signal is enhanced by a low noise amplifier unit (Hamamatsu, C7319) and then digitized by a high-speed data acquisition card (CSE21G8, Gage) at a high sampling frequency (250 MHz). Synchronization and visualization are performed by software developed in C# by Rayfos LTD. To create a 2D image the sample is raster scanned using motorized stages (8MTF-75LS05, Standa), which also provide a synchronization trigger for acquisition and laser pulses. This trigger can be sent for each full step of the stages, with a minimum step size of 2.5 μm. Consequently, the minimum achievable pixel size is 2.5 μm, thereby limiting the attainable image resolution.
The microspheres (Estapor, microspheres with Fy dye and 0.5 μm diameter) were dispersed in water, placed on a microscope slide, and sealed with a cover glass. The optical power used for imaging the fluorescent microspheres was measured to be 0.65 mW for Gaussian, 1.3 mW for droplet, and 1.5 mW for Bessel beam at the sample plane. The images and intensity values used for the calculations were normalized to the optical power. Using a 1.5 mW optical power for Gaussian illumination was impractical due to observed photo-bleaching, leading to a decreased fluorescence signal. Near the focal plane of the beams (z = 0), the microspheres exhibited nearly identical diameters for all three beams. They measured slightly above 5 μm for both the droplet (5.3 μm) and the Bessel (5.1 μm) beams, while the Gaussian data indicated a slightly larger diameter of around 8 μm. The slight variation in diameter minima may arise from spatial under-sampling due to the stage step size and perhaps from slight photobleaching of the microspheres, even at lower power levels. For the non-diffracting beams, the diameter remains constant for over 1 mm as shown in Fig. 3c where the dashed blue line represents the average value. The DoF of the droplet beam can be considered to be at least 1 mm. The measured diameter of the microspheres expands rapidly in the case of Gaussian illumination, as expected. The apparent diameter away from the focal plane matches with the theoretical values for a Gaussian beam with waist wg = 1 μm (black dashed line in Fig. 3c). The Rayleigh range (Zr) of an ideal Gaussian beam (M2 = 1) with a 1/e2 diameter of 2 μm (the diffraction limit of the optical system being 1.7 μm) is estimated to be approximately 6 μm or about 12 μm in terms of DoF. Comparing the Gaussian beam’s DoF with that of the designed droplet beam, the droplet beam offers 80 times the Zr improvement in DoF.
Gaussian illumination presents higher relative intensity for the same total power which typically produces images with higher contrast. To quantify the contrast of images acquired with three different illuminations, the contrast-to-noise ratio (CNR) is calculated using the following equation:
where μs and μb are the mean values of signal and background respectively and σs and σb are the standard deviations values. The mean of a circular area with a diameter of 2 × FWHM was measured, which translates to a constant diameter of about 12 μm for the droplet and Bessel beams. However, for the Gaussian beam illumination, the diameter was adjusted for each propagation distance. The mean signal corresponds to an area at the center of the microspheres, while the mean background signal corresponds to an area measured 10 × FWHM away from a microsphere. Even from the images (Fig. 3b), it is evident that Bessel illumination presents the highest background and should produce the lowest CNR (Fig. 3d) across the entire propagation distance. Droplet illumination improves the contrast by 50% at the focal plane compared to Bessel illumination and maintains a CNR above 2 for almost 1 mm. The fluctuations of the CNR are attributed to intensity fluctuations of the droplet beam along the propagation axis (Section 2 of the Supplementary Information). Gaussian illumination exhibits the highest CNR at the focal plane with a peak value of 5.2 but deteriorates rapidly and even after approximately 200 μm the identification and localization of the spheres is questionable. The calculations of the CNR verify the enhancement achieved by the designed droplet beam with droplet CNR presenting the highest average value across the whole range.
In the case of OAM, the only difference in the microscope is the addition of a UT. The same focusing objective is employed (×10, Meiji) which provides adequate working distance (WD = 10.67 mm) for the accommodation of the UT. A piece of N-BK7 glass (BS in Fig. 4b) is mounted on the UT at a 45° angle allowing the laser beam to propagate freely through, but directing the ultrasound waves emitted from the sample directly to the UT. The UT (V214-BC-RM, Olympus, central frequency 75 MHz and relative bandwidth 81%) along with the attached glass are submerged into a 3D printed water tank which is filled with purified water for efficient ultrasound propagation. The sample rests at the bottom of a water tank made of a cover slip to ensure transparency for bright-field illumination. The detected ultrasound waves are amplified by two low noise amplifiers (AMP, TB-414-8A+, Mini-Circuits) which are connected in series providing a total gain of 62 dB.
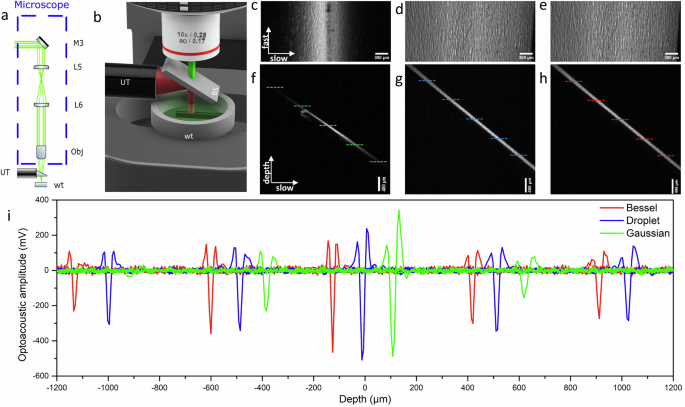
a OAM experimental setup showing the addition of an ultrasound transducer. b Close-up view of the ultrasound-laser beam separation. Laser light is depicted in green, while ultrasound waves are in red. UT ultrasound transducer, wt water tank, BS beam splitter. c Top view of the phantom using Gaussian illumination revealing the DoF. d Droplet illumination for the same sample, presenting the extension of the DoF. e Bessel illumination on the same sample. f Side view of the phantom shown in (c) (Gaussian illumination) showing the linear depth scanning. g Side view of the phantom shown in (d) (droplet illumination). h Side view of the phantom with Bessel illumination. i Optoacoustic profiles from Bessel (red), droplet (blue), and Gaussian (green) at the respective depths of ±1000 μm, 0 μm, and ±500 μm. Bessel and Gaussian profiles have been shifted for better clarity in visualization. Zero depth was defined at the plane of maximum optoacoustic amplitude. Dashed lines in (f–h) indicate the approximate position of the profiles.
To demonstrate the advantage of extended DoF in the microscope, a phantom sample consisting of black Scotch tape was affixed to the hypotenuse of a right-angle prism (PS910, Thorlabs). Positioning the right angle at the bottom of the water tank establishes a seamless linear depth scanning arrangement along the hypotenuse. In Fig. 4c, the hypotenuse of the prism is shown as the optoacoustic amplitude resulting from Gaussian illumination. The maximum amplitude projection (MAP) depicted along the slow and fast scanning axes plane illustrates the DoF for a Gaussian beam. The phantom is visible in the middle portion of the image, which corresponds to the focal plane of the Gaussian beam. Moving towards the edges of the image corresponds to shifting away from the focal plane. As a result, the image resolution deteriorates and the amplitude is reduced. The apparent size of the structures of the phantom is increasing and creates the illusion of increasing roughness of the phantom away from the focal plane. On the other hand, droplet beam illumination is not affected by the same scanning scheme. Figure 4d depicts the same phantom illuminated with the droplet beam and details are revealed across the entire image. The amplitude is more uniform and there are no visible artifacts due to the diffraction of the beam for over 2 mm owing to the increased DoF. Furthermore, the MAP along the depth and slow axis plane (presented in Fig. 4f, g for Gaussian and droplet beams respectively) show the difference in amplitude distribution for the two beams. Gaussian illumination creates high amplitude only at the center of the image, the focal plane. In contrast, droplet illumination presents an almost uniform amplitude distribution across the hypotenuse. In Fig. 4e, the phantom is illuminated with the reference Bessel beam and the image resembles the image taken with droplet beam illumination. The amplitude is uniform and provides a sharp contrast for the entire image. Note that should the images extend beyond the DoF, the same artifacts and edges would initially appear in Fig. 4d for the droplet beam and then at a greater DoF in Fig. 4e for the Bessel beam. Likewise, in Fig. 4h, the side view of the hypotenuse illuminated with the Bessel beam reveals an even smoother amplitude, indicating an extended non-diffracting region.
Optoacoustic profiles from different depths allow for direct comparison among the three different beam illumination (Fig. 4i). The same optical power was utilized for all beams. Profiles were captured at the focal plane of each beam and subsequently at distances of 500 μm and 1000 μm in both directions. The plane of maximum amplitude is considered as the focal plane. Consistent with our prior findings, the optoacoustic amplitude peaks at the focal plane under Gaussian illumination (Vpp ≈ 830 mV), but diminishes swiftly, reaching noise levels after 1 mm. Droplet illumination exhibits a slightly lower amplitude at the focal plane (Vpp ≈ 740 mV) but maintains high values throughout the DoF, ensuring fairly uniform illumination. In contrast, Bessel illumination yields the lowest amplitude (Vpp ≈ 635 mV) at the focal plane, but the reduction in amplitude is more limited, as expected. The Bessel beam presents a larger invariant distance compared to the droplet beam which also minimizes amplitude changes over short distances.
Another important aspect to consider is that the amplitude distribution is influenced not just by the illumination but also by the DoF of the detector. The DoF of the detector, defined by a drop of -6 dB in sensitivity, can be estimated to range between 1.5 mm and 3.6 mm, contingent on the ultrasound frequency, either 75 MHz or 30 MHz, respectively33. For the Gaussian beam, the DoF is significantly smaller than that of the detector DoF, indicating the Gaussian illumination should primarily influence the distribution. Conversely, the two non-diffracting beams (droplet and Bessel) produce images where the amplitude distribution is influenced by both the detector’s DoF and the excitation DoF, as they extend over comparable lengths. Aligning the detector’s DoF with the droplet design was the primary objective, allowing for increased overlap between the DoFs and maximizing sensitivity across the extended range. Matching the DoF of the detector with the droplet design was the initial goal and the increased overlap of the DoFs provides maximum sensitivity across the extended range.
It should also be noted that the uniformity of the amplitude distribution in the short-range originates from the phantom, which provides a continuous and uniform layer of absorbing material. This phantom uniformity masks the effects of the side lobes which are much more prominent in samples with complicated and fine structures or point sources like fluorescent microspheres.
To showcase the extended DoF and the high sensitivity of droplet beam illumination, we have imaged ocular samples excised from transgenic 5xFAD mice, a model for AD. The retina and the optic nerve are an extension of the central nervous system (CNS) and as a result, multiple pathological symptoms of neurodegenerative diseases have manifestations in the ocular cavity functioning as a window to the brain34,35. The choroidal layer thickness has been previously reported as a biomarker of AD using optical coherence tomography (OCT)36. OAM provides high-specificity optical contrast based on absorption, which is strong in the case of melanin in the visible spectrum. Melanin and melanin-producing cells, melanocytes, are found in the choroid layer (Fig. 5g) to absorb stray light. Therefore, the optoacoustic signal from melanin can be used to estimate the choroidal layer thickness.
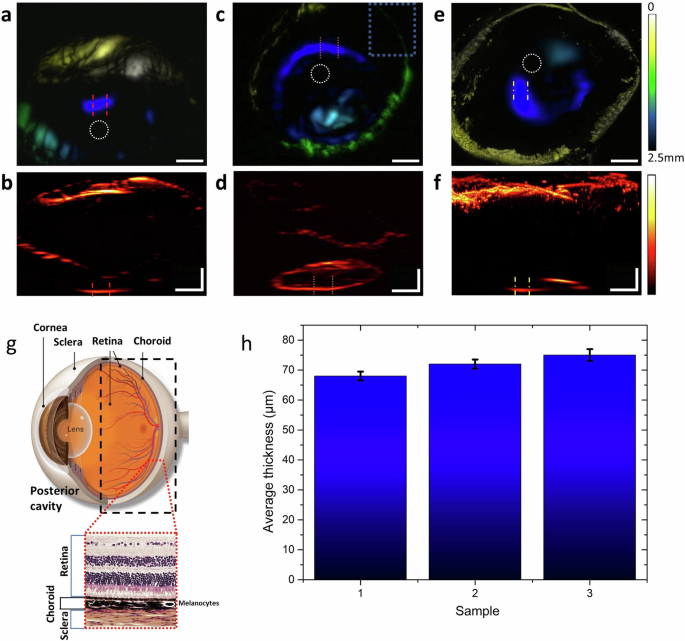
Top views are shown in (a, c, and e), with corresponding side views in (b, d, and f). Dotted circles indicate the approximate locations of the optic nerve in each image, while the dotted rectangle in (c) marks the area detailed in supplementary Fig. 4. Dashed lines denote where the choroid layer thickness was measured. Scale bars for both horizontal and vertical measurements are 500 μm. g Illustrates the anatomy of the eye, focusing on the posterior cavity, with an inset depicting the different eye layers. (Adapted with permission from https://www.aao.org/eye-health/anatomy/choroid49). h Presents the statistical analysis of choroidal thickness measurements, taken over a 400 μm length to provide average values and standard deviation as error.
The 5xFAD transgenic mouse model is congenic on the C57BL/6J (B6) mouse strain and harbors a total of five AD-linked mutations. It over-expresses human Amyloid-beta precursor protein with three familial Alzheimer’s disease (FAD) mutations, the Swedish (K670N, M671L), Florida (I716V), and London (V7171). The human PSEN1 transgene is also expressed in 5xFAD strain with two FAD mutations (M146L and L286V)37. A recent deep phenotypic study38 highlights the specific strain’s effective recapitulation of particular aspects of AD in humans. 5xFAD pathology can be categorized into three phases, mirroring AD pathology in humans. The initial asymptomatic phase, occurring at approximately two months of age, is characterized by the presence of amyloid plaques and the onset of gliosis. Subsequently, the prodromal phase, emerging at around four months of age, is characterized by extensive amyloid deposits, increased gliosis, and manifestation of cognitive deficits. The symptomatic phase initiates at around six months of age, featuring pronounced amyloid pathology, neuroinflammation, significant cognitive impairments, and disruptions in neurotransmission. Late AD-like stages or “severe AD-like pathology” become evident at around 9 months of age, exhibiting synaptic and neuronal loss39. Three ocular tissue samples from six-month-old 5xFAD male mice were imaged with droplet beam illumination in conjunction with OAM. The ocular tissue samples were divided into two segments, the anterior and posterior cavities (the part of the eye between the crystalline lens and the optic nerve), with the latter of each sample being imaged. The samples were placed in the water tank with the optic nerve resting on the glass and the posterior cavity facing toward the objective.
Each scan encompassed a volume of approximately 3.5 mm × 3.5 mm × 2.5 mm, effectively covering almost the entire posterior cavity. Figure 5a, c, and e present the top view of the samples where depth is color-coded. Yellow indicates the tissue nearest to the microscope objective, while blue represents tissue located deepest within the posterior cavity, with a maximum relative detection distance of approximately 2.5 mm. This color-code is also reflecting the increasing challenge and difficulty of acquiring contrast after long propagation distances. Figure 5b, d, and f present the respective side views of the samples with a different color map to enhance the visibility of the structures. The regions of the optoacoustic signal detected at the bottom of the cavity are anticipated to correspond to the vicinity of the optic nerve and the optic disk of the eye, owing to the sample placement. Furthermore, the optic disk signifies an opening of the choroid layer for the optic nerve to pass through40 which should translate to a lack of signal. Since the optic disk is frequently used as a landmark for measurements in the ocular cavity, the choroidal thickness was measured at tissue locations that are expected to be near the optic disk. The dashed lines indicate the positions where the thickness was measured, selected to be at the bottom of the cavity and in close proximity to an area of reduced signal near the cavity’s center. The thickness was assessed over a span of 400 μm along the choroid layer to obtain both an average thickness value and its standard deviation. The measurements produced a consistent average thickness below 80 μm. In particular, the thickness measurements in (b), (d), and (f) provided average values of 68 ± 1.5 μm, 72 ± 1.5 μm, and 75 ± 2 μm, respectively (Fig. 5h). These findings indicate a significant reduction in the average thickness of the choroidal layer compared to the typical control mouse strain B6. In 6-month-old animals, this strain has been reported to exhibit a choroidal thickness significantly higher than 80 μm near the optic disk41. Measurements of healthy mice were also performed with OAM and are presented in Section 5 of the Supplementary Information. The thickness reduction in the 5xFAD case seems to be close to or over 10%. These findings align with comparable measurements in human studies36, where the average thickness was reduced by 20%.
Discussion
We have demonstrated a novel way of generating droplet beams, which essentially are Bessel beams with suppressed side lobes. This is accomplished by combining two Bessel beams with distinct wavevectors through a conventional Mach–Zehnder interferometer, with each arm fitted with a lens of different optical power.
To showcase the extent of suppression and the non-diffracting characteristics, fluorescent microspheres were illuminated using Gaussian, Bessel, and droplet illumination. The droplet beam exhibited an enhanced CNR compared to a Bessel beam, with an increase of up to 50%, while maintaining an improved DoF of up to 80 Zr compared to an equivalent Gaussian beam.
The benefits of droplet illumination were then utilized in OAM, where the extended DoF can be leveraged by the UT. Phantom samples showcased the improved DoF relative to Gaussian illumination in OAM while retaining the same level of detail. The synergistic advantages of optoacoustics and droplet illumination were illustrated in a proof of concept study aiming at measuring AD-related biomarkers in the ocular cavity of transgenic 5xFAD mice carrying mutations linked to AD. The high-resolution OAM images permitted the evaluation of the choroid thickness which demonstrated a significant reduction compared to reported values of healthy animals. It should be noted that choroid thickness can also be used as a biomarker for other conditions like myopia42 and Huntington’s disease43. OAM elucidates molecular specificity based on optical absorption and produces high-contrast images with almost binary boundaries. Similar studies with OCT suffer from vascular shadows, vitreous artifacts, or noise interference44 that create challenges for thickness estimation. However, a comparative and multimodal study between OCT and OAM would benefit from both contrast mechanisms and reveal unambiguously the retinal layers.
Nevertheless, the design of the droplet beam in this implementation was constrained by the existing set of lenses and axicon available in-house. Furthermore, the mechanical and optical restrictions posed by the working distance of the objective and the UT apply only to OAM but can be alleviated by all-optical implementations of OAM where ultrasound waves are optically detected. Moreover, optical suppression of side lobes eliminates the need for costly wavefront shaping devices which also carry inherent optical complexity in contrast to the Mach–Zehnder type interferometer which is routinely employed. Unlike wavefront shaping devices such as spatial light modulators (SLMs) and digital micromirror devices (DMDs), which encounter power losses due to their limited diffraction efficiency (often below 40% for SLMs and 10% for DMDs)45,46, the proposed interferometry-based beam generation method does not suffer from any loss. SLMs exhibit limited phase stability, while DMDs have restricted modulation ranges depending on the method utilized, whether it is super-pixel47 or Lee holography48. Furthermore, owing to physical limitations, these devices for wavefront engineering cannot manipulate the UV wavefront, crucial for label-free fast histology imaging. Metasurface-assisted technologies or all-optical generation techniques, like the method proposed, could potentially serve as alternatives for microscopes operating at UV wavelengths. The established advantages of non-diffracting illumination are further enhanced by the suppression of side lobes and the improved CNR. Achieving high-resolution images of samples with irregular surfaces without compromising image quality has long been a goal in microscopy, and this method represents a significant advancement in that direction.
Responses