Optimization of electric charging infrastructure: integrated model for routing and charging coordination with power-aware operations

Introduction
The widespread adoption of electric vehicles (EVs) has ushered in a new era of sustainable transportation, addressing concerns about environmental impact and reducing dependence on fossil fuels. However, the transition to electric mobility brings with it the need for efficient and reliable charging infrastructure. By the end of 2022, the global number of public charging points reached 2.7 million, with over 900,000 installations taking place during that year. This signifies a notable growth of approximately 55% compared to the charging point stock in 20211. While this represents a significant increase, it still falls short of meeting the growing demand for EV charging. The limited availability of charging stations poses a significant obstacle, leading to long waiting times and inconvenience for EV owners2. As EVs travel across a transportation network, the allocation of charging resources among multiple charging stations becomes crucial to ensure seamless charging accessibility.
EVs are gaining popularity as a sustainable and eco-friendly transportation option. The coupling of transportation and energy markets captures the interconnectedness between EV charging infrastructure and the energy market. Power-aware operations, on the other hand, involve managing power constraints to optimize the use of available electrical resources and provide efficient charging services for EVs. In the context of charging infrastructure, power-aware operations ensure that charging stations maximize the utilization of electricity resources while delivering reliable charging services. This involves considering factors such as power capacity, load balancing, and dynamic power scheduling to efficiently manage the charging process. Figure 1 depicts a charging station with battery storage, charging equipment, and EVs, all powered by the grid for sustainable and efficient charging.

Electric charging station.
Charging stations equipped with batteries offer a transformative solution to enhance grid efficiency and optimize EV charging operations. By participating in demand response programs, these stations can assist grid operators and utility companies in managing electricity demand during peak periods. The integrated batteries allow for load shifting, storing excess electricity during low-demand periods and releasing it during high-demand hours, reducing strain on the grid. Furthermore, by leveraging time-of-use (TOU) rates, charging stations can strategically charge their batteries during times of lower electricity prices and utilize the stored energy to charge EVs when rates are higher. This combination of demand response programs and TOU rates empowers charging stations to minimize costs and contribute to a more resilient, cost-effective, and sustainable electrical grid.
Renewable energy sources are often decentralized and can be integrated into the charging station infrastructure itself. This localization of generation reduces the need for long-distance power transmission and associated energy losses. By generating electricity closer to the point of consumption, charging stations powered by renewable energy can minimize transmission constraints and enhance overall system efficiency. The integration of renewable energy into charging operations allows for efficient utilization of available resources. During periods of high renewable energy generation, excess electricity can be directed towards charging electric vehicle batteries, effectively using surplus power that might otherwise go unused. Furthermore, renewable energy sources generally have lower operating costs compared to conventional fossil fuel-based generation. In this study, we investigate the influence of renewable energy sources, specifically wind turbines (WT) and photovoltaic (PV) systems, on the power grid. Our analysis focuses on examining the behavior and characteristics of WT and PV systems to gain insights into their impact on grid stability and charging operations at EV charging stations. By studying these factors, we aim to enhance our understanding of the implications associated with integrating renewable energy sources into the power grid. However, the widespread adoption of EVs faces several challenges, including the optimization and improvement of EV charging operations.
The current charging infrastructure for EVs faces several challenges that hinder its optimal performance. Range anxiety, a term used to describe the fear of running out of battery power before reaching a charging station, is a prominent concern among both current EV owners and potential buyers. According to a survey conducted by the American Automobile Association in the United States3, 58% of respondents identified range anxiety as a significant deterrent to purchasing an electric vehicle. Similarly, according to a survey by the European Automobile Manufacturers’ Association4, 51% of potential EV buyers in Europe are concerned about the driving range and availability of charging infrastructure. This anxiety arises from the perceived limitations in EV driving range when compared to traditional internal combustion engine vehicles, as well as the necessity for accessible and dependable charging infrastructure. The apprehension surrounding range anxiety underscores the importance of expanding charging networks and enhancing EV battery technology to alleviate concerns and promote wider EV adoption.
The time required to charge an electric vehicle is another challenge. While EV charging technology has improved, it still takes significantly longer to charge an EV compared to charging a conventional vehicle with gasoline or diesel. Fast-charging stations can partially alleviate this issue, but their availability is limited. According to a study by the European Commission5,6, the average charging time for an EV can range from 30 minutes to several hours, depending on the charging station’s power output. However, fast-charging stations can significantly reduce charging time. For example, Tesla’s Supercharger network can provide up to 170 miles of range in just 30 min7. In addition to traditional charging methods, there are other faster charging methods, such as swapping, that are also considered in the context of electric vehicle charging. In a study by8, the optimization of the charging process at battery swapping stations is explored. The research specifically investigates the significance of a non-myopic routing policy for electric taxis, considering factors such as the limited battery capacity and customer delay.
Charging demands can vary greatly depending on factors such as the time of day, day of the week, and location. This variability makes it difficult for charging infrastructure providers to accurately anticipate and meet the charging needs of EV owners. Consequently, charging stations may experience periods of high demand where they are overwhelmed, leading to long wait times and inconvenience for EV owners. Conversely, during periods of low demand, charging stations may remain underutilized, resulting in wasted resources and inefficient operation. We develop a model that accurately estimates electric charging demands by integrating a charging plan and routing problem. By integrating these two components, the model can effectively determine the charging requirements of electric vehicles.
According to a report by the9, the number of EVs in Europe could reach 44 million by 2030, resulting in an additional electricity demand of 15%. The increased demand for electricity from charging stations, including those powered by renewable energy sources such as wind and solar, can strain the existing power grid infrastructure. Simultaneous charging of multiple EVs in a localized area can lead to peak demand that surpasses the grid’s capacity, potentially causing power outages or grid instability. Therefore, the integration of EV charging with smart grid technologies and load management strategies becomes crucial to balance power demand and ensure the stable operation of the electricity grid.
Ensuring an adequate power supply to meet the charging demands of multiple stations simultaneously can be challenging, particularly in areas with inadequate electrical infrastructure. The limited availability of charging resources constrains the charging infrastructure’s capacity to efficiently meet the growing demands of EV owners. However, our innovative approach addresses this challenge by considering the remaining energy between origin-destination (OD) demands, while also taking advantage of renewable energy sources. By precisely calculating and efficiently allocating charging resources, including those from renewable energy such as wind and solar, our approach significantly enhances the effectiveness of the charging infrastructure. This enables electric vehicles to seamlessly meet their energy requirements throughout their journeys, contributing to a sustainable and reliable transportation ecosystem.
The costs associated with electricity procurement and operational expenses further compound the challenges faced by charging stations. Electricity costs can vary depending on market dynamics, and procuring electricity at competitive rates while ensuring a reliable supply can be a complex task. These financial hurdles impact the profitability and long-term sustainability of charging stations, making it crucial to optimize resource allocation and minimize costs. The proposed model enables strategic decision-making through its bidding strategy formulation. By determining the optimal quantity of electricity to bid and the corresponding bidding price in the day-ahead market, charging stations can minimize their costs while meeting the power requirements of the stations. The model also incorporates real-time pricing adjustments in the intra-day market, allowing charging stations to adapt to changing market conditions and optimize their financial outcomes.
In response to these challenges, we develop an optimization model that determines the optimal allocation of charging resources among the charging stations. This model would consider factors such as the estimated power needed for each charging station based on the charging requirements of the EVs at each OD demand, the available battery capacities of the charging stations, and the charge efficiency. The model aims to minimize costs associated with electricity procurement and operational expenses while meeting the estimated power needs of each charging station. The following section outlines our significant contributions to electric charging features.
-
We integrate an optimization model that combines charging and routing plans with the electricity market, aiming to minimize social costs for both users and charging providers.
-
We concentrate on estimating the charging demands of electric vehicles at charging stations and evaluating the overall power grid requirements necessary to efficiently meet these demands.
-
We integrate renewable energy sources, such as solar and wind, into the charging infrastructure, optimizing their utilization based on availability and variability to create a more sustainable and environmentally friendly charging ecosystem.
-
We consider the bidding strategy of charging stations in both the day-ahead and intra-day electricity markets, optimizing the quantity of electricity to bid and corresponding bidding prices based on estimated power needs and real-time pricing. Our goal is to dynamically adjust the bidding prices to optimize financial outcomes while meeting the power needs of the stations.
-
This model actively monitors the state of charge (SOC) of the charging station batteries, optimizing energy storage system utilization and ensuring a reliable power supply for vehicle charging.
-
This study considers additional operational factors associated with charging stations, such as the total setup time at each station, the charging time, and the state of charge for the battery.
Results
The proposed study introduced a novel model that simultaneously considers both user-centric and charging provider-centric aspects. This novel approach takes into account the needs and preferences of EV users as well as the operational requirements and constraints of charging providers. By integrating these dual perspectives, the model provides a comprehensive and balanced solution for optimizing charging operations. This unique approach enhances the overall user experience while ensuring the efficiency and sustainability of charging operations. The consideration of both user-centric and charging provider-centric aspects sets this model apart from previous studies, making it a pioneering contribution to the field of EV charging optimization.
The optimization model that was proposed in this study focused on addressing the challenges associated with charging and routing EVs. One of the key considerations was the limited range of EVs and their specific charging requirements. The objective of the model was to optimize the charging plan by strategically planning charging operations to ensure that EVs could successfully complete their trips without running out of battery power. To capture the complexity of EV charging operations, the model took into account various factors. These factors included setup time, which considered the time required to prepare the charging station for the arrival of an EV, and charging time, which reflected the time needed to charge the vehicle’s battery to the desired level.
A critical aspect of the model was the estimation of bidding prices for both day-ahead and intra-day electricity markets. By estimating these prices, the system was able to make informed decisions regarding electricity procurement, optimizing the cost of charging EVs at the charging stations. This estimation also considered the varying prices associated with different energy sources, allowing the model to select the most cost-effective option for charging. Furthermore, the model incorporated the total power availability from three sources: the electricity grid, solar energy, and wind energy. This consideration was essential for aligning the charging operations with the capacity of the grid and the prevailing bidding prices. By incorporating this information, the model ensured that the charging plan optimally utilized the available power resources from all three sources, avoiding overloading the grid and promoting efficient and cost-effective charging operations. The proposed optimization model not only focused on efficiency but also emphasized sustainability. By maximizing the use of renewable energy sources, such as solar and wind energy, the model contributed to the overall goal of reducing carbon emissions and promoting sustainable transportation.
Our analysis showed that integrating renewable energy sources into electric vehicle charging infrastructure brings significant advantages. By leveraging renewable energy, we observed a notable reduction in electricity demand for charging batteries at charging stations, with a substantial decrease of up to 42% at charging stations. Additionally, the integration of renewable energy resulted in a significant cost reduction of approximately 69% compared to scenarios without renewable energy. These findings highlight the tangible benefits of utilizing sustainable power, including reduced reliance on non-renewable energy and substantial cost savings. Furthermore, strategically aligning charging sessions with periods of high renewable energy generation enabled optimal utilization of renewable sources, minimizing the need for energy storage or grid reliance. Overall, these results emphasized the potential of renewable energy integration in advancing sustainable transportation practices and contributing to sector-wide decarbonization.
Literature review
Existing literature in the field of charging infrastructure planning often adopts either a user-centric or charging provider-centric approach. User-centric studies prioritize minimizing the distance traveled or time spent on charging operations from the perspective of electric vehicle users. These studies aim to optimize the charging experience for individual users, focusing on factors such as charging station availability, proximity, and convenience. However, user-centric approaches may not fully consider the impact on infrastructure and overall system efficiency. In contrast, charging provider-centric approaches concentrate on optimizing the operations of charging stations. These studies aim to minimize operational costs and ensure efficient service provision. However, charging provider-centric approaches may overlook user preferences and the overall charging experience.
To bridge this gap, our proposed method aims to consider both user-centric and charging provider-centric aspects simultaneously. By embracing a comprehensive approach, we can optimize the charging infrastructure planning process to benefit both electric vehicle users and charging providers. This approach takes into account user preferences, such as minimizing travel distance and charging time, while also considering the efficient utilization of charging infrastructure resources and the overall system efficiency. By integrating both perspectives, our proposed method can provide a more comprehensive and balanced approach to charging infrastructure planning. It ensures that the needs and preferences of electric vehicle users are met while also optimizing the operations and efficiency of charging stations. This integrated approach contributes to the development of a charging infrastructure network that is user-friendly, cost-effective, and sustainable.
Charging and routing problem
This section aims to explore the existing research on charging plans and routing problems for electric vehicles, highlighting the strategies and solutions proposed in the literature. Efficient routing of EVs involves identifying the most suitable charging stations along the route. Studies have proposed approaches that consider the routing challenges specific to electric vehicles, considering their limited driving range and the need for charging stops. For example10, introduced a dynamic routing approach for electric taxis using a Markov decision process (MDP) that considers limited battery capacity, battery swapping stations, customer delay, and system cost11. proposed a dynamic routing and pricing problem under a mixed fleet of electric and conventional vehicles. A comprehensive examination of the latest advancements in mathematical modeling-based literature on EV operations management is presented in12.
Optimally deploying public charging stations plays a vital role in facilitating convenient and efficient travel for EV drivers. This deployment strategy enables drivers to make spontaneous adjustments and interact with their travel and recharging decisions. Additionally, it helps maintain multi-class tour-based network equilibrium conditions, ensuring a balanced and sustainable transportation system for EV users13. Real-time traffic conditions and the availability of charging stations can significantly impact route planning for EVs. Researchers have explored techniques that integrate real-time traffic data and charging station availability information into routing algorithms. These approaches aim to optimize the route considering both traffic congestion and charging station availability to minimize travel time and charging delays14. proposed routing and charging plans for alternative fuel vehicles that aim to minimize travel time15. introduced an adaptive charging and routing strategy that reduces waiting times at charging stations by considering driving, waiting, and charging time16. investigated a route planning and charging navigation strategy based on real-time traffic information and grid information, optimizing driving and charging paths to minimize travel time and charging station load17. considered an EV route selection and charging navigation optimization model that utilizes crowd sensing for road velocity estimation and addresses waiting time at charging stations.
The optimal location of charging stations is a key research area within the field of electric vehicle infrastructure planning. Many papers and studies specifically address this topic with the aim of determining the most efficient and effective locations for charging stations18. determined the optimal number and locations of fast-charging stations for range-limited alternative fuel vehicles, considering both cost minimization and maximum coverage objectives13. investigated the optimal placement of public charging stations for electric vehicles within a road network, taking into account the dynamic nature of drivers’ travel and recharging decisions and their spontaneous adjustments and interactions.
Range anxiety refers to the fear of running out of battery power before reaching the destination. Researchers have developed routing algorithms that consider both the available charging infrastructure and the energy consumption characteristics of EVs. These algorithms aim to optimize the route selection to minimize energy consumption while ensuring that the vehicle reaches its destination without depleting the battery19. addressed the battery charging station location problem by considering users’ range anxiety and distance deviations, two key barriers to EV mass adoption20. focused on the optimal location of charging stations in a specific neighborhood, optimizing demand coverage and station capacity21. investigated the optimal locations of wireless charging facilities, incorporating traffic flow patterns and user equilibrium principles. These papers provide insights into the strategic allocation and placement of charging stations to alleviate range anxiety and optimize EV infrastructure planning.
Electricity market
A range of studies have explored the use of stochastic operational models for controlling EV charging to provide frequency regulation22. and23 proposed two-stage stochastic problems to optimize the charging of EVs. They also co-optimized the utilization of distributed energy resources24. further enhanced this approach by applying stochastic dynamic programming to the optimization of charging and frequency regulation capacity bids25. extended this work by considering the management of EV loads to mitigate renewable generation intermittency and distribution network congestion, using a hierarchical decision-making methodology. These studies collectively highlight the potential of stochastic operational models in improving the efficiency and effectiveness of EV charging for frequency regulation.
In the electricity market, charging station operators can participate in bidding processes to procure electricity at competitive prices. A range of studies have explored the optimization of bidding strategies for charging station operators in the electricity market. These studies emphasize the importance of considering factors such as electricity prices, charging demand, and station capacity in these strategies. Specifically, probabilistic estimates of demand and competitor behavior have been highlighted as crucial aspects26,27. The role of Electric Vehicle Aggregators (EVAs) has also been investigated in this context28. proposed a power price control strategy for the charging of electric vehicles, which involves centrally managing the batteries of electric vehicles and adjusting the demand for charging through electricity price control. Effective bidding strategies can help charging station operators secure electricity supply at favorable prices, reducing operational costs and maximizing revenue29. introduced a stochastic linear programming model to construct piecewise linear bidding curves. This model aimed to address the uncertainty and variability present in bidding scenarios by incorporating stochastic elements into the bidding curve construction process. The study conducted by30 proposes a grid-connected charging station that operates as a price-taker and provides multiple products. To facilitate coordinated bidding for this station, a two-stage stochastic program is developed.
The optimal bidding strategy for EV aggregators in day-ahead markets is a key area of research, with various studies exploring different aspects of this strategy31. introduced the concept of two agent modes, the centralized protocol management mode (CPMM) and the decentralized demand response mode (DDRM), and developed a stochastic optimization model to maximize the expected profits of the EV aggregator32. focused on the problem of an aggregator bidding into the day-ahead electricity market, with the former proposing a strategy to minimize charging costs while satisfying the flexible demand for plug-in electric vehicles (PEVs). Both studies highlight the potential cost reductions and the importance of flexible charging.
This study proposes a novel approach that combines charging plans, routing optimization, and the electricity market to determine the optimal charging demand for EVs while minimizing social costs for both users and charging providers. Traditional studies in the literature have predominantly focused on either user preferences, such as minimizing distance or minimizing charging operations at charging stations. However, our approach takes a comprehensive perspective by integrating these two objectives into a unified framework. By leveraging the electricity market, we enable the purchase of the total power grid capacity necessary to fulfill the charging demands of EVs, resulting in a more efficient and cost-effective solution. We optimize the routing and charging plans for electric vehicles considering the remaining energy levels between origin-destination (OD) demands. By taking into account the current energy levels of electric vehicles, the proposed model can plan efficient routes and determine when and where charging is necessary. This approach helps minimize unnecessary charging stops and ensures that vehicles reach their destinations without running out of charge. Bidding prices for EV charging stations can be estimated by incorporating actual charging demands at charging stations and estimating the power needed for charging stations based on the power requirements for charging vehicles. Accurately predicting bidding prices through market analysis enables charging infrastructure operators to set competitive prices, efficiently allocate energy resources, and minimize costs.
Discussion
The proposed optimization model for EV charging operations had significant impacts on real charging stations, benefiting both users and charging providers. By integrating charging and routing plans with the electricity market, the model aimed to minimize social costs, resulting in more efficient and sustainable mobility. One notable contribution was the accurate estimation of charging demands at stations and evaluation of power grid requirements, ensuring successful trip completion and an optimized charging plan considering EV range and requirements.
The model also considered the total power availability from the electricity grid, aligning charging operations with the grid capacity to prevent overloading and maintain stability. Load balancing was also addressed by optimizing the distribution of charging loads across different stations, reducing peak demand periods, and avoiding strain on the grid. The model actively monitored the state of charge (SOC) of charging station batteries, optimizing the utilization of energy storage systems to ensure a reliable power supply for vehicle charging. Effective battery SOC management helped mitigate the impact of fluctuating power demands and provided a stable charging experience for EV users.
The model was enhanced by incorporating renewable energy sources such as wind turbines and photovoltaic cells into the charging stations, thereby promoting environmentally friendly charging operations and reducing dependence on fossil fuels. This integration of renewable energy aligns to establish a sustainable and low-carbon transportation system. Additionally, when estimating the PV and wind energy, capacity factors are taken into account. Capacity factors assess the actual energy output of a renewable energy system relative to its maximum potential output, accounting for factors such as weather conditions and system efficiency. By considering these capacity factors, a more precise estimation of energy production from PV and wind systems can be achieved, facilitating improved planning and utilization of renewable energy resources at electric charging stations.
The model incorporated a dynamic bidding strategy for charging stations in both the day-ahead and intra-day electricity markets. This allowed charging providers to adjust their bidding prices based on real-time pricing and estimated power needs, minimizing costs while meeting station power demands. By integrating bidding prices and optimizing charging plans, the model promoted cost-effective charging operations. It considered estimated power needs, real-time pricing, and available power resources, enabling charging providers to make informed decisions on electricity procurement. This optimization made charging EVs at stations economically viable and cost-effective for providers and users alike.
This model offers capabilities for analyzing factors such as remaining battery charge, distance to be traveled, and the availability of charging infrastructure, making it useful for both autonomous vehicles (AVs) and AV charging stations. It can provide recommendations for the most suitable charging station based on proximity, charging speed, and compatible connectors, as well as estimate the required charging duration or energy capacity considering variables such as battery capacity, energy consumption rate, and planned routes. By utilizing these features, the model can contribute to efficient AV charging and operation, ensuring optimal access to charging infrastructure and enhancing the overall charging experience.
Future research directions in electric vehicle charging infrastructure can explore an integrated model that accommodates both electric and hydrogen vehicles, considering the unique requirements of hydrogen fueling stations. This research should focus on hydrogen storage, dispensing technologies, and safety considerations. Advancements in vehicle-to-grid (V2G) technology, coupled with the ability to sell surplus energy to the grid during high-demand hours, offer numerous benefits to electric vehicle (EV) users, charging stations, and grid stability. Furthermore, as the frequency of disaster events such as wildfires33, cyber attacks34, and earthquakes35 has risen in recent years, harnessing surplus energy during these critical periods can significantly enhance overall grid stability and resilience. These research directions have been actively explored in future studies. Moreover, the government’s role in providing incentives for renewable energy integration and electric vehicle adoption, including financial support and streamlined processes, should be further investigated36,37. Developing efficient algorithms to address variable charging demands for commercial purposes and integrating real-time traffic data into charging infrastructure planning models are also crucial areas for future exploration38,39. Lastly, in the current model, energy consumption is estimated by converting distance, but it can be enhanced by incorporating an energy consumption function to more accurately estimate the state of charge for electric vehicles between their origin-destination demands.
Methods
The proposed framework
Efficient charging infrastructure and operations are crucial to ensure the seamless integration of EVs into the existing transportation system. Figure 2 presents a system designed to improve the optimization of EV charging operations. The proposed model incorporates routing decisions and charging plans for all origin-destination (OD) demands within the transportation network, aiming to enhance the efficiency and convenience of EV charging operations. By considering the remaining energy levels of EVs and accurately estimating the total charging demands of charging stations, the model ensures that EVs are directed to the most suitable charging stations along their routes. This optimization process minimizes travel distance and alleviates anxiety for travelers by providing a reliable and accessible charging infrastructure throughout their journeys. Moreover, the model incorporates setup time and charging time at charging stations to provide a more precise estimation of the overall charging time needed for each EV.
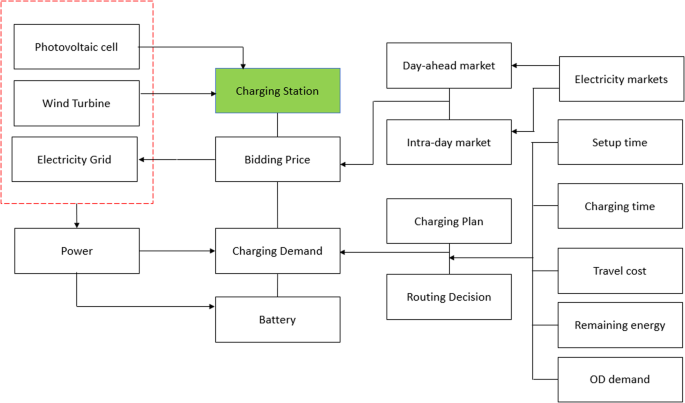
The proposed framework of electric vehicle charging infrastructure planning.
The power sources in the electric charging station are depicted in Fig. 2 by the dashed red line, representing the combination of power grid and renewable energy. Combining renewable energy sources like solar and wind power in electric vehicle charging stations offers a holistic solution. By integrating wind turbines and photovoltaic (PV) cells, these stations can access a reliable and steady energy supply, capitalizing on the synergistic generation profiles of wind and solar power. This synergistic approach optimizes energy generation, effectively utilizing available space, ensuring resilience in diverse weather conditions, enabling load balancing, and facilitating the storage or sale of surplus energy. Incorporating both wind and solar power not only promotes sustainability and decreases carbon emissions but also enhances the public perception of the charging station as a pioneering entity that embraces clean energy for transportation systems.
In the electricity market, suppliers, such as power plants, submit bids indicating the amount of electricity they are willing to supply at various price levels. These bids are typically based on the production costs of the suppliers. The proposed model incorporates an economic perspective by addressing the cost aspect of EV charging operations. It achieves this by considering bidding prices in day-ahead and intra-day electricity markets. By accurately estimating the prices for purchasing electricity at charging stations, the model enables the optimization of charging costs and enhances the efficient utilization of available resources. This advanced approach empowers charging station operators to make well-informed decisions regarding the procurement of electricity. By considering market dynamics and pricing fluctuations, the model assists operators in balancing the cost-effectiveness of charging operations. By providing accurate estimations of bidding prices, the model contributes to the overall cost optimization of EV charging, delivering advantages to both charging station operators and EV owners. With the utilization of these economic insights, stakeholders can enhance the efficiency of their charging operations, minimize expenses, and advance sustainable transportation practices. The model not only supports the growth of the EV market but also facilitates the integration of electric vehicles into the existing energy market ecosystem.
During the bidding process for each hour, a collection of points known as scenarios is utilized on a bidding curve. These scenarios correspond to specific bid prices and bid volumes, providing a comprehensive representation of the various pricing and quantity options offered by suppliers. However, due to the non-linear nature of the formulation resulting from selecting both bid prices and volumes, an approach is taken to linearize the problem. To achieve linearity, the bid prices are treated as fixed exogenous parameters, while the bid volumes are modeled as decision variables. The bidding curve is constructed by interpolating linearly between adjacent price-volume pairs, resulting in a piece-wise linear curve that represents the bids. This linearization simplifies the problem while still capturing the essential characteristics of the bidding process.
Figure 3 depicts a bidding curve characterized by three line segments, serving as an illustrative example. The bidding curve is typically depicted graphically, with the price plotted on the vertical axis and the quantity on the horizontal axis. Each point on the curve represents a specific price-quantity combination that a supplier is willing to offer. The shape of the curve reflects the supply-side behavior and competitiveness of the market. Equation (1) and Equation (2) represent the bidding curve using different variables. Equation (1) expresses the curve in terms of prices, while Equation (2) expresses it in terms of volumes.
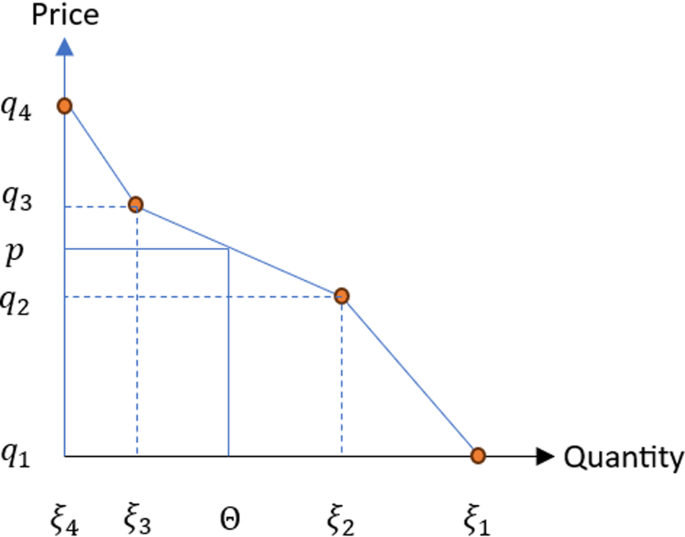
Electricity market bidding curve.
Furthermore, the proposed model takes into account the state of charging for batteries at the charging stations through the consideration of charging and discharging functions. Installing backup power systems, such as batteries, can enable charging stations to continue operating during power outages. These systems can provide electricity to the charging infrastructure, ensuring that electric vehicles can still be charged even when the grid is down. It’s important to properly size and maintain backup power systems to ensure they have sufficient capacity and reliability. By continuously monitoring the charging levels and managing the flow of electricity, the model ensures that the charging stations operate within their capacity limits and prioritize the needs of EVs. This functionality optimizes the charging process, avoiding overloading of the charging infrastructure and maintaining a reliable and stable charging experience for EV owners. The model’s ability to regulate the state of charging at charging stations contributes to the overall efficiency and effectiveness of EV charging operations, enhancing the charging experience and promoting widespread EV adoption. The proposed model aims to generate a set of outputs that collectively contribute to the optimization and improvement of EV charging operations. The outputs derived from the proposed model encompass:
-
The model provides optimized routing decisions for EVs, considering factors such as travel costs, charging station availability, and energy consumption. By optimizing the routes, EVs can reach their destinations efficiently while minimizing energy consumption and charging requirements.
-
The model generates charging plans that determine when and where EVs should charge along their travel routes. By considering the OD demands, the model ensures that there are sufficient charging stations available to meet the charging needs of EVs throughout their journeys.
-
The model takes into account the remaining energy levels of EVs and considers them in the routing and charging decisions. By factoring in the remaining energy, the model aims to reduce traveler anxiety by ensuring that EVs have adequate energy reserves to reach their destinations and avoid running out of charge.
-
The model optimizes the charging demands for charging stations by considering factors such as charging station capacities, electricity grid constraints, and EV charging requirements. This optimization helps in efficiently utilizing the charging infrastructure and minimizing charging congestion.
-
The model considers the availability and variability of renewable energy sources. By optimizing the utilization of these sources, it helps stabilize the power grid. The intermittent nature of renewable energy can be managed by smart charging systems that can adjust charging rates based on the availability of renewable energy, reducing grid stress and balancing electricity supply and demand.
-
Efficient battery management is crucial for optimizing the operation of charging stations. The proposed model facilitates the effective utilization of battery resources by optimizing the charging and discharging functions at charging stations. It considers factors such as station capacity, battery state monitoring, grid integration, energy pricing, and battery health to ensure the efficient utilization of resources, support grid stability, minimize operational costs, and promote the longevity of batteries.
-
The model considers bidding prices for electricity markets to make informed procurement decisions regarding the purchase of electricity for charging operations. By considering market prices, the model aims to optimize the cost-effectiveness of EV charging while ensuring reliable and sustainable energy supply.
By generating these outputs, the proposed model aims to contribute to the optimization and improvement of EV charging operations. This, in turn, promotes the adoption of electric vehicles, fosters the transition to a sustainable transportation system, and helps overcome the challenges associated with the integration of EVs into the existing infrastructure.
Optimal integration model for electric charging stations
In this section, we present an optimization model for electric vehicle charging stations that takes into account renewable energy sources such as photovoltaic (PV) cells and wind turbines. Then, we explore incorporating these renewable energy sources into the proposed model, allowing for a more sustainable and efficient charging infrastructure for electric vehicles. Integrating an optimization model that combines charging and routing plans with the electricity market can indeed help minimize social costs for both users and charging providers. This integrated model can effectively optimize charging and routing plans by considering various factors such as vehicle range, charging infrastructure availability, electricity prices, and user preferences, leading to cost savings and improved efficiency. The model incorporates several factors associated with the value of time, such as travel cost, setup time at the station, and charging duration. By considering these factors, the model provides an accurate assessment of the overall time-related costs involved in charging at a charging station.
The first element of the objective function incorporates the expenditure associated with purchasing electricity from both the day-ahead and intra-day electricity markets. We incorporate scenarios that are generated using probability distributions for bid prices. This approach allows us to explore a range of potential situations that could occur during a bidding process. Rather than relying on a singular fixed bid price, we consider the probabilities associated with different bid prices, thereby taking into account the likelihood of various bid prices arising. The second component denotes the travel time from point O to point D, assuming a consistent speed. The third component of the objective function accounts for the cumulative time spent on setup at each station. The last component corresponds to the duration of charging at the station. The notations used in the proposed framework are provided in Table 1.
Constraints (4) and (5) in this context serve as a condition related to the inclusion of a specific arc (i, j) in the path. When the decision variable xijtkv (representing the inclusion of arc (i, j) in the path) is equal to 1, it means that the arc is indeed included in the path. In this scenario, constraint (4) becomes active and imposes a requirement on the variables ajtkv, aitkv, bitkv, and dij14.
On the other hand, if xijtkv is equal to 0, indicating that the arc (i, j) is not included in the path, constraints (4) and (5) become redundant. In this case, it does not contribute any additional information or place any additional constraints on the variables. It effectively becomes inactive and does not affect the optimization problem14.
Constraints (6), (7), and (8) play a vital role in maintaining the flow balance equation within the transportation network problem. Constraint (6) ensures that the flow of electric vehicles into the set of source nodes (Oleft(kright)) is equal to the flow out of it, while
Constraint (7) extends this requirement to all intermediate nodes, ensuring that the flow into and out of each intermediate node is balanced.
Constraint (8) ensures a similar balance for the set of destination nodes (Dleft(kright)), enabling the network to maintain flow balance and integrity while designating the set (Oleft(kright)) as source nodes, nodes in (Dleft(kright)) as destination nodes, and the remaining nodes as intermediaries. This structural enforcement preserves the network’s functionality and integrity.
Constraint (9) specifies that the charging amount at node i should not exceed the charging capacity (δ) minus the remaining charge level at that node.
Constraint (10) states that the charging amount at node i is the difference between the charging capacity and the charge adjustment at that node. To prevent overcharging beyond the available capacity of the battery, a parameter ritkv is used to calibrate the amount of charge replenished at a site. This is achieved by satisfying the inequality δyitkv − ritkv ≤ δ − aitkv (where bitkv in Constraint (9) is replaced by δyitkv − ritkv in Constraint (10)). Ideally, the desired formula would be δyitkvL ≤ δ − aitkv, where L is a recharging coefficient ranging of 0-1, based on the available capacity of the battery at each stop. The recharging coefficient regulates the amount of charge replenished at a specific site. However, solving this nonlinear equation is currently challenging. Therefore, we introduce a linear formula with an adjustment variable ritkv to approximate the desired behavior18.
Constraint (11) establishes a direct relationship between the inclusion of a node in the path and the possibility of charging at that node. It stipulates that charging at a particular node can occur if and only if that node is included in the travel path14.
Constraint (12) implies that the EV is fully charged at the starting point18.
The bidding curves enable the efficient allocation of electricity resources by facilitating the matching of supply and demand at equilibrium prices. Equation (13) formulates the bidding curve for the day-ahead market. This curve describes the relationship between the bid price and the corresponding quantity of electricity that market participants are willing to supply or demand in the day-ahead market. It helps determine the market clearing price and quantity for the day-ahead market29,30.
Equation (14) formulates the bidding curve for the intra-day market. This curve represents the price-quantity relationship for electricity bids in the intra-day market. It reflects the willingness of market participants to buy or sell electricity at different prices in the intra-day market, allowing the determination of the market clearing price and quantity for intra-day transactions. By formulating these bidding curves, market participants can express their preferences and strategies for buying or selling electricity at different price levels29,30.
Constraint (15) in the day-ahead market ensures that the bidding curve submitted by market participants follows a non-increasing pattern. This means that as the quantity of electricity increases, the corresponding bid prices must decrease or remain the same. This rule helps maintain fairness and efficiency in the day-ahead market by discouraging participants from artificially inflating prices as the quantity increases.
In the intra-day market, Constraint (16) serves a similar purpose but with a slight difference. The bidding curves in the intra-day market are based on the realized scenario from the day-ahead market. This means that the bidding volume in the intra-day market is influenced by the specific conditions and outcomes observed in the day-ahead market. The scenario index is introduced to reflect these conditions and ensure that the bidding curve remains non-increasing within the context of the realized scenario.
Equation (17) is a critical component in maintaining power balance within the sequential markets. It establishes the requirement that the combined power purchased from both the day-ahead and intra-day markets must equal the dedicated power allocation designated for charging electric vehicles and charging the battery. This equation ensures that the total power procured from the markets aligns precisely with the power demand necessary for the specific tasks of electric vehicle charging and battery charging.
Constraint (18) effectively meets the power demand of the charging station by considering both the purchased power and the power discharged from the battery for electric vehicle charging. The equation accounts for the combined power from these sources to ensure that the station’s charging requirements are adequately fulfilled.
where ρe is the energy consumption rate per kilometer, which converts the distance to energy.
The charging equation establishes a relationship between the charge current, ({I}_{its}^{c}) (measured in amperes, A), the charge power, ({Theta }_{its}^{C}), and the state of charge (SOC) of the battery. In this equation, Vi represents the battery voltage, which is a measure of the electrical potential difference across the battery terminals. The term ({eta }_{i}^{C}) denotes the charging efficiency, which accounts for any energy losses that occur during the charging process. Hence, it can be represented as:
By dividing the charge power, ({Theta }_{its}^{C}), by the product of the battery voltage, V, and the charging efficiency, ({eta }_{i}^{C}), the charging equation determines the charge current required to deliver the specified charge power to the battery.
During the discharging process, the battery releases stored energy to power an external load. The discharge current, denoted as ({I}_{its}^{D}), represents the rate at which electrical charge flows out of the battery and is typically measured in amperes (A). This equation shows that the discharge current is equal to the discharge power divided by the product of the battery voltage and the efficiency of the discharge process.
The change in SOC over time can be calculated based on the charge and discharge currents. Equation (21) represents the net charge or discharge during the time interval, divided by the battery capacity. Assuming a small time interval Δt, the change in SOC, ΔSOC, can be expressed as:
To update the State of Charge (SOC) of a battery, the initial SOC is modified based on the change in SOC. The updated SOC (SOCits) is obtained by adding the change in SOC (ΔSOC) to the initial SOC. This calculation helps track the battery’s energy level and reflects any charge or discharge that has occurred. By continuously updating the SOC, it becomes possible to monitor the battery’s remaining capacity, estimate runtime, and optimize charging and discharging strategies.
Maintaining the State of Charge within the recommended range of (SO{C}_{its}^{Min}) to (SO{C}_{its}^{Max}) is essential for optimal battery performance, longevity, and safe operation. (SO{C}_{its}^{Max}) defines the maximum allowable level of charge for a battery, beyond which overcharging may occur, leading to potential damage and safety risks. (SO{C}_{its}^{Min}), on the other hand, represents the minimum acceptable level of charge to avoid deep discharge, which can cause irreversible damage and loss of capacity.
Constraints (24) and (25) sets the nonnegativity and the binary condition of the variables.
Modeling of wind turbine
To model wind turbines in charging stations for electric vehicles, it is necessary to comprehend the principles of wind energy conversion and its connection to power generation. A widely employed mathematical model for this purpose is the power curve model. This model establishes a relationship between the wind speed and the power output of the turbine. The power output (({Theta }_{it}^{W})) of a wind turbine can be represented using the following equation40,41:
where ρit represents the air density, Ai is the swept area of the rotor, ({C}_{i}^{p}) is the power coefficient that quantifies the turbine’s efficiency, and ({V}_{it}^{w}) denotes the wind speed. By employing this equation, one can determine the wind turbine’s power output based on the prevailing wind conditions.
Modeling of PV array
To model photovoltaic (PV) arrays in charging stations for electric vehicles, it is essential to utilize mathematical representations that accurately capture the conversion of solar energy into electrical power. One prevalent approach involves employing the single-diode model, which effectively describes the current voltage (I-V) characteristics of the PV array. The single-diode model represents the I-V relationship of a PV module or array using the following equation41,42:
The mathematical model for a photovoltaic cell involves several parameters that describe its electrical behavior. In this model, the cell’s output current (({I}_{it}^{S})) is related to its output voltage (({V}_{it}^{s})) through various factors. These factors include the photocurrent generated by the cell under illumination (({I}_{it}^{ph})), the reverse saturation current (or dark current) of the cell (({I}_{it}^{0})), the series resistance of the cell (({R}_{it}^{s})), the diode ideality factor (n), and the thermal voltage (({V}_{it}^{th})). The thermal voltage is calculated as the product of Boltzmann’s constant (Bk), the temperature in Kelvin (Ts), and the elementary charge (q). Additionally, the model accounts for the shunt resistance of the cell (({R}_{it}^{sh})). Together, these parameters provide insights into the electrical characteristics and performance of the photovoltaic cell.
The power (({Theta }_{it}^{S})) generated by a photovoltaic (PV) cell can be calculated by multiplying the current (({I}_{it}^{S})) generated by the cell with the voltage (({V}_{it}^{S})) across its terminals. Mathematically, it can be expressed as:
To incorporate renewable energy sources, specifically solar and wind, for charging stations, we modify Equation (17). Other formulations remain unchanged. The updated equation now reflects the contribution of solar and wind energy to power the charging stations. The equation is as follows:
In equation (29), the left-hand side represents the combined power purchased from both the day-ahead (DA) and intra-day (ID) markets, as well as the renewable energy provided by solar (S) and wind (W). The right-hand side represents the dedicated power allocation designated for charging electric vehicles (V) and charging the battery (C). This equation ensures that the total power procured from the markets aligns precisely with the power demand necessary for the specific tasks of electric vehicle charging and battery charging.
Findings and Analysis
This paper presents two examples that demonstrate the application of an integrated model for optimal charging, routing, and grid-aware operations in the context of EV charging. The first example focuses on a transportation network with seven nodes. It considers two charging stations located at nodes 3 and 5, which rely solely on the electricity grid for charging operations. The nodes within the network represent various locations, such as residential areas, workplaces, and charging stations. EVs travel between these nodes to complete their trips. The model optimizes the charging, routing, and grid-aware operations to ensure efficient EV charging within the network. The second example involves a transportation network consisting of 25 nodes. Simulation tests were conducted to evaluate the effectiveness of the proposed model. Two strategically placed charging stations within the network, located at nodes 5 and 12, accommodate the growing demand for EVs. These stations consider both the electricity grid and renewable energy sources, such as solar panels and wind turbines, to provide sustainable charging options. Both examples highlight the versatility and effectiveness of the integrated model in addressing the challenges of EV charging, including optimal power allocation, renewable energy integration, and grid-aware operations.
The model was implemented in Julia 1.7.1 programming language. To solve the optimization model, we utilized the Jump package43 in Julia. Additionally, we leveraged the CPLEX software for the optimization process. The CPLEX software, which was utilized in solving the optimization model, is based on the Branch-and-Bound (B&B) algorithm for Mixed Integer Programming (MIP) problems. The proposed model was solved on a laptop computer with the following specifications: a 2.50 GHz processor, 12 GB of RAM, Intel Core i7-2450, and a 64-bit Windows 10 Professional operating system.
An illustration example
In this numerical example, we have a transportation network consisting of seven nodes. The specific layout of this network can be observed in Fig. 4. We consider two charging stations located at node 3 and node 5, which utilize the electricity grid for charging operations. The seven nodes represent different locations within the transportation network where EVs travel between. The network displays the distances between nodes measured in kilometers. Each node represents a specific point or destination within the network. EVs in this network travel between these nodes to complete their trips. The network includes two origin nodes, node 1 and node 2, marked as O = [2, 1]. These nodes represent residential areas or starting points for EV trips. Conversely, node 6 and node 7 are designated as destination nodes, indicated by D = [7, 6]. These nodes represent the desired endpoints for the EV journeys. We consider a total of 10 electric vehicles for each OD demand in this example. The charging stations located at node 3 and node 5 rely on the electricity grid to cater to the charging needs of the EVs within the network. Let’s consider the following example with the given parameters: uit = 30 min/stop, πit = 2 min/km, and v = 1 km/min. Other parameters that will be made publicly available at https://github.com/homase2003/ElectricChargingStations. In this paper, we present a simplified version of the model where we assume a constant travel time. However, the model can be enhanced by incorporating the Bureau of Public Roads (BPR) function. The BPR function allows for a more accurate representation of travel time by considering factors such as traffic congestion and road conditions.
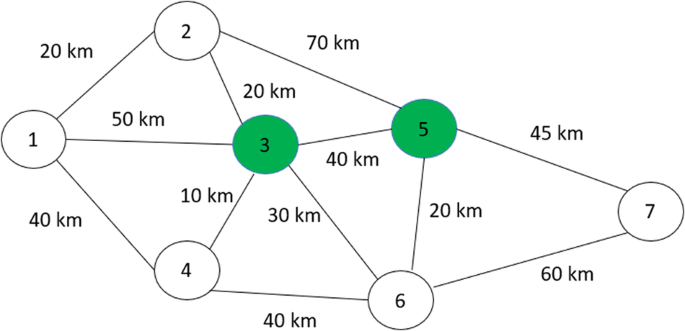
Seven-node test road network.
Charging stations play a crucial role in providing the necessary charging infrastructure to support the operation of EVs in the transportation network. The example focuses on these two charging stations to analyze the power energy needed for charging the EVs traveling between the nodes. Charging station 1 is located at node 3, while charging station 2 is located at node 5. The charging requirements of the EVs at each OD demand are determined in this model, and the calculations are performed based on this information. We assume that the vehicle can travel up to 60 kilometers, δ = 60 km, on a full charge before requiring a recharge. The battery capacity of electric vehicles plays a significant role in route planning and necessitates strategic placement of charging stations within the network to accommodate the range limitations of the vehicles effectively. The average EV consumes 0.20 kilowatt-hours (kWh) per kilometer44. We also consider five scenarios in which the probability of each scenario is 0.2. We solve this example using these scenarios.
The results of solving the model provide specific routes for each origin-destination pair, indicating the sequence of nodes the EVs should follow. Additionally, the solutions identify the charging stations where the EVs need to stop to recharge their batteries. The optimal charging plans specify the required amount of energy or distance to charge at each station, ensuring that the EVs have enough energy to complete their journeys. The routing and charging plan for EVs in the transportation network aims to optimize their routes and ensure they have sufficient energy to reach their destinations. Table 2 presents the outcomes of our model for two specific origin-destination (OD) pairs involving EVs, along with comprehensive information on their routing and charging specifics. The table represents two specific origin-destination (OD) pairs, OD1 and OD2. For OD1, the EVs start at node 2 and their destination is node 7. They follow the route 2 → 3 → 5 → 7. To charge, they stop at charging station 5, which is strategically positioned along their route, and charge 45 km. For OD2, the EVs start at node 1 and their destination is node 6. They follow the route 1 → 2 → 3 → 6. To charge, they stop at charging station 3 and charge 10 km, which is then converted into the corresponding travelable distance.
This example also investigates the available battery capacities, initial state of charge, and charge efficiency of the charging stations to determine how much power energy they need to obtain to fulfill the allocated charge requirements. The integration of the state of charge (SOC) of batteries at the charging station, along with the inclusion of bidding prices for electricity, brings valuable contributions to charging efficiency and cost-effectiveness. Monitoring the state of charge is important for managing battery usage, estimating range or runtime, and determining when to recharge or replace the battery. It helps users understand how much energy is available and plan their usage accordingly. Figures 5 and 6 show the state of charge (SOC) of a battery which refers to the amount of energy stored in the battery at a given time, usually expressed as a percentage of its total capacity. It indicates how much charge is remaining in the battery.
The state of charge of a battery at charging station 3 within 24 h.
The state of charge of battery at charging station 5 within 24 h.
By considering the SOC, the model enables optimal charging prioritization, efficient resource allocation, accurate charging time estimation, and improved charging station efficiency. Moreover, the inclusion of bidding prices allows the EV battery to store electricity during low-price periods and utilize it efficiently during high peak-price periods. This integrated approach not only reduces charging costs for EV owners but also contributes to overall grid stability by shifting the charging load to times when electricity prices are lower. The model’s consideration of both SOC and bidding prices provides an effective solution that optimizes charging operations, enhances cost-effectiveness, and supports grid management.
In the context of electricity markets, charging stations that require power to charge electric vehicles participate as buyers in the market. They submit bids indicating the price they are willing to pay for a certain volume of electricity during specific hours. Bidding curves visually represent these bids and show the relationship between the price and the corresponding volume of power the charging station intends to purchase. Bidding curves for two selected hours from a 24-hour analysis are presented in Figs. 7 and 8. These figures illustrate the variation in bidding patterns during different hours for charging stations 3 and 5, respectively. When prices are low, the charging station tends to buy larger volumes of power. Prices are presented in cents per kilowatt hour (kWh). This strategy allows the station to take advantage of the lower-priced electricity available in the market and meet the charging demands of electric vehicles efficiently. By purchasing more power at lower prices, the station can accommodate a higher number of charging sessions without significantly increasing its costs. Conversely, as the prices increase, the charging station’s purchases decrease. This behavior reflects the station’s attempt to manage costs by reducing its power purchases when prices are higher. By limiting power procurement during periods of higher prices, the station aims to optimize its operational expenses and maintain a favorable cost structure.
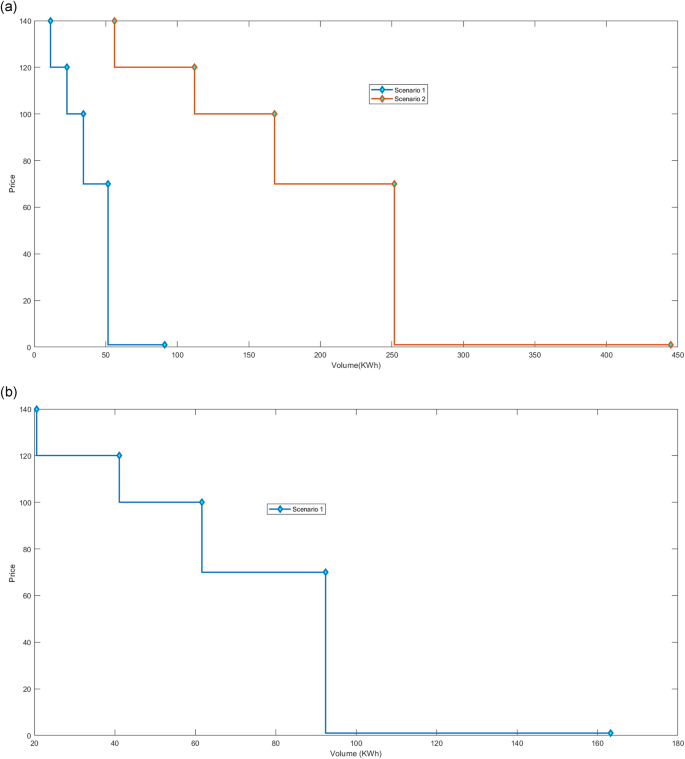
a Hour 3. b Hour 17.
a Hour 3. b Hour 4.
The bidding curves provide valuable insights into the charging station’s decision-making process and its response to fluctuating electricity prices. It illustrates the station’s strategy of adjusting its power purchases based on price signals, aligning its buying behavior with market conditions. Such flexibility allows the station to optimize its operations, manage costs, and make efficient use of available electricity resources. Understanding the bidding patterns of charging stations is crucial for market participants, regulators, and system operators as it helps them analyze and forecast electricity demand, assess market dynamics, and make informed decisions regarding supply and pricing. By studying the bidding curves, stakeholders can gain insights into the behavior of charging stations and develop strategies to promote efficient and sustainable electricity markets in the context of electric vehicle charging.
25-node test network
Numerical tests were performed on a 25-node test road network45. The specific layout of this network can be observed in Fig. 9. In our consideration, 125 electric vehicles make trips between OD nodes. Two charging stations have been strategically placed within the network to accommodate the growing demand for electric vehicles. These stations consider both the electricity grid and renewable energy sources such as solar panels and wind turbines to provide sustainable charging options. The charging stations are located at nodes 5 and 12. We assume that the EV can travel up to 100 kilometers on a single charge before requiring a recharge. The origin-destination (OD) demands and scenarios are randomly generated. We have generated additional parameters randomly, and these will be publicly available for access in the following URL: https://github.com/homase2003/ElectricChargingStations. Other input parameters required to solve the proposed model are presented in Table 3.

Twenty-five-node test road network.
We explore two cases using the given network. In the first case, where renewable energy is considered as input parameters, it means that we use information about renewable energy sources as inputs to a network or model. The purpose of using these inputs could be to analyze or predict the availability or output of renewable energy sources, or to optimize the utilization of renewable energy in certain applications.
In the second case, where renewable powers are considered as decision variables for charging stations, it implies that we apply renewable energy generation as a factor in determining the operation or behavior of charging stations. This could involve designing charging station systems that take into account the availability of renewable energy sources when deciding how and when to charge electric vehicles. The goal here is to maximize the use of renewable energy for charging stations and minimize reliance on non-renewable energy sources.
Case 1
The proposed model for charging stations of electric vehicles integrates the power grid with renewable energy sources such as wind power and solar power. In this case, wind power and solar power are defined as input parameters, which are determined by Equations (27) to (29) that consider factors such as wind speed, solar radiation levels, and the efficiency of wind turbines and solar cells. One important factor considered during the optimization process is the availability of wind power and solar power. The model assesses the potential of wind power and solar radiation levels in the region where the charging station is situated. This information helps determine the capacity of renewable energy generation from wind turbines and solar cells. By accurately estimating the renewable energy potential, the model can optimize the energy production to meet the charging requirements of electric vehicles. This model also considers grid electricity prices. By comparing the cost of electricity from the grid with the cost of producing renewable energy, the model can make informed decisions about the optimal energy mix. This helps charging stations balance the economic factors of renewable energy production and grid electricity usage, ensuring cost-effective operations while promoting sustainability.
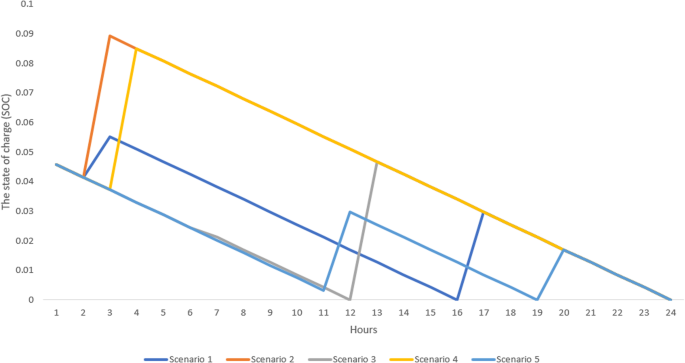
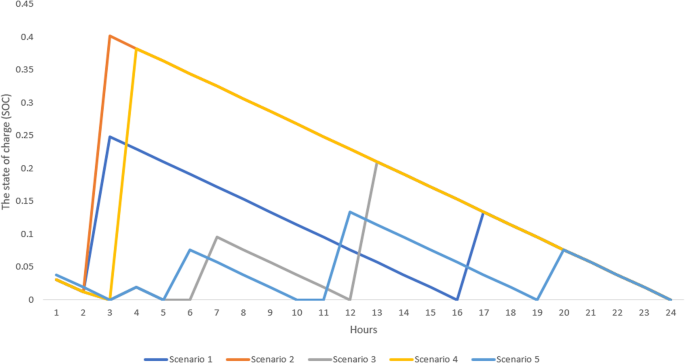
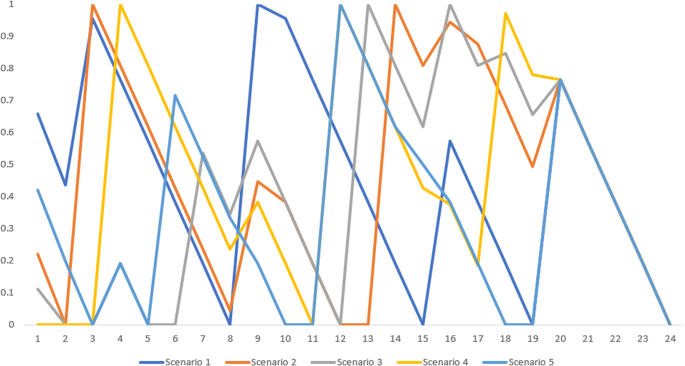
Energy storage systems can store excess renewable energy during periods of high generation and release it during periods of high demand. This helps balance the supply and demand dynamics of the grid, ensuring a stable and reliable power supply to charging stations. Figure 10 illustrates the state of charge (SOC) of the battery at charging station 5 over a 24-hour period. The data in the figure allows us to observe various charging scenarios and patterns. In scenario 1 exhibits a gradual decrease in SOC values over time, with intermittent charging and discharging cycles. In Scenario 2, the SOC values start low but increase gradually, accompanied by intermittent periods of zero SOC and rapid increases. Scenario 3 demonstrates consistently low SOC values with intermittent charging events. Scenario 4 shows a quick initial charge to full capacity, followed by gradual discharge and intermittent periods of zero SOC. Lastly, Scenario 5 displays moderate fluctuations in SOC values, with intermittent charging and discharging cycles.
The state of charge of battery at charging station 5 within 24 h.
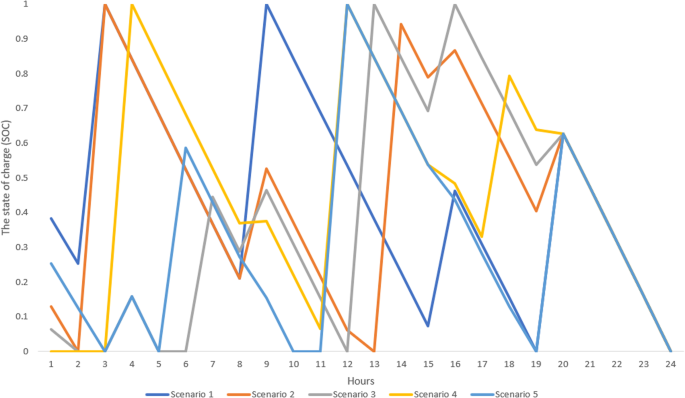
Figure 11 illustrates the State of Charge (SOC) of the battery at charging station 12 over a 24-hour duration. This visualization provides valuable insights into various charging scenarios and patterns that occurred during this period. By analyzing the information presented in the figure, we can identify and examine the distinct characteristics of each scenario. In the first scenario, the SOC values start at relatively high levels and gradually decrease over time. This pattern is accompanied by intermittent charging and discharging cycles, indicating a dynamic utilization of the battery’s energy. The second scenario showcases SOC values starting at low levels and gradually increasing. Intermittent periods of zero SOC are observed, followed by rapid increases in SOC. This pattern suggests a progressive charging process with intermittent high-demand periods. The third scenario demonstrates a combination of zero SOC points and charging events. It signifies instances where the battery’s charge is completely depleted and subsequently replenished. In the fourth scenario, there is an initial rapid charge to full capacity, followed by a gradual discharge. Intermittent periods of zero SOC are also observed in this scenario, reflecting intermittent utilization of the battery’s stored energy. The fifth scenario exhibits fluctuations in SOC values, accompanied by intermittent charging and discharging cycles. This pattern indicates a dynamic usage of the battery’s energy reserves. By analyzing and interpreting these different charging scenarios and patterns, valuable insights can be gained regarding the battery’s behavior and usage patterns.
The state of charge of battery at charging station 12 within 24 h.
Power allocation at charging stations refers to distributing and managing the available electrical power among the charging stations for EVs. Charging stations typically have a limited capacity of electrical power that can be delivered simultaneously to multiple vehicles. Efficient power allocation at charging stations is crucial for supporting the growing number of electric vehicles on the road and ensuring a reliable and convenient charging experience for EV owners. It helps prevent overloading of the electrical grid, optimizes energy consumption, and enables the integration of renewable energy sources into the charging infrastructure.
Visual representations of the electricity dispatching for charging electric vehicles and charging batteries at different charging stations are provided in Figs. 12 and 13. Figure 12 illustrates the electricity dispatching for charging electric vehicles at Station 5, while Fig. 13 showcases the dispatching process at Station 12. These findings illustrate how electricity usage is distributed across the stations, offering insights into allocation patterns and potentially highlighting variations in electricity consumption among the charging stations. The results indicate that charging stations prioritize non-renewable energy sources for battery charging due to concerns about bid prices and the necessity of storing power for future use. However, when renewable energy is incorporated, it enhances power grid stability, enabling charging stations to optimize battery charging while lowering costs. By harnessing renewable energy, charging stations can benefit from a dependable and sustainable energy supply, resulting in efficient battery charging and potential cost savings. This highlights the advantages of integrating renewable energy into charging infrastructure, as it not only promotes grid stability but also facilitates cost optimization for charging station operators.
a Power allocation for charging electric vehicles at charging station 5. b Power allocation for charging the battery at charging station 5.
a Power allocation for charging electric vehicles at charging station 12. b Power allocation for charging the battery at charging station 12.
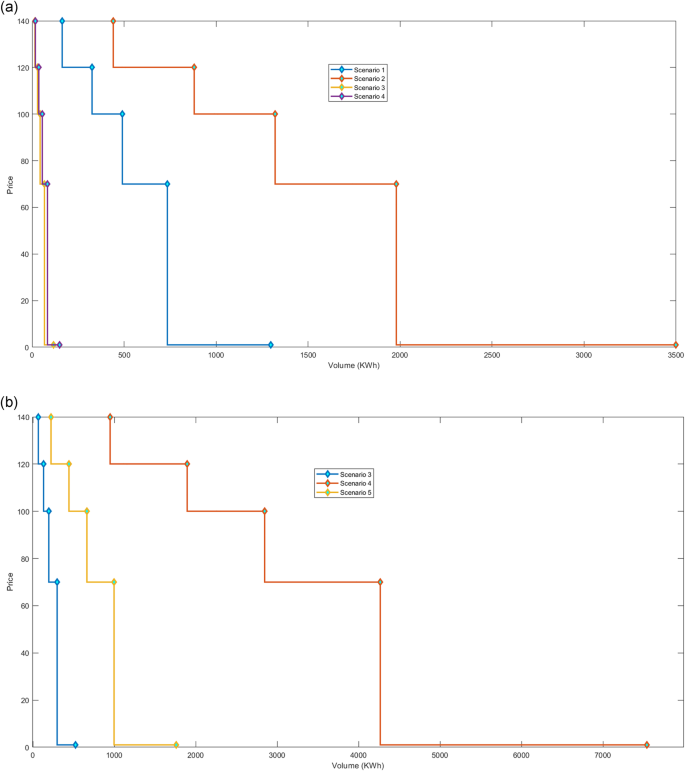
Figure 14 illustrates the bidding curves for selected hours of each charging station within a 24-hour period analysis. Bidding curves play a crucial role in the electricity market, allowing charging stations to strategically bid for power supply based on prevailing market conditions. In the day-ahead market, where electricity is traded a day in advance, bidding curves are considered first-stage variables. These curves represent the charging station’s anticipated power purchase behavior and are independent of specific scenarios. Prices are presented in cents per kilowatt hour (kWh).
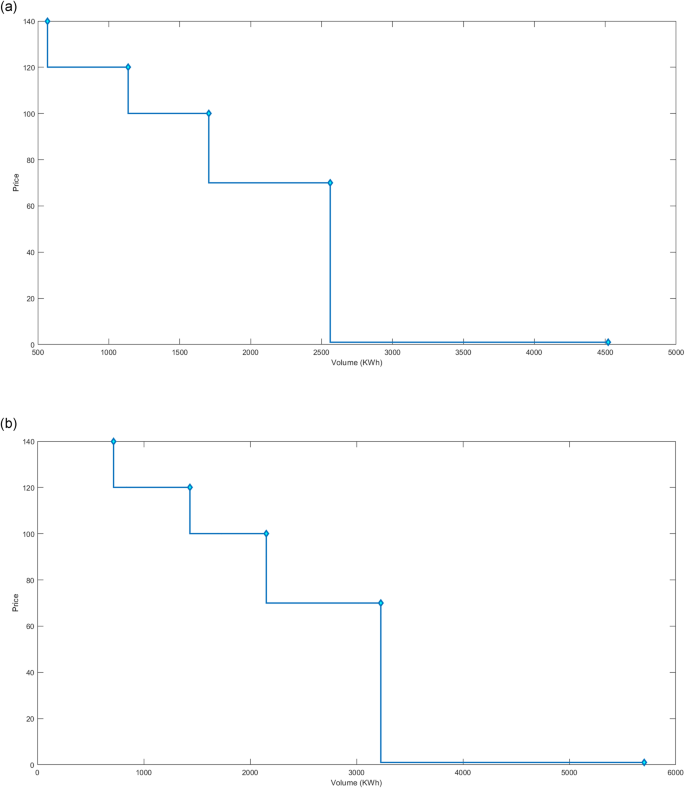
a Charging station 5: Hour 9. b Charging station 12: Hour 9.
However, the intra-day market operates closer to real-time, allowing market participants to adjust their power purchase decisions based on actual conditions. In this market, bidding curves become second-stage variables that depend on the realized scenario from the day-ahead market. The charging stations submit different bidding curves to the intra-day market based on the specific scenario that materialized. This allows them to adapt their bidding strategies to the current market situation and optimize their power purchases accordingly. Figure 15 illustrates the differences in bidding curves for various hours of the day. It visually represents how charging stations adjust their bids in response to changing market prices. The curves show that the stations aim to procure more power during hours when prices are low, indicating a cost-conscious approach. As the prices increase, the stations decrease their power purchases, possibly to minimize expenses or align with their operational costs. Prices are presented in cents per kilowatt hour (kWh).
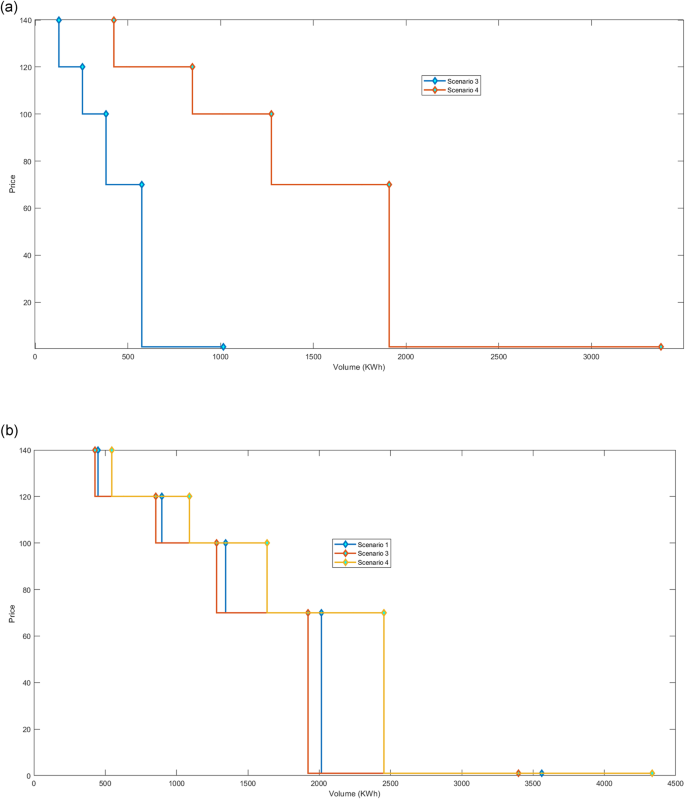
a Charging station 5: Hour 2. b Charging station 12: Hour 3.
Case 2
In this case, the model considers both wind power and solar power as variables in determining the optimal amount of renewable energy required. One of the main objectives of the model is to find the optimal amount of renewable energy that charging stations should generate to meet the demands of their customers. By accurately determining the optimal energy requirement, charging stations can effectively plan their renewable energy production and ensure they have sufficient capacity to meet the charging needs of electric vehicles. Furthermore, the model also assists charging stations in designing their equipment by considering the optimal number of wind turbines and solar cells needed. These design decisions are based on the identified optimal energy requirement and consider factors such as the rated capacity of the turbines and cells. By optimizing the equipment design, charging stations can efficiently harness wind power and solar power to generate the necessary renewable energy for charging electric vehicles.
In this scenario, the total power required for charging the battery at the stations is satisfied solely by the power provided by renewable energy sources. The State of Charge (SOC) results for the battery being charged at the stations are shown in Fig. 16. The reported SOC results provide information on the battery’s charging progress and its current energy level. This allows for monitoring and analysis of the charging process, ensuring that the battery is adequately charged while utilizing renewable energy sources exclusively. As a consequence, the total power demand required for charging the battery at the stations is entirely met by renewable sources, resulting in the SOC reaching 100% by the end of the day. However, it is worth noting that in case 2, the model incorporates renewable energy sources without considering the cost of power from these sources. Exploring the cost implications of renewable energy can provide valuable insights for future studies.
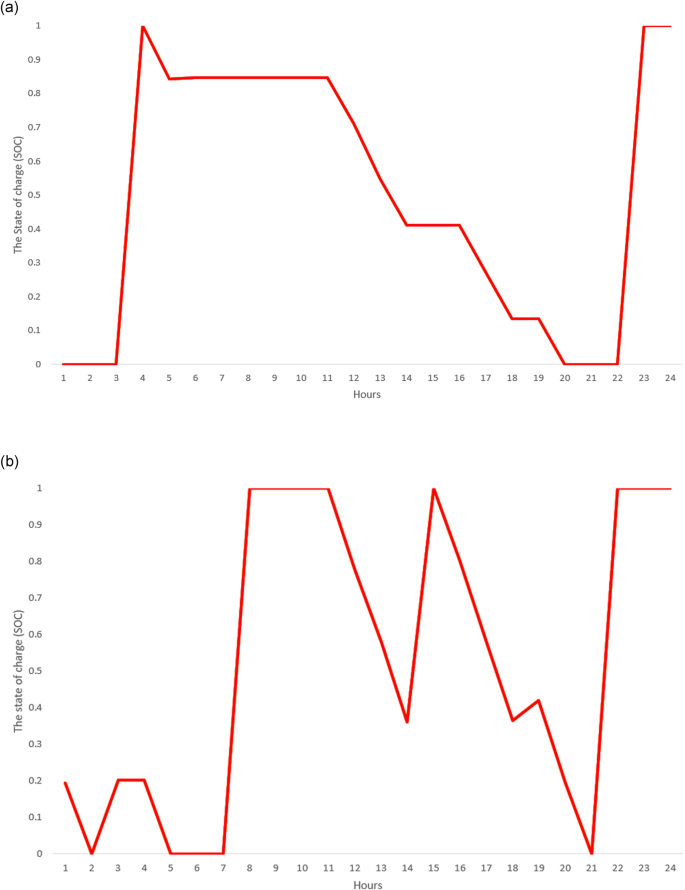
a Charging station 5. b Charging station 12.
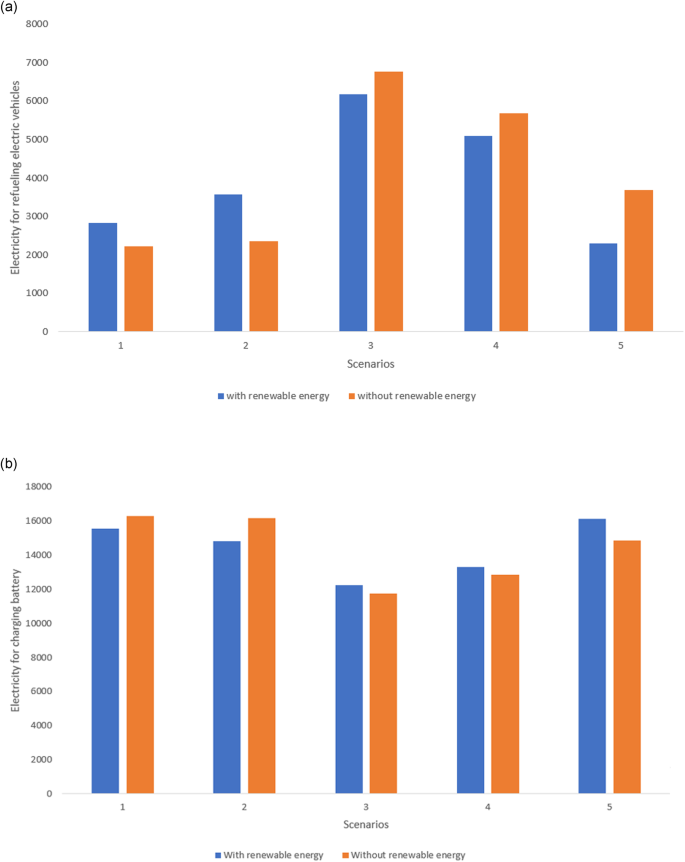
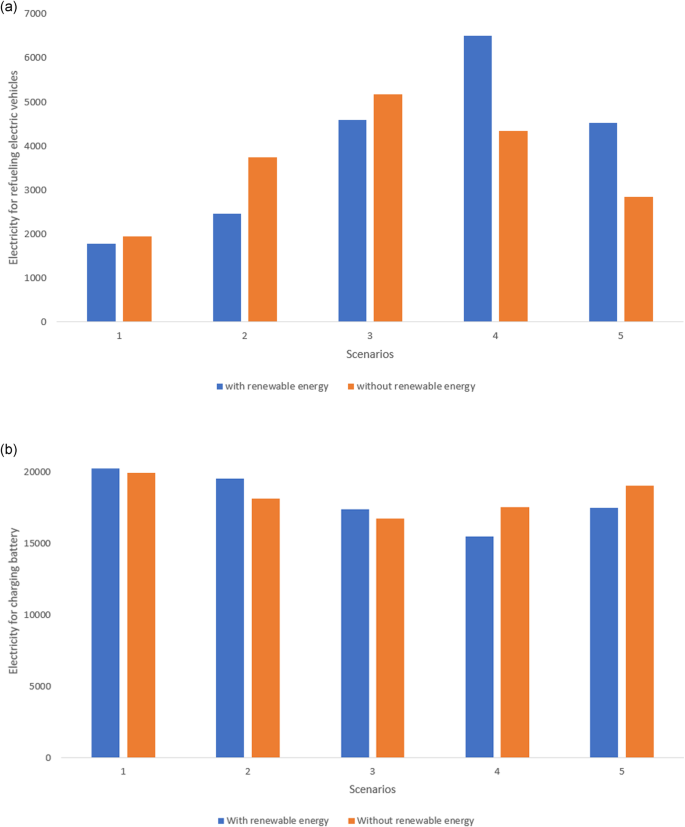
The transition to sustainable energy systems has sparked significant interest in integrating renewable energy sources into electric vehicle charging infrastructure. In this section, we delve into the process of determining the total electricity required to charge batteries and vehicles within a day, with a specific emphasis on leveraging renewable energy sources at charging stations. Figure 17 illustrates the total power allocation at charging stations across various scenarios. Utilizing renewable energy sources, our findings reveal notable reductions in electricity demand for charging batteries at specific charging stations. Charging station 5 experiences a substantial decrease of up to 42%, while charging station 12 sees a more modest reduction of 3%. Furthermore, the integration of renewable energy sources at the charging station resulted in a cost reduction of approximately 69% compared to the scenario without renewable energy, showcasing the significant financial benefits of utilizing sustainable power. Therefore, integrating renewable energy sources into electric vehicle charging infrastructure brings significant advantages, such as reducing reliance on non-renewable energy and contributing to sector-wide decarbonization. Furthermore, by strategically aligning charging sessions with periods of high renewable energy generation, we can optimize the use of renewable sources, minimizing the need for energy storage or grid reliance. The observed reductions in electricity demand for charging batteries underscore the potential of renewable energy integration in advancing sustainable transportation practices.
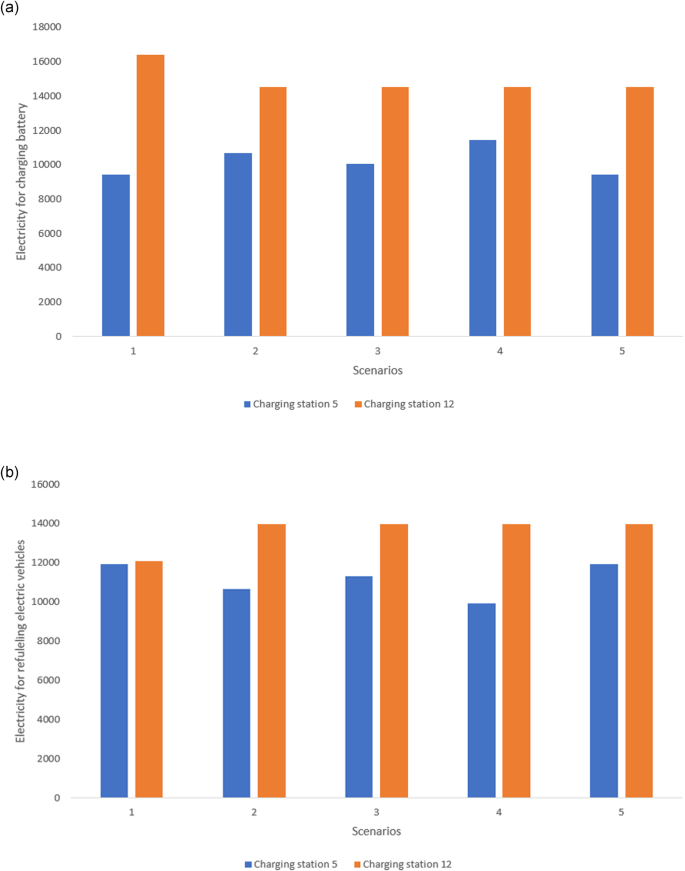
a Electricity for charging battery. b Electricity for charging electric vehicles.


Responses