Optimizing cover cropping application for sustainable crop production
Introduction
The growing demand for food to sustain an increasing global population will lead to significant environmental costs unless more sustainable agricultural practices are adopted1. Over the past decade, conservation agriculture has gained considerable attention as a strategy for sustainable intensification2,3. Cover crops (CCs), the non-cash crops grown between the harvest and the next planting of main crops, are considered a key component of conservation agriculture4. Replacing bare fallow periods with CCs offers multiple benefits for soil health such as suppressing weeds, reducing soil erosion, and improving biodiversity5,6. However, the specific impacts of CCs vary depending on field management, climatic zones, and soil properties7. Therefore, despite strong recommendations from government and private organizations, and significant funding such as over USD$155 million dollars budgeted by USDA’s Environmental Quality Incentives Program in 2018 alone for the promotion of CCs8—to grow or not to grow CCs remains a confusing question for many farmers around the world due to concerns about yield loss and uncertain environmental benefits9,10.
The choice between legume and non-legume CC is crucial, as it directly affects the ecosystem services provided by CCs11. Legume CCs are able to biologically fix nitrogen (N), and thus to provide additional N inputs for subsequent main crops12. While non-legume CCs can better capture surplus N after the main crop harvest13. Some studies found that non-legume CCs commonly produce more biomass than N-fixing legume CCs due to the energy cost of N-fixation in legumes14. In addition, because of the higher C:N ratio in non-legumes, the residues of non-legume CCs decompose more slowly than those of legume CCs15. As a result, non-legume CCs could be expected to enhance soil organic carbon (SOC) to a greater extent. However, other studies found that legume CCs provide the organic N required to stabilize an additional amount of SOC. This supplied N can help increase biomass production of the subsequent crops, leading to greater carbon inputs and showing a greater potential to increase SOC than non-legume CCs16,17. At the same time, the CC inputs directly affect the mineralization of native SOC by priming effects18. Therefore, there is considerable uncertainty over the comparative effectiveness of legume and non-legume CCs in enhancing SOC. Quantifying the type-specific SOC benefits from legume and non-legume CCs is needed to improve SOC sequestration estimates19.
The influence of CCs on SOC can affect nitrous oxide (N2O) emissions, as the C and N biogeochemical cycles are closely coupled in cropland ecosystems20. A low C:N ratio of CC residues can increase the availability of soil N for nitrification and denitrification, whereas a high ratio may result in N immobilization21. Consequently, N2O emissions are generally negatively correlated with the C:N ratio of CC residues, increasing in the presence of legume CCs and decreasing with non-legume CCs22. However, when considering the CC growth period and the main crop growing season separately, results have been inconsistent, showing either increased or decreased N2O emissions compared to no CC23,24. Therefore, the effects of legume and non-legume CCs on N2O emissions are not yet fully understood and may be highly site-specific. Accurate quantification is critical to avoid overestimating the climate change mitigation benefits of CCs by neglecting additional N2O emissions20.
Whether farmers adopt cover cropping hinges on more than its potential for climate change mitigation or improving soil health. A primary concern lies in understanding to what extent the yields of main crops are affected by CCs4,25. A review by Daryanto, et al.11 reported increases in main crop yield of 27% under legume CCs and 6% under non-legume CCs. In contrast, Abdalla et al.26 found that both legume and non-legume CCs decreased main crop yield by 4%, although this drawback could be avoided by using mixed legume/non-legume CCs which increased yield by 13%. Another meta-analysis reported opposite effects of legume CCs (+16%) and non-legume CCs (−7%) on main crop yield in Mediterranean climates6. Evidence shows that the exact impacts of CCs on yield are context-dependent9,27,28. For example, negative effects on yield could be as high as 20% in water-limited situations where CCs compete with main crops for soil water25. However, the interactive impacts of CCs with site conditions and management practices on main crop yield remain poorly understood, raising many questions about the possible consequences of widespread CC adoption.
Previous meta-analyses have often focused on either individual ecosystem services or generalized the effects of cover cropping systems without distinguishing between legume and non-legume CCs. This has left a critical gap in understanding the distinct impacts of these two types of CCs on SOC, yield, and N2O emissions. Unlike prior studies, our meta-analysis provides a global scale, direct comparison of legume and non-legume CCs, addressing key knowledge gaps in their differential contributions to soil health, crop productivity, and climate change mitigation. This distinction is essential for guiding targeted cover crop management practices tailored to specific agronomic and environmental goals. Using a data-driven approach, our objective is to address three key questions: (a) How do the effects of legume and non-legume CCs on SOC, yield, and N2O emissions differ? (b) How do climatic, soil, and management drivers influence the CC effects on SOC, yield, and N2O emissions globally? and (c) When do CCs offer the greatest benefits, and what are the magnitude of those benefits?
Results
Cover crop effects at a global scale
Across all observations, CCs significantly increased SOC by an average of 5.2% (95% CI: 3.5 to 6.8%), main crop yield by 9.1% (5.9 to 12.4%), and N2O emissions by 25.7% (7.4 to 47.0%) (Fig. 1b). Among different CC types, legume CCs significantly increased SOC by 5.9% (3.8 to 8.0%), yield by 16.0% (12.2 to 19.9%), and N2O emissions by 36.2% (15.5 to 60.7%). In contrast, non-legume CCs increased SOC by 4.0% (1.5 to 6.7%) but had no significant effect on yield (p = 0.69) or N2O emissions (p = 0.06).
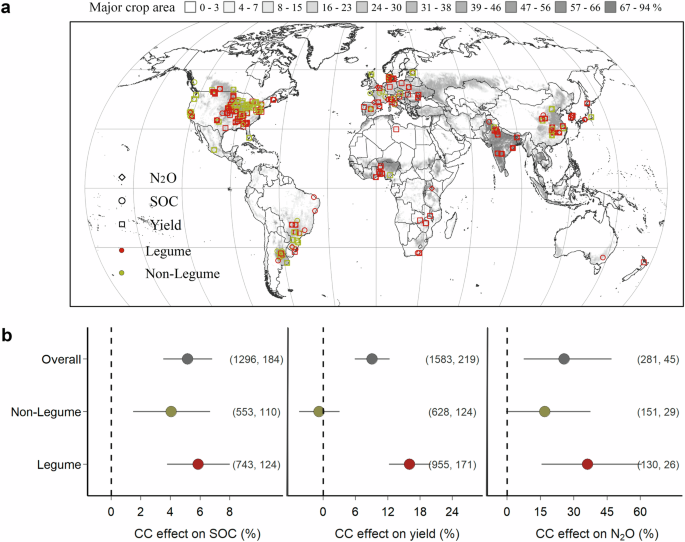
a World map showing the locations of the 271 primary studies included in this study. b Overall effects of legume and non-legume cover crops (CCs) on SOC, yield, and N2O emissions compared to no cover crop. Numbers in parentheses are observations in each grouping, followed by the number of corresponding unique sites. Center dots indicate mean effect sizes, and error bars indicate 95% confidence intervals. The figure is drawn using ArcGIS and R project.
Drivers affecting the cover crop effects
On a regional scale, the effects of both CC types on SOC increased with higher MAT, showing non-significant effects in cool regions to positive impacts in tropical regions (7.7% for legume CCs and 6.0% for non-legume CCs on average) (Fig. 2a). A similar pattern was also found for yield and N2O emissions, for example, the effects of legume CCs on yield increased from 9.8% (4.7 to 15.1%) in cool regions to 28.0% (18.7 to 38.0%) in tropical regions (Fig. 2b). Moreover, both CC types increased SOC significantly in humid regions (5.6% for legume CCs and 4.0% for non-legume CCs), and legume CCs increased yield the most in humid regions (23.0%, 17.1 to 29.2%) compared to arid and semi-arid regions. In Asia, main crop yields significantly increased with legume CCs by 19.8% (11.1% to 29.2%), and non-legume CCs by 9.9% (0.8 to 19.8%). However, in South America, CCs did not significantly affect yield but increased N2O emissions by as much as 118.7% in legume CCs (69.8 to 181.7%) and 112.8% in non-legume CCs (20.9 to 274.8%) (Fig. 2c).
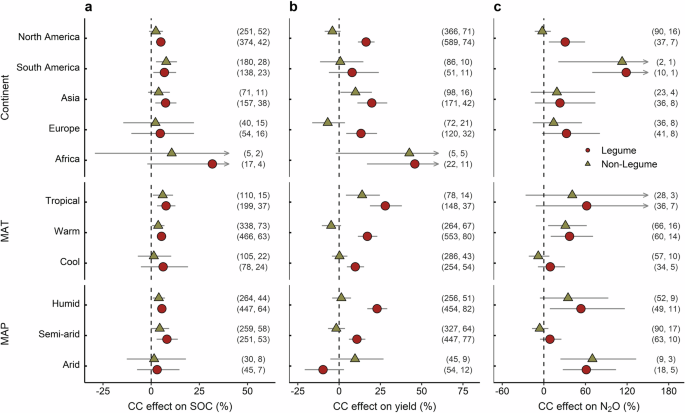
a–c Effects of legume and non-legume CCs on SOC (a), yield (b), and N2O emissions (c) compared to no cover crop. Numbers in parentheses are observations in each grouping, followed by the number of corresponding unique sites. Red circles and yellow triangles represent legume and non-legume CCs respectively. Center dots indicate mean effect sizes, and error bars indicate 95% confidence intervals. No comparison for N2O emissions in Africa due to insufficient observations. The figure is drawn using the R project.
For management practices, SOC increases were negatively associated with crop diversity, with significant SOC increases in continuous cropping systems (7.0% for legume CCs and 4.6% for non-legume CCs), but not in more diversified rotations (Fig. 3a). This pattern was more evident for yield and N2O responses, especially yield responses to legume CCs which ranged from 22.5% (p < 0.001) in continuous cropping to 3.6% (p = 0.21) in rotations with three or more main crop species (Fig. 3b). Interestingly, N fertilizer also influenced yield responses to legume CCs, with yields increasing by 42.5% (31.7 to 54.2%) under no N fertilizer, but by 7.9% (4.2 to 11.6%) with N fertilizer. However, legume CCs also generated more N2O emissions under no N fertilizer (103.3%, 30.7 to 216.3%) than with N fertilizer (25.3%, 6.9 to 46.7%) (Fig. 3c). Moreover, the effects of legume CCs on N2O emissions shifted from positive (46.7%, 16.5 to 84.7%) under no-tillage to non-significant under conventional tillage.
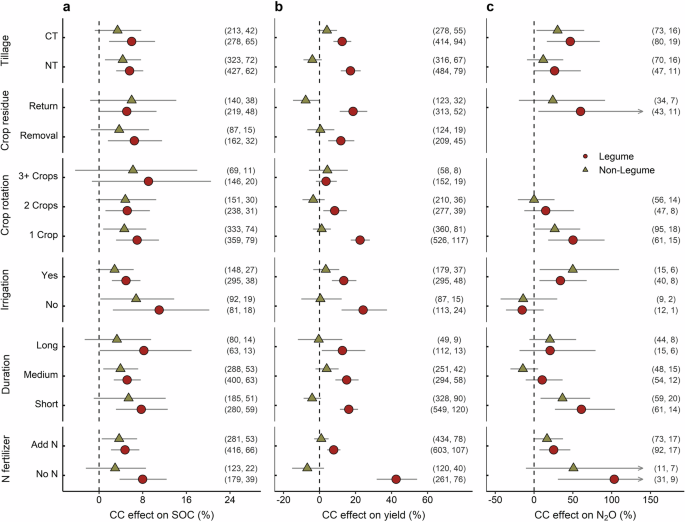
a–c Effects of legume and non-legume CCs on SOC (a), yield (b), and N2O emissions (c) compared to no cover crop. Numbers in parentheses are observations in each grouping, followed by the number of corresponding unique sites. Red circles and yellow triangles represent legume and non-legume CCs respectively. Center dots indicate mean effect sizes, and error bars indicate 95% confidence intervals. No comparison for N2O emissions in residue removal and 3+ crop rotation groups due to the insufficient observations. The figure is drawn using the R project.
Legume CCs increased yield more and generated fewer N2O emissions in soils with low initial SOC, while initial SOC levels did not affect yield and N2O emissions for non-legume CCs. Specifically, yield responses to legume CCs increased from 7.5% (0.6 to 14.8%) with initial SOC greater than 16 g kg−1 to 22.1% (16.3 to 28.2%) with initial SOC below 10 g kg−1 (Fig. 4b). Meanwhile, N2O responses to legume CCs decreased from 58.9% (16.9 to 115.9%) under high initial SOC to 28.2% (1.7 to 61.5%) under low initial SOC (Fig. 4c). In addition, legume CCs increased SOC the most (8.7%, 2.0 to 16.0%) but did not significantly affect N2O emissions in soils with high bulk density (i.e., >1.4 g cm−3). Non-legume CCs were consistently less effective than legume CCs at increasing SOC, yield, and N2O emissions (Fig. 4).
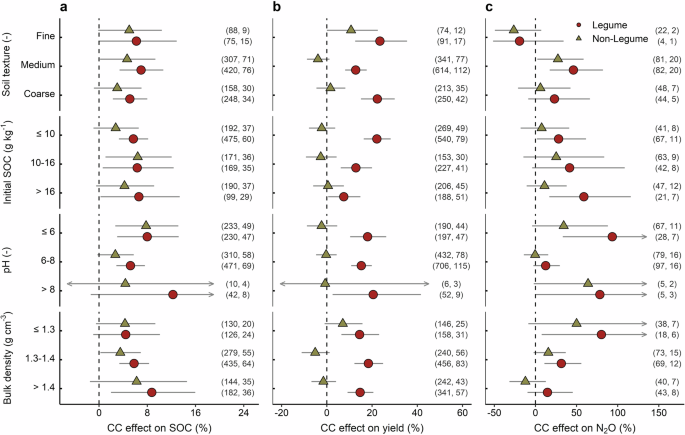
a–c Effects of legume and non-legume CCs on SOC (a), yield (b), and N2O emissions (c) compared to no cover crop. Numbers in parentheses are observations in each grouping, followed by the number of corresponding unique sites. Red circles and yellow triangles represent legume and non-legume CCs respectively. Center dots indicate mean effect sizes, and error bars indicate 95% confidence intervals. The figure is drawn using the R project.
Predictors of cover crop effects and scaling up
Based on the empirical relationships between CC effects and climate, soil, and management predictors, we developed BRT models that could explain 51–73% of the variability in SOC and yield across different sites for both CC types (Fig. 5). Among the 12 predictors considered, MAT was the most important factor in explaining variations in SOC at 0–30 cm soil depth, with importance values of 26% for legume CCs and 21% for non-legume CCs (Fig. 5a, b). N fertilizer emerged as the primary variable determining yield, contributing 23% for legume CCs and 17% for non-legume CCs (Fig. 5d, e). Initial SOC and MAT came second in explaining yield variability for legume CCs (22%) and non-legume CCs (13%), respectively.
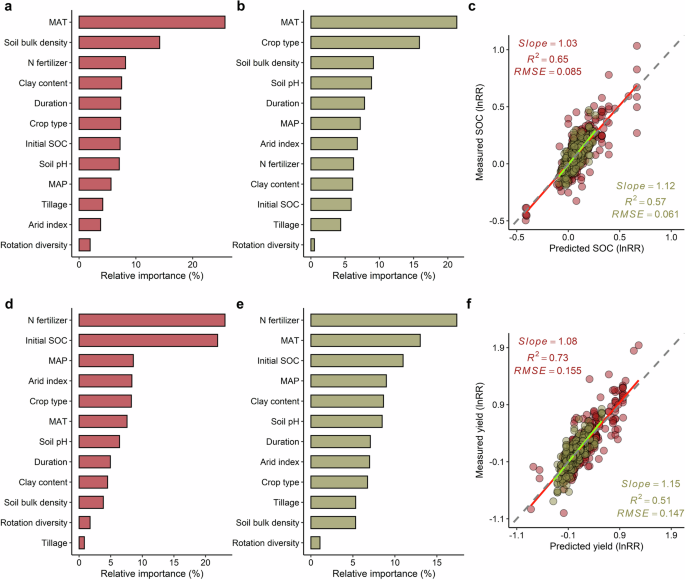
a, b Variable importance for the effects of CCs on SOC at 0–30 cm depth with legume CCs (a) and non-legume CCs (b). d, e Variable importance of the effects of CCs on yield with legume CCs (d) and non-legume CCs (e). c, f The relationship between the model’s predicted and measured response ratios for SOC at 0–30 cm depth (c) and yield (f). The red and yellow lines in c, f represent the fitted function of legume and non-legume CCs, respectively, and the dashed gray line is the 1:1 line. The figure is drawn using the R project.
We used BRT models to predict the potential average effects of CCs over a 3-year adoption period for continuous cereal cropping systems on SOC and yield across global croplands (Fig. 6), along with its associated uncertainties (standard deviations, and the lower and upper limits of 95% CIs) (Supplementary Figs. 1, 2). The results indicated overall mean annual increases in SOC of 7.4% (95% CI: 0.9 to 17.0%) for legume CCs and 5.0% (0.5 to 9.8%) for non-legume CCs. The impacts of CCs on SOC varied considerably with latitude, showing higher values in tropical regions and lower values in the northern and southern high latitudes (Fig. 6a, b). In terms of yield, legume CCs increased cereal yields by an average of 19.8% (4.9 to 39.2%) compared to fallow, with the most significant increases in West and Central Africa, Brazil, and Southeast Asia. Conversely, non-legume CCs decreased crop yields for about half of the global croplands, with an average change of 0.7% (−8.8 to 11.3%) (Fig. 6c, d).
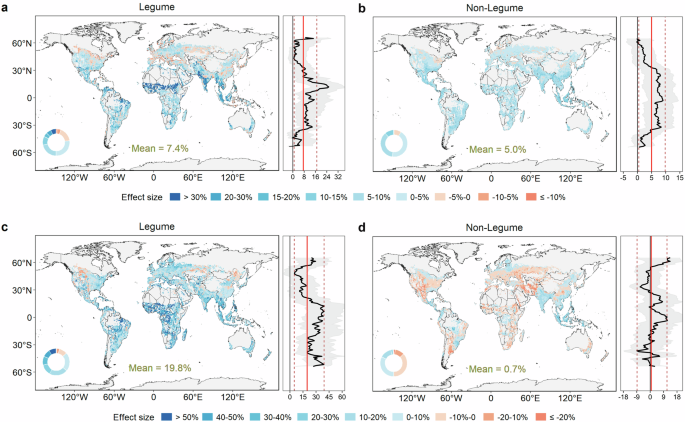
a, b Predicted spatial variation in effects of CCs on SOC at 0–30 cm depth with legume CCs (a) and non-legume CCs (b). c, d Predicted spatial variation in effects of CCs on yield with legume CCs (c) and non-legume CCs (d). Grid-level changes were predicted using BRT models combining a spatial dataset with 12 predictors. Experimental duration, main crop type, and rotation diversity were fixed as three years, cereals, and one (continuous cropping), respectively, and the other nine predictors sourced from datasets at a 0.5° resolution. The black lines and gray shading indicate the predicted values and 95% confidence intervals respectively, with red lines representing the averages. The inset donut plots represent the area proportion of each classified change from the total cropland area. The figure is drawn using the R project.
Discussion
Nitrogen fertilizer emerges as the primary factor driving the effect of CCs on main crop yield (Fig. 5d, e). We identified that including legume CCs results in significant yield advantages under unfertilized conditions, while non-legume CCs showed greater yield improvements with fertilization (Fig. 3b). The main reason for this contrasting relationship (Supplementary Fig. 3) is that higher N fertilizer can fulfill crop demands, thereby negating the N benefits derived from the preceding legume CCs’ N-fixation but stimulating the residue decomposition of non-legume CCs29,30,31. One of the main advantages of non-legume CCs is their ability to immobilize soil surplus N and reduce nitrate leaching13. However, this can also cause N stress for subsequent main crops, making effects more pronounced in fields with higher fertilizer inputs. Moreover, it has been reported that legume nodulation and biological N-fixation are inhibited under high soil mineral N levels32,33. Thus, legume CCs as an N source can increase yield more effectively under low N fertilization34. Furthermore, the yield changes induced by legume CCs depend significantly on the main crop types, with a large yield increase in cereals (e.g., corn, 24.9% with p < 0.001) and a small decline in leguminous crops (e.g., soybean, −6.4% with p = 0.10) (Supplementary Fig. 4), aligning with previous field experimental results35,36.
Notably, greater effects of legume CCs on yield were observed in continuous cropping systems (Fig. 3b). Two possible causes may account for the negative relationship between legume CC effects on yield and crop rotation diversity (i.e., the number of crop species in a rotation). First, the yield advantages of diversified cropping systems, which have been well documented37,38,39, potentially rendered the N addition effects of legume CCs redundant, as noted by Vendig, et al.17. Second, the positive yield response to legume CCs may not solely be attributed to N benefits but also to the break-crop effect, such as disrupting disease and insect cycles in cereal monocultures40. More complex rotations tend to include legumes, with 78.6% of systems in our dataset featuring over three crop species incorporating legumes. Thus, our results highlight that legume CCs can boost cereal yields, especially in farming systems with low N fertilizer input and low crop diversity.
Another major driving factor that regulates yield responses to CCs is initial SOC (Fig. 5d, e). Legume CCs had a stronger impact on main crop yield when initial SOC is below 10 g kg−1 (median value) (Fig. 4b). SOC has long been considered a key soil quality indicator41, being a major constituent of soil organic matter (SOM). Higher SOM levels provide more essential macro- and micro-nutrients, enhancing crop yields42. Ma, et al.43 found that there are threshold levels of SOC beyond which further increases do not provide any additional yield benefit. In soils with low initial SOC, a greater yield increase induced by legume CCs is understandable, as legumes can perform better than non-legumes in infertile conditions44,45. Precipitation also plays an important role in moderating CC effects on crop yield9,46. In drier conditions, soil water consumed by CCs is less likely to be replenished through precipitation, leading to non-significant yield responses when MAP is below 500 mm (Fig. 2b). In contrast, in wetter environments, CCs tend to produce more biomass without competing for soil water with the subsequent main crops, thereby resulting in greater yield increases47. The positive relationship between yield responses and precipitation (Supplementary Fig. 5) is consistent with the findings from Garba et al.27 and He et al.28.
One of the key goals of cover cropping is to build soil carbon and mitigate climate change48. Mean annual temperature is, not surprisingly, the primary predictor of SOC changes for both CC types (Fig. 5a, b), and there is a strong positive relationship between MAT and CC effects on SOC (Supplementary Fig. 5). In humid regions, winter cover crop biomass production can increase with rising temperatures to enhance the carbon inputs to soils49. Another study also reported that CCs increased microbial necromass accumulation for SOC accrual in humid and warm climates50. Improved SOC induced by CCs also has positive repercussions for yield by providing better soil structure and enhanced nutrient retention, suggesting a win-win outcome51. However, co-benefits to SOC and yield are evident only in regions where temperature and precipitation do not limit CC growth and biomass decomposition47. Furthermore, our data show that, contrary to non-legume CCs, the positive effect of legume CCs on yield decreases with increasing background yield levels, with a more pronounced effect at low N fertilizer rates (Supplementary Fig. 6). We, therefore, suggest that considering the constraints for different CC types, such as temperature, water, and fertilizer shown here, will be more beneficial for concurrently achieving SOC accrual and yield advantage52. In this study, while CC effects on SOC are detectable in short-term experiments (<3 years), long-term trials (>10 years) have large variations. Increasing the availability of long-term data is crucial for better understanding CC-induced SOC stabilization18,53.
Although legume CCs generally provide co-benefits in terms of SOC and yield, trade-offs also exist, as legume CCs also increase soil N2O emissions. Significant positive relationships were observed between CC biomass and changes in SOC, yield, and N2O emissions (Supplementary Fig. 7). Some meta-analyses report that legume CCs increase N2O emissions by adding N to the soil, while non-legume CCs decrease N2O emissions by scavenging surplus N22,54. Our data show significant increases in N2O emissions during the main crop growing season for both CC types, while non-growing season and full-year measurements have non-significant N2O changes (Supplementary Fig. 8). This is similar to the results of Basche et al.24, but we additionally provide evidence that no-tillage, no-irrigation, diversified crop rotations, and long-term CC implementation can be used as essential strategies to mitigate the N2O emissions associated with CCs (Fig. 3c). By exposing crop residue surfaces to microorganisms, tillage can enhance aeration and microbial activity, and thus increase residue decomposition22; irrigation events can trigger a pulse in N2O flux due to low oxygen availability, so deficit irrigation is suggested to reduce soil N2O emissions54. To attenuate the increase in N2O emissions, these practices can be combined with CCs application. Nevertheless, N2O emissions generated by legume CCs require careful examination, and more concurrent observations are needed to assess overall net greenhouse gas balances with cover cropping55.
Based on the subgroup analyses, we envisage a scenario with the most responsive combination of management—continuous cereal systems with three-year CC implementation, to investigate the global potential of CCs to increase SOC and yield. Our results suggest that cereal yields have the risk of decreasing under non-legume CCs in nearly half of global cropland (Fig. 6d) but yield gains can be achieved by adding legume CCs, giving an average increase in cereal yield of 19.8% (Fig. 6c). Given the variation in site conditions and management practices, the effects of CCs on yield strongly differ across the continents. For instance, non-legume CCs increased cereal yields in Southeast Asia (e.g., India and Indonesia), where both N fertilization and precipitation are high. Conversely, these crops have decreased yields in most temperate regions, such as the Midwestern United States and Southern Australia. Our estimated mean yield loss of −3.1% in the United States is consistent with the simulation study by Qin, et al.36 which found a yield loss of −3.9%, and the satellite data analysis by Deines, et al.4 which reported a yield loss of −5.5% for maize following non-legume CCs in US Corn Belt.
Regions with lower N fertilizer inputs (e.g., West Africa and Central Africa) benefit especially from planting legume CCs. Enhancing N fertilizer use to an optimal level has been a key priority in sub-Saharan Africa, where nutrient-depleted soils coupled with low levels of N input contribute significantly to persistently low crop yields56,57. However, due to the limited available data, there are larger variations in legume CC effects on yield in Africa (average standard deviation of 14.4%) compared to other continents (average standard deviation of 10.4%) (Supplementary Fig. 2b). Thus, the estimates should be interpreted cautiously, especially considering the extra economic cost and technical overhead of CCs which may pose challenges for local adoption58. In most mid-latitude regions of the northern hemisphere, the increases in yield from legume CCs are below the global average. For example, yield benefits are 15.0% in Europe, 6.2% in China, and 12.2% in North America. These benefits are comparable to the 16% increase reported in California and the Mediterranean6, and the 12% increase reported in China59 in plots that used legumes as CCs. Cereals, especially corn, show significant potential for yield benefits by incorporating legume CCs60,61,62, highlighting an opportunity to benefit both food security and climate.
Further, co-benefits of yield and SOC from legume CCs are apparent in humid tropical regions, varying considerably with latitude (Fig. 6a, c). This pattern can be attributed to the significant positive relationships between yield and SOC with MAT and MAP (Supplementary Fig. 5). The effects of CCs on SOC are consistently higher in the tropical zone between 23.5°N and 23.5°S (mean effect sizes are 13.3% for legume CCs and 7.3% for non-legume CCs), but lower in high latitudes (mean effect sizes close to 0) (Fig. 6a, b). Our findings align with those of Olin et al.63 and Porwollik et al.64, who reported the highest C sequestration potential of CCs in tropical regions using global modeling. However, estimates of surface SOC changes by CCs in humid tropics may be overestimated, as SOM turnover in these environments is very rapid65. Soils in humid tropics are often characterized by high C inputs and fast microbial decomposition and, consequently, are likely to have a limited potential for long-term SOC stabilization66,67. Conversely, the smaller increases in SOC due to CCs in northern temperate climate regions can be attributed to the low temperatures, resulting in slow SOM decomposition and slow N releases throughout the year63,68, which partly explains the smaller (legume CCs) and negative (non-legume CCs) effects on yield in these regions4,27.
Our meta-analysis systematically quantifies the effects of different types of CCs on SOC, yield and N2O emissions, however, there are some unavoidable limitations. First, in under-studied regions like Oceania, we collected only three observations for yield with different CCs. Consequently, not all soil types, climatic zones, and agronomic practices are represented equally, calling for more paired field studies of CCs in the future. Second, only 12.5% of measurements in our dataset span over 10 years, but SOC accumulation is a continuous and slow process69,70. Soil improvement through long-term cover cropping will impact crop yield and N2O emissions, necessitating more long-term observations to capture the legacy effects of CCs. Third, we divided the CC types into two broad categories, legume, and non-legume, but the effectiveness of CCs may vary across species and genera13. Moreover, farmers’ selection of CC species should consider local context, for example, rye is widely used as the winter CC in the United States due to its relatively low seed costs and ability to be sown later in the fall25. Last, our machine learning models were built based on the limited information provided by field studies, so we cannot explain the variability in outcomes caused by some unincluded factors like soil biodiversity, resulting in uncertainties in predicting SOC and yield changes due to cover cropping.
Economic return is often a key motivator for farmers considering the adoption of CCs, as the associated costs—such as seed, seedbed preparation, and termination—can significantly influence decision-making71. Although legumes typically have higher seed costs compared to non-legumes, their N contribution to subsequent crops can reduce the fertilizer requirements, potentially offsetting initial costs and even increasing net revenue72. Furthermore, the societal benefits of CCs, including agronomic benefits, N loading reduction, and air quality improvements, are estimated to be $75–$137 per acre in the United States73. To encourage adoption, a growing number of programs offering direct subsidies and carbon credit payments have been initiated19. Further cost-benefit analyses of different cover crop types are needed at the field level to support local cost-share programs. For some under-resourced regions like Africa, legume CCs could provide great yield benefits, but it is crucial to provide training and technical assistance to build local knowledge and skills for successful adoption74. Moreover, given the global wide variability in cover crop management, soil conditions, and climate, the success of CCs in building up SOC and increasing yield is highly variable, and the associated stimulated N2O emissions should not be neglected. Future work should integrate data-driven black-box models with process-based modeling approaches to generate more robust bottom-up estimations.
In conclusion, this meta-analysis reveals that (1) both legume and non-legume CCs increase SOC. Legume CCs increase main crop yield and N2O emissions, whereas non-legume CCs have a non-significant effect on average; (2) the effectiveness of CCs in enhancing SOC is mainly associated with mean annual temperature, exhibiting a positive correlation. Nitrogen fertilizer input is the primary factor influencing the impact of CCs on yield, with higher nitrogen levels increasing the yield response to non-legume CCs but decreasing the response to legume CCs; (3) legume CCs show greater benefits in terms of SOC and yield in farming systems with low nitrogen input, low crop diversity, and low initial SOC content, especially in humid and warm environments. Despite the increased N2O emissions, growing legume CCs has the potential to reduce nitrogen fertilizer without yield penalty, and no-tillage, deficit irrigation, and diversified crop rotations can be combined with legume CCs to help mitigate the N2O emissions. Upscaling of cover cropping effects suggests that incorporating legume CCs into cereal-dominated cropland can be a viable strategy for enhancing both SOC and yield. The greatest co-benefits are achievable in regions with humid and warm climates, particularly those currently struggling with nitrogen deficiencies such as Africa.
Methods
Data collection
To gather data for analysis, we began by reviewing study lists of two recent meta-analyses on cover cropping17,22. We subsequently conducted an extensive literature survey using Google Scholar and the Web of Science to search the relevant peer-reviewed papers published before December 2023. The search keywords included “cover crop”, “catch crop”, or “green manure” in combination with “soil organic carbon (SOC)”, “nitrous oxide (N2O)”, “crop yield”, or “productivity”. Then, we applied several criteria to screen the papers: (i) the experiment was implemented with a pairwise design, including a clear control (i.e., bare fallow or spontaneous off-season regrowth) and a cover cropping treatment (i.e., a non-harvested crop grown between productive seasons); (ii) the experiment must contain at least one of the target response variables, and report at least two replicates; (iii) growing conditions and other agronomic management in the control and cover cropping treatments had to be identical; (iv) the experiment must cover at least one full growing season, and data had to be used only once if the same data appeared in several studies. When more than one cover crop treatment was conducted in the same experiment, the control treatment was compared to each cover cropping system separately. Laboratory experiments and modeling studies were excluded from our dataset because they were not influenced by natural environmental factors. We also excluded papers published in languages other than English. Finally, a total of 271 articles spanning six continents and 35 countries were winnowed, including 260 peer-reviewed journal papers, seven master’s theses, one dissertation, two conference proceedings, and one book chapter. In two instances, three publicly available datasets were used to supplement additional data and/or information for the corresponding journal papers. These screening procedures follow the PRISMA methodology (Supplementary Fig. 11).
For each study, we extracted the means, the number of replications, and sampling variances for the control and cover cropping treatments. The treatment value was matched to the control value only if both groups were sampled at the same time and differed in no other respect than the use of CCs (e.g., same fertilizer input, tillage practice, irrigation amount, and residue management). In addition to the response variables, our dataset also included site characteristics, including experimental location, climate conditions, soil properties, and management details, which we used to explain the variation among studies. Data presented in tables were directly extracted, and data from graphs were obtained using the software GetData Graph Digitizer (version 2.25). If latitude and longitude were not reported, we used Google Maps (https://www.google.com/maps) to estimate this information based on the name and location of the experimental sites. In some studies, the climate and soil information that might have affected the impacts of CCs were lacking. Those climate factors, including mean annual air temperature (MAT), mean annual precipitation (MAP), and aridity index (AI) of the MAP divided by potential evapotranspiration, were derived from the Climate Research Unit (CRU) database (http://www.cru.uea.ac.uk/data); missing soil characteristics, including initial SOC, soil pH, bulk density, sand, silt, and clay content, were extracted from Harmonized World Soil Database (HWSD)75 according to the latitude and longitude coordinates of the site.
Data processing
For cover crop type, studies were divided into non-legume and legume (including the mixtures of legume and non-legume) to test the differences in SOC, yield, and N2O responses. To explore possible factors that affect the effects of the two types of CCs, factors were grouped into different categories. Geographic regions were grouped into Africa, Asia, Europe, Oceania, North America, and South America. MAT was classified into cool (≤10 °C per year), warm (10–18 °C per year) and tropical (>18 °C per year). MAP was classified into arid (≤500 mm per year), semi-arid (500–1000 mm per year), and humid (>1000 mm per year)54. Soil texture was categorized as fine, medium, and coarse, following the classification previously described76. Experimental duration was grouped into short (≤3 years), medium (3–10 years), and long (>10 years) following Zhao, et al.77. Due to limited long-term observations of N2O emissions, durations for N2O responses were classified as 1 year (short), 1–3 years (medium), and >3 years (long). Main crop types were grouped into cereals, leguminous crops, vegetables, fiber, and others according to the crop classification in FAO78. Tillage practices for the main crop were treated as a binary variable (CT/NT), where “CT” indicated that the main crop was tilled by conventional tillage, including moldboard plough, chisel plough, rotary tillage, and “NT” contained no-tillage and reduced tillage, including no-till, strip-till, and ridge-till79. Residue management was also treated as a binary variable (return/removal), representing that main crop residues were returned to the field or removed (e.g., physically removed or burned) following harvest. Irrigation practice was recorded as yes or no. When information on these variables was not clearly defined, the cells were left blank.
To quantify the effects of CCs, the natural log of response ratio (RR) was calculated by pairwise comparing SOC, yield, and N2O emissions following Hedges et al.80:
where ({bar{X}}_{t}) and ({bar{X}}_{c}) denote the mean values of target variables (i.e., SOC, yield and N2O emissions) for the cover crop treatment and control, respectively. The effect size (mathrm{ln}{RR}) for each study was weighted by the level of replication. Some studies contained more extractable observations than others, which might contribute a disproportionate amount to the final model. To avoid giving more weight to individual studies, we used the formula following Pittelkow et al.81 and Vendig et al.17:
where ({n}_{t}) and ({n}_{c}) denote the number of replicates for the cover crop treatment and control, respectively. (N) is the total number of observations contributed by a given study. In order to directly show the changes induced by CCs, the meta-analysis results were back-transformed and reported as percentage changes as:
where a significant positive percentage change indicated an increase, and a negative change suggested a decrease in the target variables as an effect of CCs.
A weighted mixed-effects model was performed to generate the mean effect sizes with corresponding 95% confidence intervals (CIs) for each subgroup, using the “rma.mv” function in the R package “metafor” with the method of restricted maximum likelihood (REML). To ensure the independence of each study, ‘study site’ was set as a random factor in the mixed-effects models. Mean effect sizes were considered significant if the 95% CIs did not include 0, and effect sizes between grouped categories were considered as significant if their 95% CIs did not overlap. A comparison of this study and previous meta-studies was presented in Table S1. All calculations were performed using R software (version 4.3.2).
Boosted regression tree analysis
Boosted regression tree (BRT) analyses were conducted to quantify the relative importance of climate (MAT, MAP, and AI), soil (initial SOC, soil pH, bulk density, and clay content), and management (experimental duration, N input, tillage, rotation diversity, and main crop type) in predicting the (mathrm{ln}{RR}) of SOC and yield for legume and non-legume CCs, respectively. The predictions of SOC were made for topsoil (0–30 cm), as 88% of the soil data were sampled from this depth (Supplementary Fig. 9). Due to the limited observations of N2O emissions (only 130 and 151 observations for legume and non-legume CCs, respectively), we did not apply BRT for the (mathrm{ln}{RR}) of N2O emissions. Other management factors, such as CC growing length and termination time, had a relatively small impact and, due to a high proportion of missing data, were excluded from our final BRT analyses (Supplementary Fig. 10). Except for tillage and main crop type, which were classified as discrete variables, the remaining factors were continuous variables.
As tree-based models that use recursive partitioning of datasets, BRT uses large numbers of relatively simple tree models to generate improved predictive performance. Thus, BRT is an ensemble method that combines the strengths of regression trees and boosting algorithms82. For the tree number, tree complexity, and learning rate, we used a grid-search procedure to select the best hyperparameter combinations of BRT models, which resulted in the lowest cross-validation root mean square error (Table S2)83. Other parameters were set following previous studies77,84, i.e., the number of cross-validations as 10 and bag fraction as 0.75. The relative importance of each factor denoted a percentage of the total variation explained by the BRT models. The BRT analyses were performed using the “gbm” package, and additional functions from Elith et al.82.
Finally, the data-based BRT models were applied to global gridded data of the above predictors to estimate the changes in SOC and yield due to CCs at a 0.5 × 0.5 degree resolution, using existing global datasets of: (1) climate data from CRU (http://www.cru.uea.ac.uk/data), (2) soil properties from HWSD75, (3) N inputs by fertilizer and manure from Tian, et al.85, (4) cropland distribution from Hurtt, et al.86, and (5) tillage practices from Porwollik, et al.87. Uncertainties in the predicted SOC and yield changes were given by calculating the 95% bootstrap CIs88.


Responses