Palmitic acid promotes miRNA release from adipocyte exosomes by activating NF-κB/ER stress

Introduction
Obesity is an important risk factor for insulin resistance (IR) and type 2 diabetes mellitus (T2DM), and 80% of T2DM patients experience obesity [1, 2]. Epidemiological data show that T2DM is positively correlated with obesity indicators, such as body mass index, waist circumference, waist-to-hip ratio, body fat percentage, and visceral fat index [3,4,5,6,7]. In 2020, the number of obese patients worldwide reached 1.211 billion, accounting for 15.62% of the total population; this number increased by 2.21% compared to that in 2016 [8]. Although obesity increases the risk of developing T2DM, the specific underlying mechanisms are not fully understood.
Previous studies have shown that adipose tissue can regulate energy metabolism by secreting adipocytokines. Under conditions of obesity, the abnormal secretion of adipocytokines can aggravate IR [9,10,11]. miRNAs are novel adipocyte factors that play an important role in regulating metabolic processes in the body. In the obese state, abnormally expressed miRNAs can induce IR and T2DM by regulating glucose metabolism in target tissues, such as fat, liver, and skeletal muscle tissues [12,13,14,15,16,17,18,19,20]. Our previous research revealed that a group of miRNAs (miR-4431, miR-548ab/ag, and miR-450a-5p) derived from adipose tissue significantly were increased in the serum of obese individuals and HFD-fed mice and could induce IR and impair glucose tolerance by inhibiting the expression of related genes [21,22,23]. Exosomes are vesicles with a diameter of 30–200 nm that are released after the fusion of nuclear endosomes with the plasma membrane [24]. Exosomes can transport various molecules, including proteins, DNA, mRNAs, and miRNAs, and the biological response of miRNAs plays an important role in tissue development, regeneration, homeostasis, and disease pathogenesis. Previous studies have shown that exosomes release from adipose tissue is increased in people with obesity, and this increase in their release increases the serum miRNA content and induces IR [25, 26]. The cause of the increased release of exosomal miRNAs from adipocytes after obesity is not clear.
Obesity is the result of an imbalance between food intake and energy expenditure, resulting in excess energy being stored in adipocytes in the form of free fatty acids (FFAs) [27]. In obesity, increased FFAs in plasma can activate the NF-κB signalling pathway, leading to insulin signalling disorders, and ultimately inducing IR and T2DM [28,29,30]. The endoplasmic reticulum (ER) is an important organelle in most cells and plays a key role in maintaining the homeostasis of cell metabolism and the synthesis of biological macromolecules. Excess nutrients such as FFAs and glucose, due to obesity can destroy the functional homeostasis of the ER. This dysfunction leads to the occurrence of ER stress, which is closely related to the secretion of exosomes [31,32,33]. Zhang et al. showed that excessive activation of the NF-κB signalling pathway can lead to ER stress [34]. In addition, the p65 subunit of NF-κB can also act as a transcription factor to induce apoptosis and ER stress [35]. Palmitic acid (PA) is one of the most common saturated fatty acids in the human body, and it accounts for 20–30% of the total fatty acids in the human body [36]. Su et al. reported that palmitic acid (C16:0), oleic acid (C18:1), and linoleic acid (C18:2) were the most abundant fatty acid fractions and were present at much greater levels than other fatty acid fractions in the serum of 25 normal weight individuals and 25 people with obesity [37]. Our previous research also revealed that the plasma PA content in people with obesity is also greater than that in normal weight individuals [38]. QTT et al. reported that PA can activate the NF-κB inflammatory pathway through GPR40/120 [39]. In addition, studies have confirmed that PA triggers ER stress in macrophages and islets [40]. Whether increased PA promotes ER stress by activating the NF-κB pathway to increase the release of exosomal miRNAs is not clear.
This in vivo and in vitro study confirmed that increased PA content due to obesity can induce ER stress through the activation of the NF-κB signalling pathway in adipose tissue, leading to increased release of exosomal miRNAs.
Materials and methods
Collection of serum and tissue specimens
We collected serum and abdominal adipose tissue samples from normal weight individuals (n = 6) and people with obesity (n = 6) aged 40–60 years from September 2021 to June 2022 in the Shihezi region of Xinjiang, China (According to China’s BMI classification: Normal weight: 18.5 kg/m2 ≤ BMI < 24 kg/m2; Obese: BMI ≥ 28 kg/m2). The group of normal weight individuals consisted of three males and three females, with a mean age of 55.7 years, mean weight of 56.7 kg, 18.5 kg/m2 ≤ BMI < 24 kg/m2, and fasting glucose <7.1 mmol/L. The group of people with obesity consisted of three males and three females, with a mean age of 57.5 years, mean weight of 95.0 kg, BMI ≥ 28 kg/m2, and fasting blood glucose ≥7.1 mmol/L.
Serum samples
A total of 3 ml of venous blood was collected from individuals who had fasted for 12 h. The serum was separated by centrifugation at 1788×g for 5 min. The upper serum layer was collected and frozen in an ultralow temperature freezer before RNA extraction.
Adipose tissue samples
In this study, adipose tissues within the abdominal omentum of normal weight individuals and individuals with obesity according to body mass index (BMI) were collected. The adipose tissue samples were obtained from inpatients of the Department of General Surgery of the First Affiliated Hospital of Shihezi University, all of whom required abdominal surgery. On the day of surgery, strict aseptic operation was performed, and liquid nitrogen cryopreservation was used to obtain approximately 3 cm × 3 cm of omental adipose tissue.
Biochemical indicator test
Triglyceride (TG), total cholesterol (TC), high-density lipoprotein cholesterol (HDL-C), and low-density lipoprotein cholesterol (LDL-C) levels were measured by a TG assay kit (A110-1-1, Nanjing Jiancheng Bioengineering Institute, China), a TC assay kit (A111-1-1, Nanjing Jiancheng Bioengineering Institute, China), an HDL assay kit (A112-1-1, Nanjing Jiancheng Bioengineering Institute, China), and an LDL assay kit (A113-1-1, Nanjing Jiancheng Bioengineering Institute, China), respectively. Plasma PA was detected by a human and mouse PA ELISA Kit (A042-2, Nanjing Jiancheng Bioengineering Institute, China; A185255, Shanghai Fusheng Bioengineering Institute, China).
Cell culture
Preadipocyte 3T3-L1 cells were purchased from the cell bank of the Typical Culture Preservation Committee of the Chinese Academy of Sciences. When the cells in a 25T culture bottle grow to 80–100%, they can be gone down to posterity. Inoculating cells in a six well plate for 2–3 days, and using cell differentiation induction medium I (DMEM high sugar medium, 10% foetal bovine serum, 10 μg/ml insulin, 1 μM/L dexamethasone and 0.5 mmol/L IBMX) was added for 48 h. Cell differentiation induction medium II (DMEM high sugar medium, 10% foetal bovine serum and 10 μg/ml insulin) was added for 48 h, and half of the medium was exchanged for mixed medium containing DMEM high sugar medium and 10% foetal bovine serum for 24 h. All the media were replaced with a mixed medium of DMEM high sugar medium and 10% foetal bovine serum.
Cell treatment
A 40 mM PA solution:PA (Sigma-Aldrich, St. Louis, USA, 0.0614 g) was added to 3 ml NaOH solution (0.1 mol/l),placed in a 75 °C full saponification water bath for 30 min until the PA particles were completely dissolved and the liquid is colourless and transparent. Then, the liquid was immediately added to 3 ml of BSA (40%, free of fatty acid) solution with sufficient mixing. A 200 mM TUDCA solution was prepared; TUDCA (MCE, USA, 5 mg) was dissolved in 1 ml of DMSO. A 10 mM Bay11-7082 solution was prepared; Bay11-7082 (MCE, America, 5 mg) was dissolved in 2.41 ml of DMSO. The experiment will be conducted in groups: the 200 μM PA group, the 500 μM PA group, the 200 μM PA plus 5 μM Bay11-7082 (to block p-p65) group, and 200 μM PA plus 200 μM TUDCA (to block ER stress) group.
miRNAs and RNA isolation and quantitative real-time PCR (qRT-PCR)
miRNAs were extracted using a miRcute miRNA isolation kit (cat# DP503; TianGen, Beijing, China). The miRcute Plus microRNA first strand cDNA kit (cat# KR211; TianGen, Beijing, China) was used for reverse transcription of miRNA first strand cDNA, and the miRcute Plus microRNA SYBR Green qPCR Kit (cat# FP401; TianGen) was used to detect the expression of microRNA. Relative miRNA expression levels were calculated as the ratio of the target gene to an internal reference (the U6 transcript). The primer sequences are shown in Supplementary Table 1.
Total RNA was extracted from cells using TRIzol reagent (cat# 15596-026; Life Technologies, California, USA), and reverse transcription was performed at 42 °C for 60 min and then at 70 °C for 15 min. PCR amplification was performed using a qRT‒PCR instrument (Qiagen, Hilden, Germany) with the following programme settings: 95 °C for 3–5 min, 40–45 cycles at 95 °C for 10 s, 50–60 °C for 30 s, and 72 °C for 40 s. GAPDH was used for normalisation. Relative gene mRNA expression levels were calculated as the ratio of the target gene to an internal reference (glyceraldehyde 3-phosphate dehydrogenase).
Protein isolation from adipose tissue
Adipose tissue (0.5 cm × 0.5 cm) was removed and placed into a 1.5 ml EP tube. A total of 3–4 grinding beads were added, and 100 μl of mixed protein lysis buffer (RIPA buffer and PMSF mixed at a 100:1 ratio) was added to the tube. The sample was subsequently ground into powder. Then, 900 μl of protein lysate was added to the tube, which was placed on a shaker in a refrigerator at 4 °C. After 6–8 h of vigorous shaking, the extraction of tissue proteins was started; the sample was centrifuged at 12,000 r/min for 20 min at 4 °C. New 1.5 ml EP tubes were prepared in advance, and after centrifugation was completed, the bottom layer of the protein lysate was removed with a 1-ml syringe (at this time, the liquid in the EP tubes was divided into three layers). The liquid in the EP tubes was filtered through 0.22-μm filters into new 1.5 ml EP tubes (removing the protein lysates) after removal of the needle (to remove grease and tissue waste). Then, the extracted protein concentration was determined using a nucleic acid detector, and the EP tube was labelled clearly on the cap or the outer wall. Then, the sample was placed in a −20 °C refrigerator for freezing and preservation to prepare for subsequent experiments.
Western blot and antibody
The protein sample was prepared using 4× loading buffer at a 3:1 ratio. The sample was mixed well and centrifuged before boiling in a dry bath. After returning to room temperature, the sample was processed. Antibodies against β-actin (Cat#TA-09) were from ZSGB-BIO, antibodies against GRP78 (3177S), ATF6 (65880S), PERK(312S), PERK(3192S), IRE1α(3294S), p-p65(3033SS), p65(8242SSS) were from Cell Signalling Technology. Antibodies against TSG101(ab125011), HSP70 (ab2787) were from Abcam. The vertical electrophoresis apparatus and protein transfer apparatus used in the experiment were purchased from Bio-Rad Company (United States), and images were processed using Photoshop software.
Calculation of fold change for western blot results
All the target bands were scanned in grayscale using ImageJ software; subsequently, the grayscale value of each group of target genes was divided by the grayscale value of each group of internal references to obtain a ratio X. After the ratios of the three replicates of the experiments were averaged, the ratio Y was obtained by dividing the previously obtained ratio X of each group by the average, and finally, the Y value was used to make a quantification graph.
Extraction of exosomes
Three days before cell treatment, the serum was replaced with exosome-free serum. After the cell culture medium was collected, the exosomes were extracted with a Novazan Exosome Extraction Kit (cat# R601; Novazan, Nanjing, China) and stored at −80 °C.
Identification of exosomes
Then, 5–10 μl of the exosome suspension was adsorbed on copper mesh for 3–5 min and stained with phosphotungstic acid for 3 min. Next, the samples were infrared-baked for 20 min and observed under a transmission electron microscope. A 20 μl aliquot of the exosome suspension was diluted with sterile PBS to 1–1.5 ml. It was then thoroughly mixed and shaken, placed in a colorimetric dish, and analysed experimentally using the NanoSight system.
Animal experiment
Four-week-old C57BL/6 male mice were purchased from Hunan Slake Jingda Experimental Animal Co., Ltd., and raised at the SPF Experimental Animal Center at the Liyushan Campus of Xinjiang Medical University. In order to reduce the number of animal sacrifices and ensure the success rate of operation in experimental mice, we adopted a small sample size design. Before group feeding, all male mice were randomly assigned to test and control groups, and both groups were fed ad libitum in order to ensure normal survival of the mice. Mice were housed at 3–5 mice/cage. The food and water were changed once a day, and the weight and body length were measured weekly. After adaptive feeding for 1 week, the mice were randomly divided into a normal control diet feeding group (NCD, 10% calories from fat, cat# MD12031, purchased from Jiangsu Medison Biomedical Co., Ltd.; n = 6) and a high-fat diet feeding group (HFD + PA, 60% calories from fat and 5% PA, cat# MD12033, purchased from Jiangsu Medison Biomedical Co., Ltd.; n = 18). The body weight and Lee’s index of mice in the high-fat diet group increased significantly (P < 0.05) compared with those in the normal diet group; and the FBG, as well as the serum TG, TC, LDL-C, and PA content were significantly higher than those in the normal diet group (P < 0.05). It was suggested that the diet-induced obese mouse model was successfully constructed. After being fed for 11 weeks, the HFD-fed mice were divided into three groups: the HFD group (DMSO, n = 6), the group that received an intraperitoneal injection of Bay11-7082 (HFD+Bay11-7082, 2.5 mg/kg/week; n = 6) and the group fed a HFD and intraperitoneally injected with TUDCA (HFD + TUDCA, 0.25 g/kg, 4 times per week, n = 6).
Glucose tolerance test and insulin tolerance test
The glucose tolerance test (GTT) and insulin tolerance test (ITT) were conducted at the 12th week. For the GTT, the feed was removed, water was provided for 12 h. Then, 50% glucose solution (4 μl/g) was injected intraperitoneally, and blood glucose was measured at 0, 0.5, 1, 1.5, and 2 h. For the ITT, the feed was removed, and the mice were continuously supplied with water for 6 h. The mice were intraperitoneally injected with different doses of insulin (0.5 IU/g), and blood glucose was measured at 0 h, 0.5 h, 1 h, 1.5 h, and 2 h. After the GTT and ITT, adipose tissue, liver, and serum samples were collected for analysis.
Blinding
Four researchers were involved in this animal study. The first researcher was responsible for group feeding and numbering of the mice, the second researcher was responsible for injecting the relevant agents (grouping of mice unknown), the third researcher was responsible for taking gross photographs of the mice and surgical dissection of the tissues (grouping of mice unknown),and the fourth researcher was responsible for analysing the levels of expression of the factors in the tissues according to the numbering (grouping of mice unknown), and sending the data to the first researcher for Analysis.
Statistical analysis
The statistical software SPSS 18.0 was used for data analysis. For normally distributed data with similar variance, Student’s t tests were used when two groups of data were compared. For comparisons between three groups of data, one-way ANOVA-LSD analysis was conducted. When P < 0.05, the difference was considered statistically significant. The values are expressed as the means ± SEMs (Prism 7; GraphPad Software). In this study, no power analysis was performed to determine the sample size. The sample size was based on previous studies employing mice.
Results
In people with obesity, serum PA levels are elevated, the NF-κB/ER stress pathway is activated in adipose tissue, and exosomal miRNA levels in serum are increased
Serum and abdominal adipose tissue samples were collected from normal weight individuals and people with obesity. The weight, BMI, waist circumference, and FPG, TG, TC, and LDL-C levels of people with obesity were significantly greater than those of normal weight individuals (Table 1). Compared with normal weight individuals, people with obesity had significantly elevated serum PA levels (Fig. 1A). The protein expression levels of the adipose tissue marker adiponectin were significantly greater in adipose tissue than in skeletal muscle tissue (Fig. 1B). Compared with those in normal weight individuals, the mRNA and protein expression levels of the inflammatory-related factors p-p65, IL-6, MCP-1, and TNF-α and the ER stress markers GRP78, PERK, IRE1α, and ATF6 were significantly increased in the abdominal adipose tissue of people with obesity (Fig. 1C–E). Moreover, miR-4431, miR-548ab/ag, and miR-450a-5p levels were also elevated in the abdominal adipose tissue and serum of people with obesity (Fig. 1F, G). The expression of the exosomal surface markers CD81, TSG101, and Hsp70 was significantly increased in people with obesity (Fig. 1H–K). Moreover, the levels of miR-4431, miR-548ab/ag, and miR-450a-5p in serum exosomes were also increased in people with obesity (Fig. 1L). All these differences were statistically significant (P < 0.05).

A Compared with normal weight individuals (n = 6), people with obesity (n = 6) had significantly elevated serum PA levels. B The levels of adiponectin, an adipose tissue marker, were significantly greater in adipose tissue (n = 3) than in skeletal muscle tissue (n = 3). C Compared with those in normal weight individuals (n = 6), the mRNA and protein expression levels of inflammatory-related factors and ER stress markers were significantly increased in the abdominal adipose tissue of people with obesity (left) (n = 6). ImageJ quantification was performed (right). D, E Compared with those in normal weight individuals (n = 6), the mRNA expression levels of inflammatory factors and ER stress markers were significantly increased in the adipose tissue of people with obesity (n = 6). F, G The levels of miRNAs in adipose tissue and serum were significantly greater in people with obesity than in normal weight individuals. H Transmission electron microscopic observation of exosome morphology. I NTA was used to detect exosome particle size. J, K The expression of exosomal surface markers was significantly increased in people with obesity. L The levels of miRNAs in serum exosomes were also increased in people with obesity. *P < 0.05, **P < 0.01, and ***P < 0.01 indicate statistically significant differences.
In HFD-fed mice, the serum PA content was elevated, the NF-κB/ER stress pathway was activated in adipose tissue, and the exosomal miRNA level in serum was increased
Male C57BL/6 mice were fed a HFD containing 5% PA for 11 weeks. Compared with that in mice of the NCD group, the body weight of HFD-fed mice was significantly increased (Fig. 2A, B), and the serum PA content was also significantly increased (Fig. 2C). The mRNA and protein expression levels of the inflammatory-related factors p-p65, IL-6, MCP-1, and TNF-α and the ER stress markers GRP78, PERK, IRE1α, and ATF6 were significantly increased in the abdominal adipose tissue of HFD-fed mice (Fig. 2D, G). The expression of the surface markers CD81, TSG101, and Hsp70 on exosomes was significantly increased in HFD-fed mice (Fig. 2H). Moreover, the levels of miR-4431, miR-548ab/ag and miR-450a-5p in the abdominal adipose tissue and serum of HFD-fed mice were also significantly increased (Fig. 2I, J). Moreover, the HFD-fed mice exhibited elevated blood glucose levels, reduced glucose tolerance, and impaired insulin sensitivity (Fig. 2K–M). All these differences were statistically significant (P < 0.05).
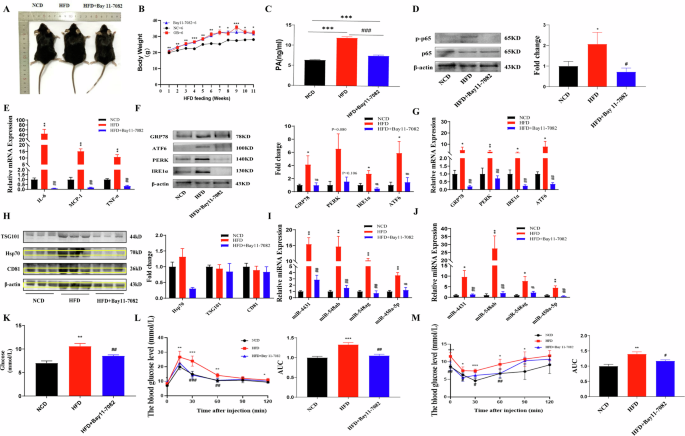
A Gross morphology of different groups of mice. B, C Compared with those in the NCD-fed mice (n = 6), body weight and serum PA content were significantly greater in the HFD-fed mice (n = 6). Blocking p-p65 had no significant effect on body weight, but serum PA levels were reduced. D, E The protein expression level of p-p65 and the mRNA expression level of inflammatory factors were significantly increased in the abdominal adipose tissue of mice in the HFD group. Blocking p-p65 reversed the above phenotypes in HFD-fed mice. F, G The protein and mRNA expression levels of ER stress markers were significantly increased in the abdominal adipose tissue of mice in the HFD group. Blocking p-p65 reversed the above phenotypes in HFD-fed mice. H The protein expression levels of exosome markers were significantly increased in the abdominal adipose tissue of mice in the HFD group. Blocking p-p65 reversed the above phenotypes in HFD-fed mice. I, J The miRNA levels in the abdominal adipose tissue and serum of HFD-fed mice were significantly increased. Blocking p-p65 reversed the above phenotypes in HFD-fed mice. K‒M HFD-fed mice displayed elevated blood glucose levels, reduced glucose tolerance, and impaired insulin sensitivity. Blocking p-p65 reversed the above phenotypes in HFD-fed mice. *NCD and HFD comparison, #HFD and HFD+Bay11-7082 comparison, *P < 0.05, **P < 0.01, ***P < 0.001, #P < 0.05, ##P < 0.01, and ###P < 0.001 indicate statistically significant differences.
Blocking p-p65 alleviated ER stress and reduced the release of serum exosomal miRNAs in mice with obesity
Four weeks after intraperitoneal injection of the p-p65 blocker Bay11-7082 in mice fed a HFD, significant changes were observed. The p-p65 inhibitor significantly reduced the mRNA and protein expression levels of the inflammatory factors p-p65, IL-6, MCP-1, and TNF-α and the ER stress markers GRP78, PERK, IRE1α, and ATF6 in the abdominal adipose tissue of HFD-fed mice compared to mice in the control group (Fig. 2D–G). The expression of the surface markers CD81, TSG101, and Hsp70 on exosomes was significantly reduced in the abdominal adipose tissue of HFD-fed mice (Fig. 2H). In addition, the levels of miR-4431, miR-548ab/ag and miR-450a-5p in abdominal adipose tissue and serum were also significantly reduced after blocking p-p65 in HFD-fed mice (Fig. 2I, J). Moreover, blocking p-p65 significantly improved glucose tolerance and insulin sensitivity in HFD-fed mice (Fig. 2K–M). All these differences were statistically significant (P < 0.05).
Blocking ER stress reduced the release of serum exosomal miRNAs in mice with obesity
After 4 weeks of intraperitoneal injection of the ER stress blocker TUDCA in mice fed a HFD, significant changes were observed. The ER stress blocker significantly reduced the mRNA and protein expression levels of the ER stress markers GRP78, PERK, IRE1α, and ATF6 in the abdominal adipose tissue of HFD-fed mice compared to those levels in mice in the control group (Fig. 3A–C). The expression of the surface markers CD81, TSG101, and Hsp70 on exosomes was significantly reduced in the abdominal adipose tissue of HFD-fed mice (Fig. 3D). In addition, the levels of miR-4431, miR-548ab/ag and miR-450a-5p in abdominal adipose tissue and serum were also significantly reduced after blocking ER stress in HFD-fed mice (Fig. 3E, F). Moreover, blocking ER stress significantly improved glucose tolerance and insulin sensitivity in HFD-fed mice (Fig. 3G–I). All these differences were statistically significant (P < 0.05).
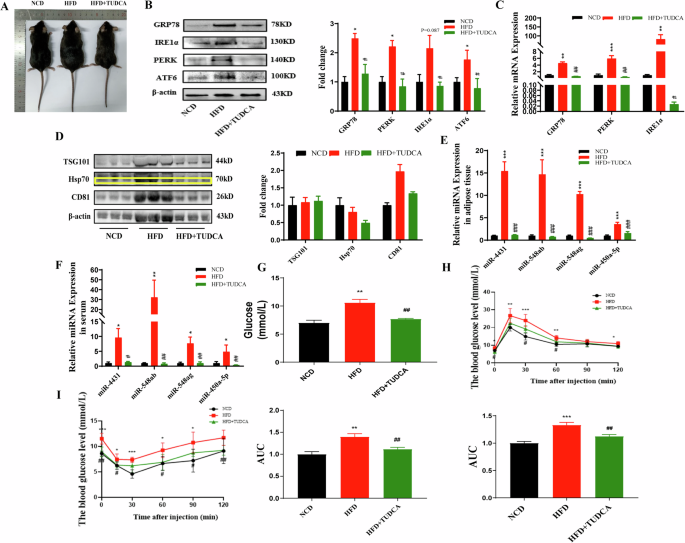
A Gross morphology of the different groups of mice. B, C The protein and mRNA expression levels of ER stress markers were significantly increased in the abdominal adipose tissue of mice in the HFD group. Blocking ER stress reversed the above phenotypes in HFD-fed mice. D The protein expression levels of exosome markers were significantly increased in the abdominal adipose tissue of mice in the HFD group. Blocking ER stress reversed the above phenotypes in HFD-fed mice. E, F The miRNA levels in the abdominal adipose tissue and serum of HFD-fed mice were significantly increased. Blocking ER stress reversed the above phenotypes in HFD-fed mice. G–I HFD-fed mice displayed elevated blood glucose levels, reduced glucose tolerance, and impaired insulin sensitivity. Blocking ER stress reversed the above phenotypes in HFD-fed mice. *NCD and HFD comparison, #HFD and HFD + TUDCA comparison, *P < 0.05, **P < 0.01, ***P < 0.001, #P < 0.05, ##P < 0.01, and ###P < 0.001 indicate statistically significant differences.
PA activated the NF-κB/ER stress pathway and promoted the release of exosomal miRNAs in adipocytes
Uninduced differentiated 3T3-L1 cells appeared as fibroblasts with a spindle shape, cytoplasm without lipid droplets, clearly visible nuclei, obvious cell boundaries, and no expression of the adipocyte marker adiponectin. After differentiation was induced, more than 90% of the cells were maturely differentiated, with more round lipid droplets of different sizes and obvious refraction. After oil red O staining, many lipid droplets in mature adipocytes were observed, and the mRNA expression level of adiponectin, an adipocyte marker, was significantly increased. These findings suggest that adipocyte-induced differentiation was successful (Fig. 4A, B).
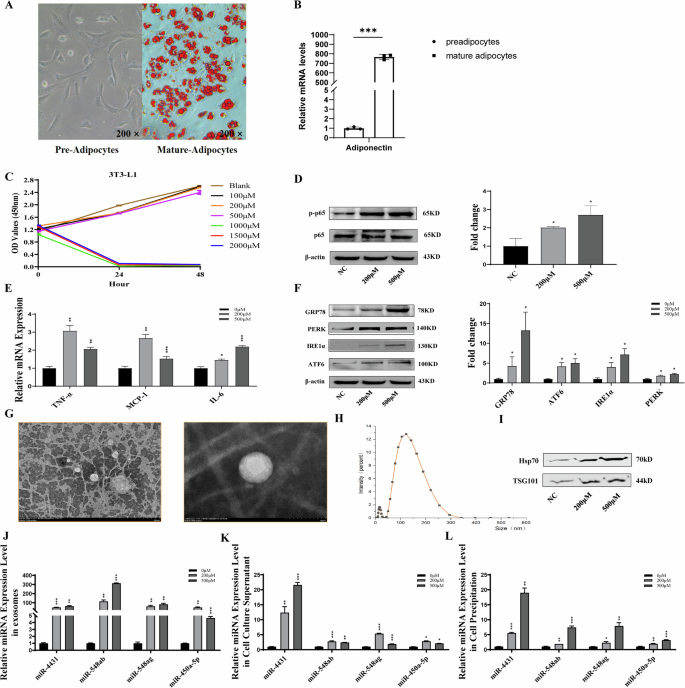
A, B Maturely differentiated adipocytes with more round lipid droplets of different sizes and obvious refraction. After oil red O staining, many lipid droplets in mature adipocytes were observed, and the expression level of adiponectin, an adipocyte marker, was significantly increased. C Different concentrations of PA were applied to mature adipocytes for 24 h and 48 h, and the activity of adipocytes was detected. PA at concentrations of 200 μM and 500 μM did not have any toxic effects on adipocytes; thus, it was used for subsequent experiments. D–F After treatment with 200 μM or 500 μM PA for 24 h, the expression of the inflammatory factors p-p65, IL-6, MCP-1, and TNF-α and the ER stress markers GRP78, ATF6, PERK, and IRE1α markedly increased. G–I Treatment with both 200 μM and 500 μM PA significantly increased the expression of the exosome surface markers Hsp70 and TSG101. J–L The levels of miR-4431, miR-548ab/ag and miR-450a-5p in exosomes, cell culture supernatants and cell precipitates were significantly increased by PA treatment. *P < 0.05, **P < 0.01, and ***P < 0.001 indicate statistically significant differences.
PA (100 μM, 200 μM, 500 μM, 1000 μM, 1500 μM, and 2000 μM) was applied to mature adipocytes for 24 h and 48 h, and the activity of adipocytes was detected. PA at concentrations of 200 μM and 500 μM did not have any toxic effects on adipocytes; thus, it was used for subsequent experiments (Fig. 4C).
After treatment with 200 μM or 500 μM PA for 24 h, the expression of the inflammatory factors p-p65, IL-6, MCP-1, and TNF-α and the ER stress markers GRP78, ATF6, PERK, and IRE1α were markedly increased (Fig. 4D–F). After the extraction of cell culture supernatant exosomes, treatment with both 200 μM and 500 μM PA significantly increased the expression of the exosome surface markers Hsp70 and TSG101 (Fig. 4G–I). Moreover, the levels of miR-4431, miR-548ab/ag and miR-450a-5p in exosomes, cell culture supernatants and cell precipitates were significantly increased by PA treatment (Fig. 4J–L). All these differences were statistically significant (P < 0.05).
Blocking p-p65 attenuated PA-induced inflammation, ER stress and miRNA release in adipocytes
Compared with NC treatment, 200 μM PA treatment significantly increased the expression levels of p-p65, a key protein of the NF-κB signalling pathway. Additionally, the expression levels of the inflammatory factors IL-6, MCP-1, and TNF-α and the endoplasmic reticulum stress markers GRP78, ATF6, PERK and IRE1α were increased in adipocytes (Fig. 5A–E). After adipocyte culture supernatant exosomes were extracted, treatment with 200 μM PA significantly increased the expression of the exosome surface markers Hsp70 and TSG101 (Fig. 5F). Treatment with PA (200 μM) significantly increased the miRNA content in exosomes and the cell culture supernatant of adipocytes (Fig. 5G–H). All these differences were statistically significant (P < 0.05).
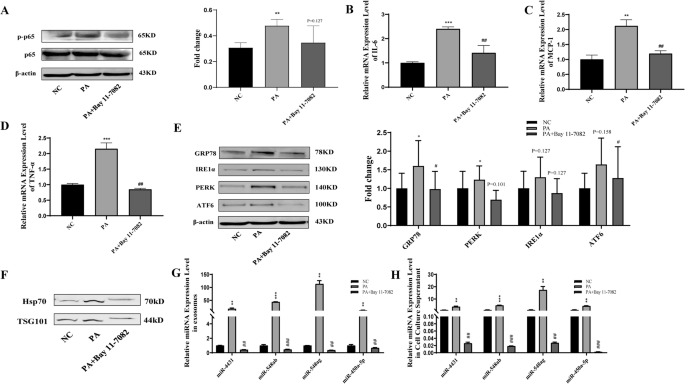
A–D Compared with NC treatment, 200 μM PA treatment significantly promoted the protein expression of p-p65 and the mRNA expression of the inflammatory factors IL-6, MCP-1, and TNF-α. Blocking p-p65 reversed the above effects of PA on adipocytes. E Compared with NC treatment, 200 μM PA treatment significantly promoted the protein expression of the endoplasmic reticulum stress markers GRP78, ATF6, PERK and IRE1α. Blocking p-p65 reversed the above effects of PA on adipocytes. F–H Treatment with 200 μM PA significantly increased the miRNA content in exosomes and the supernatant of adipocytes. Blocking p-p65 reversed the above effects of PA on adipocytes. *NC and PA comparison, #PA and PA+Bay11-7082 comparison, *P < 0.05, **P < 0.01, ***P < 0.001, #P < 0.05, ##P < 0.01, and ###P < 0.001 indicate statistically significant differences.
Compared with that in the 200 μM PA treatment group, blocking p-p65 in the 200 μM PA treatment group significantly inhibited the expression of the inflammatory factors p-p65, IL-6, MCP-1, and TNF-α and the ER stress markers GRP78, ATF6, PERK, and IRE1α in adipocytes (Fig. 5A–E). After adipocyte culture supernatant exosomes were extracted, treatment with 200 μM PA combined with p-p65 inhibition significantly reduced the expression of exosome surface markers Hsp70 and TSG101 compared with that in the PA only-treated group (Fig. 5F). Blocking p-p65 significantly reversed the promoting effect of PA on the miRNA content in exosomes and the cell culture supernatant of adipocytes (Fig. 5G, H). All these differences were statistically significant (P < 0.05).
Blocking ER stress attenuated PA-induced miRNA release in adipocytes
Compared with NC treatment, 200 μM PA treatment significantly increased the expression levels of the endoplasmic reticulum stress markers GRP78, ATF6, PERK and IRE1α in adipocytes (Fig. 6A). After adipocyte culture supernatant exosomes were extracted, treatment with 200 μM PA significantly increased the expression of the exosome surface markers Hsp70 and TSG101 (Fig. 6B). Treatment with PA (200 μM) significantly increased the miRNA content in exosomes and the cell culture supernatant of adipocytes (Fig. 6C–E). All these differences were statistically significant (P < 0.05).
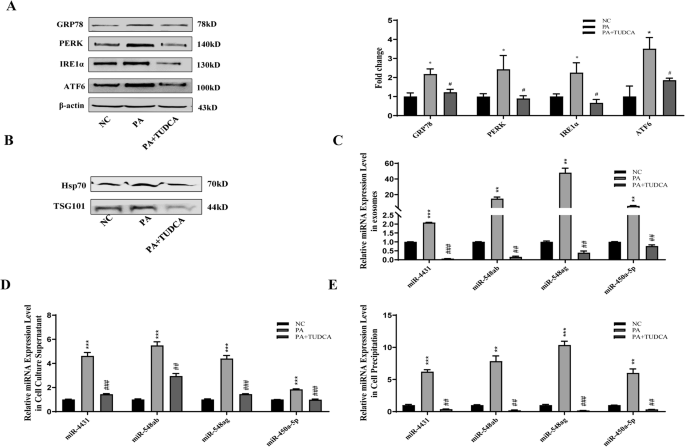
A Compared with NC treatment, 200 μM PA treatment significantly increased the expression levels of the endoplasmic reticulum stress markers GRP78, ATF6, PERK and IRE1α. Blocking ER stress reversed the above effects of PA on adipocytes. B Compared with NC treatment, 200 μM PA treatment significantly increased the expression of the exosome surface markers Hsp70 and TSG101. Blocking ER stress reversed the above effects of PA on adipocytes. C–E Compared with NC treatment, treatment with 200 μM PA significantly increased the miRNA content in exosomes, cell culture supernatants and adipocytes cell precipitates. Blocking ER stress reversed the above effects of PA on adipocytes. *NC and PA comparison, #PA and PA + TUDCA comparison, *P < 0.05, **P < 0.01, ***P < 0.001, #P < 0.05, ##P < 0.01, and ###P < 0.001 indicate statistically significant differences.
Compared with the 200 μM PA treatment alone, blocking ER stress with TUDCA significantly inhibited the expression of the ER stress markers GRP78, ATF6, PERK and IRE1α in adipocytes (Fig. 6A). After adipocyte culture supernatant exosomes were extracted, treatment with 200 μM PA and blocking ER stress significantly inhibited the expression of the exosome surface markers Hsp70 and TSG101 compared with that in the PA-treated group. Moreover, blocking ER stress significantly reversed the promoting effect of PA on the miRNA content in exosomes and the cell culture supernatant of adipocytes (Fig. 6A–D). All these differences were statistically significant (P < 0.05).
Discussion
miRNAs are a new class of adipokine that are released into the circulation by adipocyte-derived exosomes. They play an important role in glucose metabolism by regulating the expression of genes related to glucose metabolism in target organs [41, 42]. miRNAs have broad application prospects as diagnostic markers and therapeutic targets for obesity-related metabolic diseases [43, 44]. Our previous study showed that the levels of adipose tissue-derived miRNAs, such as miR-4431, miR-548ab/ag and miR-450a-5p, were increased in the serum of people with obesity and were positively correlated with the FPG level of individuals [45, 46]. However, the mechanisms underlying obesity-induced elevations in circulating miRNA levels have not been fully elucidated.
Increased lipolysis after obesity leads to a significant increase in plasma FFAs; thus, it serves as an important link between obesity and IR/T2DM [47]. Previous studies have shown that high concentrations of FFAs can affect the endocrine function of adipocytes [48]. At present, there are 37 known types of FFAs in the human body, with PA being the most abundant in the plasma, and the FFA content is significantly increased in people with obesity [39]. Min KH et al. reported that excessive dietary intake of PA promoted ectopic lipid accumulation and induced the overexpression of miR-424-5p, which aggravated IR and T2DM [49]. In addition, the main reason for impaired insulin secretion due to long-term exposure of pancreatic β-cells to PA may also be related to changes in the expression of specific miRNAs [50]. Intracellular miRNAs can be encapsulated and released into the peripheral circulation by exosomes for translocation to other tissues and organs to perform their respective functions [51, 52]. Through in vitro and in vivo experiments, this study revealed that obesity-induced elevations in PA content can increase the circulating miRNA content by promoting the release of adipocyte exosomes, but the specific molecular mechanisms involved are not clear. Attempts to elucidate the possible molecular mechanisms involved will provide a theoretical basis for further clarifying the specific causes of obesity-induced T2DM. Moreover, these findings will provide a basis for the wider application of miRNAs in the prevention and treatment of obesity and related metabolic diseases.
Obesity is a chronic, low-grade inflammatory state, and activation of the NF-κB inflammatory signalling pathway has been detected in the metabolic organs of obese individuals, such as adipose tissue, liver, and muscle [53,54,55,56]. Our previous study revealed that high concentrations of PA can activate the adipocyte NF-κB inflammatory signalling pathway through TLR4 and GPR receptors [39, 57]. It has been shown that lipopolysaccharide can induce mouse macrophages to secrete exosomes, which contain high levels of inflammatory cytokines and miRNAs [58]. Using in vitro culture of 3T3-L1 adipocytes and the construction of a diet-induced obese mouse model, this study revealed that high concentrations of PA can promote the release of adipose tissue/cellular exosomes through activation of the NF-κB inflammatory signalling pathway and subsequently increase the levels of circulating miRNAs. Moreover, the glucose tolerance and insulin sensitivity of obese mice were significantly improved.
Liu B et al. reported that an increase in PA content after obesity can induce ER stress by activating the NF-κB inflammatory signalling pathway. Duvigneau JC et al. reported that ER stress can increase adipocyte exosome release by triggering the unfolded protein response, which is related to the occurrence of metabolic diseases such as nonalcoholic steatohepatitis [21, 59, 60]. However, whether there is an internal relationship among the increase in PA content caused by obesity, the activation of the NF-κB/ER stress signalling pathway in adipose tissue, and the increase in exosome release from adipocytes has not been reported. This study verified and confirmed by in vivo and in vitro experiments that high concentrations of PA could induce ER stress to promote exosome release through activation of the adipose tissue/cellular NF-κB inflammatory signalling pathway, which subsequently increased the levels of circulating miRNAs.
As mentioned previously, the human body contains 37 free fatty acid isoforms, and in the present study, only the effect of PA on the release of exosomal miRNAs was explored. Thus, whether other fatty acids, such as oleic and linoleic acids, which are also more abundant, also influence the release of exosomal miRNAs was not explored. In addition, there are interactions between different fatty acid subtypes in the human body, and the increased release of exosomal miRNAs from adipose tissue under conditions of obesity may also be a result of the interaction of different fatty acids. The above shortcomings need to be fully considered in future studies.
Interestingly, this study not only revealed that PA promoted the release of miRNAs from adipocyte exosomes but also revealed that the expression levels of miR-4431, miR-548ab/ag, and miR-450a-5p were in the abdominal adipose tissue mass and serum PA levels significantly increased in both people with obesity and obese mice. Moreover, the increase in the expression levels of the above miRNAs was significantly reversed by blocking the inflammatory response and blocking ER stress. The above results suggest that PA can also increase the expression of miRNAs in adipose tissue. However, in this study, the specific molecular mechanisms by which PA promotes the expression of miRNAs in adipocytes were not explored in depth. PA is a signalling molecule, but whether PA promotes the expression of miRNAs by affecting the expression of certain transcription factors will be an important direction for future research.
In summary, this study confirmed that obesity-induced increases in PA content can induce ER stress through the activation of the NF-κB signalling pathway in adipose tissue, leading to increased exosomal miR-4431, miR-548ab/ag, and miR-450a-5p levels (Fig. 7). Overall, miRNAs can be used to assess the severity of a given disease and identify potential treatment targets. Clarifying the mechanisms underlying the inflammation-miRNA/ERS-miRNA crosstalk could help to combat the progression of chronic diseases, including obesity and T2DM. This study provides a theoretical basis for further elucidating the molecular mechanism of obesity-induced T2DM and screening for effective drug targets.
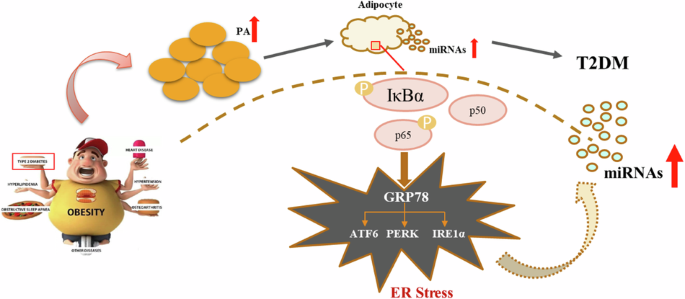
Obesity-induced increases in palmitic acid can activate the NF-κB/ER stress signalling pathway in adipose tissue, increasing the release of exosomal miRNAs and ultimately leading to glucose metabolism disorders.

Responses