Pan-cancer analysis uncovered the prognostic and therapeutic value of disulfidptosis
Introduction
Programmed cell death (PCD), including apoptosis, pyroptosis, autophagy, necroptosis, ferroptosis, and cuproptosis., refers to the process of cell death that occurs when cells are stimulated by certain conditions to maintain homeostasis1 Investigating the intricate molecular biological mechanisms underlying the occurrence of different types of PCD has significant biological importance, not only for understanding the pathogenesis of certain diseases but also for stimulating specific cell death through appropriate stimuli to treat the disease2 Ferroptosis, a type of cell death caused by abnormal accumulation of intracellular iron and reactive oxygen species, has been extensively studied to discover new chemotherapeutic agents that can induce ferroptosis in cancer cells to inhibit tumor growth or promote cancer cell death3,4. In addition, inhibition of ferroptosis can protect organisms from glutamate-induced neurotoxicity and ischemia/reperfusion-induced organ damage. Cuproptosis, another type of PCD mediated by a substantial amount of protein lipoylation caused by the excessive accumulation of copper, has attracted the attention of many researchers and provides targeted treatment plans for a variety of diseases, including tumors and non-tumoral diseases5,6.
Sulfur is an essential macronutrient for the human body, and its content is higher than that of iron and copper7. Sulfur not only participates in the composition of sulfur-containing amino acids within the human body, such as disulfides, but also in various important metabolic processes such as redox regulation and methylation8. Interestingly, in a recent study, Liu et al. discovered that there is an abnormal accumulation of disulfides in high SLC7A11 cells under glucose starvation and that these disulfides bind to actin, which causes actin contraction and leads to cytoskeletal disruption, resulting in cell death, which is different from other types of PCD, such as disulfidptosis9.
The discovery of novel cell death patterns has often promoted the development of specific therapeutic agents for these diseases. For example, Yang et al. found that exosomes from human plasma containing miR-25-3p administered to mice could inhibit iron death via the P53/SLC7A11/GPX4 axis, thereby ameliorating ischemia/reperfusion-induced brain damage after intracerebral hemorrhage10. Zhou et al. invented a therapeutic nanoplatform that can simultaneously release disulfiram and copper, which can kill tumor cells by inducing cuproptosis to achieve therapeutic purposes11. As a result, it can be predicted that disulfidptosis, which differs from other cell death owing to its specific mechanisms of occurrence, will lead to a boom in research on disease mechanisms and the exploitation of new specific drugs, especially in tumor research.
However, at present, studies on disulfidptosis in pan-cancer have not been reported. In this study, we explored for the first time the manifestation of disulfidptosis in pan-cancer by combining computational and experimental approaches and revealed the remarkable value of disulfidptosis in predicting the survival of pan-cancer patients and guiding individualized treatment by identifying disulfidptosis subtypes and developing a model and nomogram based on disulfidptosis-related genes (DRGs).
Results
Manifestations of disulfidptosis in pan-cancer
As mentioned above, Liu et al. discovered disulfidptosis, a new form of cell death, in renal and lung cancer cells, and we attempted to explore the manifestations of disulfidptosis in pan-cancer. The main mechanism of disulfide death is that a large number of aberrant glutathionylation modifications occur in high SLC7A11-expressing cancer cells, generating a large number of disulfide bonds, which are mainly formed in actin cytoskeletal proteins, leading to actin rearrangement and cytoskeletal remodeling, causing cell death. Therefore, we performed immunofluorescence staining on paraffin sections from clinical patients and found that SLC7A11 was highly expressed in the tumor tissues of KICH, COAD, LUSC, LUAD, and LIHC compared to normal tissues, and the distribution of β-actin was significantly disturbed and poorly visible in the SLC7A11 high-expressing cells, which is similar to the findings of Liu et al. suggesting that disulfidptosis also occurs in these five cancer cells with high SLC7A11 expression (Fig. 1A, C). To further demonstrate our findings, we identified the glucose starvation status of cells in tumor tissues by the relative expression of Glucose transporter 1 (GLUT1). We found that glucose-starved cells, which had relatively high expression of GLUT1, in KICH, COAD, LUSC, LUAD, and LIHC, SLC7A11 also showed high expression in the tumor cells and showed co-localization with GLUT1 (Fig. 1B, D).
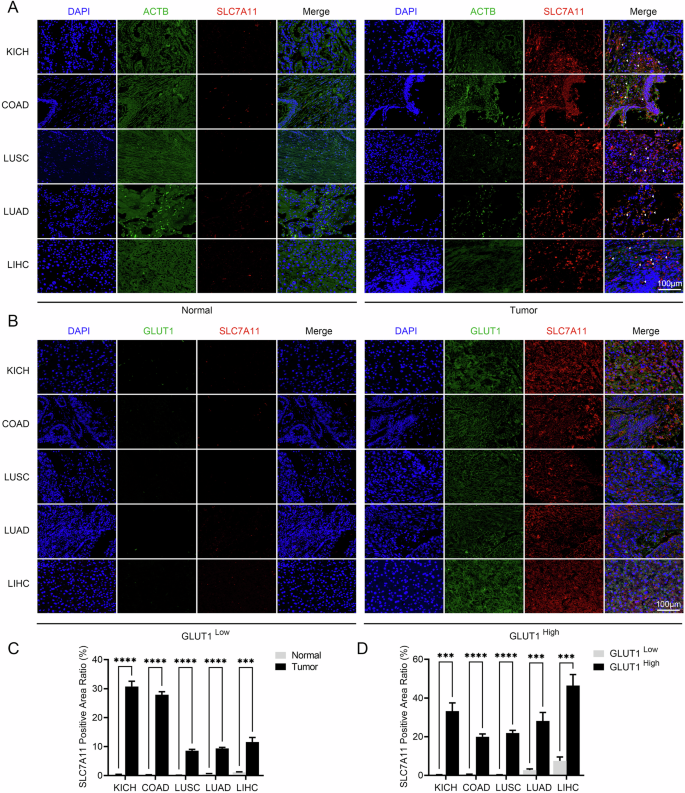
Representative immunofluorescence staining of (A) SLC7A11 and ACTB in tumor tissue and normal tissue and (B) GLUT1 and SLC7A11 in tumor tissue (n = 3). Scale bars represent 100 μm. Quantification of SLC7A11 in (C) tumor and normal tissue and (D) tumor of high and low GLUT1 expression. COAD Colon Cancer, LUAD Lung Adenocarcinoma, LUSC Lung Squamous Cell Carcinoma, KICH Kidney Chromophobe, LIHC Liver Cancer.
Furthermore, by leveraging single-cell and spatial transcriptome analyses, we attempted to decipher the manifestations of disulfidptosis in pan-cancer, starting with Grx, the key enzyme that catalyzes the glutathionylation modification of proteins, including glutaredoxin (GLRX), glutaredoxin 2 (GLRX2), glutaredoxin 3 (GLRX3), and glutaredoxin 5 (GLRX5). First, with single-cell analysis, interestingly, we found that within the tumor microenvironments of various cancer tissues, SLC7A11 had different expression patterns across different cell types, whereas the Grx system consistently exhibited a tendency for certain or all of them to be highly expressed in malignant cells within the tumor microenvironments of CHOL, HNSC, LIHC, MCC, NSCLC, and PAAD (Fig. 2A–F). This suggests that excessive glutathionylation modification to form abundant disulfide bonds leading to cytoskeletal disruption and cell death is prevalent in malignant tumor cells whereas the relevant genes regulating the onset of disulfidptosis are heterogeneous across cells. To confirm our findings, we further analyzed the spatial transcriptome data of six cancers: GBM, CRC, GIST, OSCC, BRCA, and UCEC. Initially, to further fully characterize DRGs and Grx system expression, the ssGSEA algorithm was used to calculate disulfidptosis and Grx system scores for each point (Fig. 3A–L). The results indicate that, compared to normal tissue, the tumor regions exhibit elevated Grx system scores. Whereas the disulfidptosis scores also had high levels in some normal tissues, which nevertheless exhibited very low Grx system scores. (Fig. 3A, G). Interestingly, we divided the tumor spots into high and low disulfidptosis groups according to the median disulfidptosis scores and analyzed their KEGG Glutathione metabolism pathway, which showed a significant enhancement in the high disulfidptosis group compared to the low disulfidptosis group (Fig. 3A-L). Taken together, our results demonstrate that excessive glutathione modification to form abundant disulfide bonds leads to cytoskeletal disruption and cell death not only in renal and lung cancer cells but also commonly in malignant tumor cells. In addition, considering the high heterogeneity of DRGs expression in different tissues or cells, it is particularly important to study their genomic genetic variation.
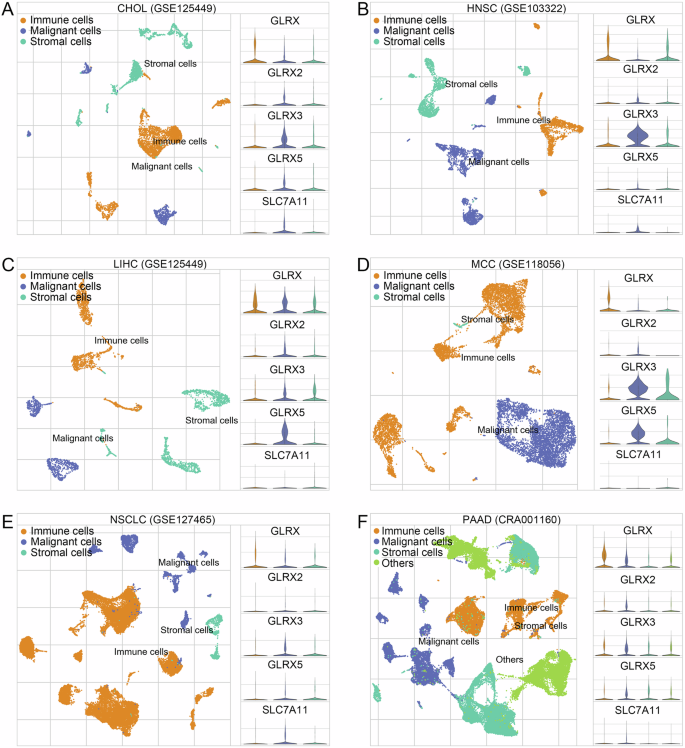
The expression patterns for SLC7A11, GLRX, GLRX2, GLRX3, and GLRX5 of malignant cells, immune cells, and stromal cells in (A) CHOL, (B) HNSC, (C) LIHC, (D) MCC, (E) NSCLC, and (F) PAAD. GLRX glutaredoxin, GLRX2 glutaredoxin 2, GLRX3 glutaredoxin 3, GLRX5 glutaredoxin 5, CHOL Cholangiocarcinoma, HNSC Head and Neck Cancer, LIHC Liver Cancer, MCC Merkel Cell Carcinoma, NSCLC Nonsmall-Cell Lung Cancer, PAAD Pancreatic Cancer.
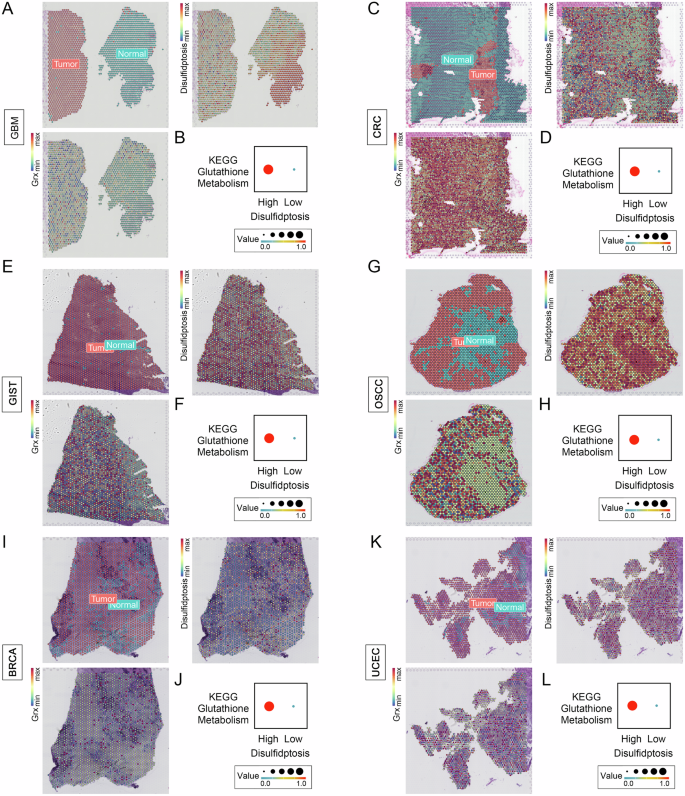
Disulfidptosis and Grx system scores spatial expression patterns at the tumor and normal spots, and glutamine metabolism differences between the high and low disulfidptosis tumor spots in (A, B) GBM (C, D) CCRC, (E, F) GIST (G, H) OSCC (I, J) BRCA, and (K, L) UCEC. GBM Glioblastoma, CRC Colon and Rectal Cancer, GIST Gastrointestinal Stromal Tumor, OSCC Oral Squamous Cell Carcinoma, BRCA Breast Cancer, UCEC Endometrioid Cancer.
Genetic variation analysis of Disulfidptosis-related genes in pan-cancer
To better decipher the effects of disulfidptosis in pan-cancer, we further studied the genetic variation of DRGs in pan-cancer. Firstly, the results of the difference analysis showed that SLC7A11 was significantly overexpressed in 10 tumors and TLN1 was reduced in seven tumors compared to normal tissues, whereas MYH9, LROORC, NCKAP1, OXSM, FLNB, NUBPL, NDUFA11, and ACTB showed differential expression in only one or two tumors, indicating that DRGs have different expression patterns in distinct tumors (Supplementary Fig. 1A). Copy number variation (CNV) frequency profile dumbbell plots showed that FLNA, TLN1, SLC3A2, NUBPL, ACTB, PRDX1, NCKAP1, and RPN1 were dominated by amplification, whereas NDUFS1, MYH9, OXSM, GYS1, SLC7A11, NDUFA11, MYH10, and FLNB were dominated by deep deletions (Supplementary Fig. 1B). Detailed mutations of DRGs in 33 tumors showed that DRGs have remarkably high CNV frequency, with heterozygous amplification being the highest (Fig. 4A). Considering that CNV is one of the main factors affecting gene expression, we investigated the relationship between the CNV of DRGs and their mRNA expression. First, we found that amplification of all 17 DRGs increased the mRNA expression of the corresponding genes, whereas deep deletion decreased mRNA expression (Supplementary Fig. 2). In addition, the results of Spearman correlation analysis between CNV and mRNA expression of DRGs in 33 tumor types showed that most CNV of DRGs were positively correlated with mRNA expression in tumor patients, and a few were negatively correlated. For example, in KIRP, CNVs of FLNA and SLC7A11 were significantly negatively correlated with mRNA expression (Fig. 4B). We further explored the survival differences among different CNV types of DRGs in 33 tumors and found that among UCEC patients, the overall survival differed significantly by different CNV types of DRGs. However, there was no significant difference in the OS of patients with BRCA, ESCA, LUA, READ, and TGCT (Supplementary Fig. 1C). In addition, to better understand the effect of somatic alterations in DRGs in patients with tumors, we further studied the single nucleotide variation (SNV) of DRGs. We found that the DRGs had remarkably high SNV frequencies, especially in UCEC, SKCM, COAD, STAD, and BLCA. For example, the mutation frequencies of FLNA in UCEC and FLNB in SKCM reached 82% and 88%, respectively. However, the SNV frequency of DRGs in some cancers was low, such as KICH, MESO, THYM, TGCT, UVM, and PCPG (Supplementary Fig. 3A). The waterfall plot, which showed the specific mutations of the top 10 DRGs with the highest mutation frequency, suggested that in DRGs, the highest mutation frequency was FLNA, which reached 24%, whereas in variant classifications, the highest percentage was missense mutations, and in 33 tumors, SKCM had the highest mutation frequency (Fig. 4C). In addition, we investigated whether SNV in DRGs affects the prognosis of tumor patients and found that the effect of SNV on the overall survival of tumor patients was not as significant as that of CNV; however, the prognosis of UCEC patients was still the most significantly affected by the mutation among all tumors (Supplementary Fig. 3B). Collectively, the above findings suggest that the mRNA expression of DRGs and overall survival is notably regulated by the genetic variation of DRGs.
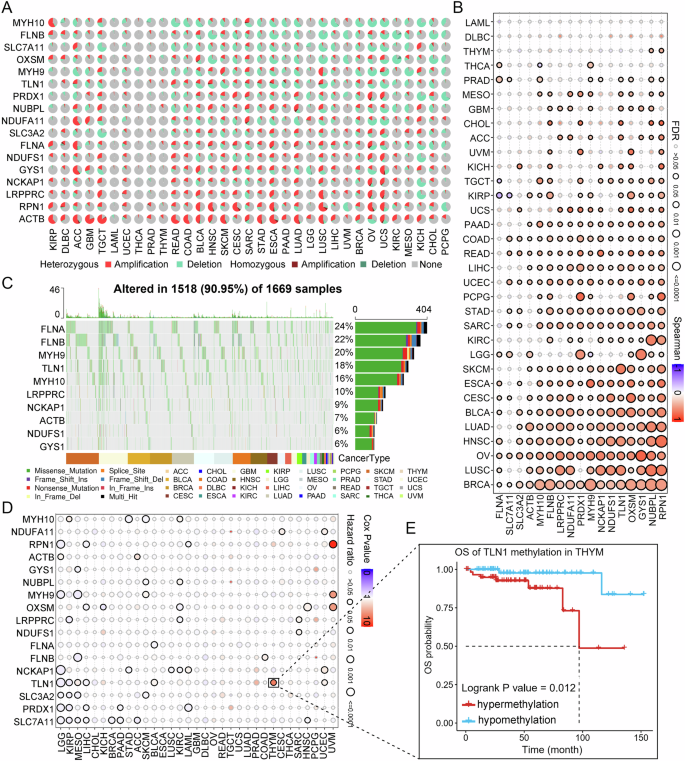
A Panorama of CNV of DRGs in pan-cancer. B Spearman correlation of CNV of DRGs with mRNA expression in pan-cancer. C Detailed information on the top ten SNV frequencies of DRGs in pan-cancer. D Overall survival difference between high and low methylation of DRGs in pan-cancer. E Relationship between high and low methylation of TLN1 in YHYM and overall survival. CNV Copy number variation, SNV Single nucleotide variation, DRGs Disulfidptosis-related genes, OS overall survival.
Genomic DNA methylation analysis of DRGs in pan-cancer
The effect of DNA methylation on gene expression and patient prognosis has been the focus of oncology research. Therefore, we further analyzed the methylation alterations of the DRGs in pan-cancer. First, we found significant differences in DNA methylation of DRGs in 14 cancer samples compared to normal samples, but there was no significant regularity (Supplementary Fig. 4A). Furthermore, Spearman correlation analysis between DNA methylation and mRNA expression revealed that DNA methylation was negatively correlated with mRNA expression in most DRGs, while ACTB methylation levels in THYM and OV showed a significant positive correlation with the expression of mRNA (Supplementary Fig. 4B). Interestingly, NCKAP1 methylation was positively correlated with mRNA expression in 10 cancers, suggesting that there may be a unique regulatory mechanism between NCKAP1 methylation and mRNA expression. The correlation analysis results between DRGs DNA methylation and overall survival of tumor patients revealed that in distinct tumors, DRGs methylation levels have different effects on patient prognosis (Fig. 4D). For example, in KIRP, TLN1 hypermethylation led to poor prognosis of patients, while in terms of TLN1 in THYM and FLNA in BLNA, hypermethylation was a protective factor for patient overall survival (Fig. 4E and Supplementary Fig. 4C). Taken together, these findings indicate that genomic DNA methylation is not only significantly altered in tumor patients but also has a significant impact on the mRNA expression of DRGs and patient prognosis.
Functional analysis of DRGs in pan-cancer
To investigate whether DRGs play other important roles in tumor development apart from disulfidptosis, we performed a GSVA analysis of 20 pathways associated with tumor malignancy using the GSCA database (Fig. 5A). The results showed that DRGs had higher scores on the activation pathways of CellCycle and Epithelial-mesenchymal transition (EMT), indicating that DRGs. In addition, we used the Enricher website to perform functional enrichment analysis of the 17 DRGs (Supplementary Fig. 5). The results showed significant enrichment of cytoskeletal, actin, and metabolic pathways, which confirmed the study by Liu et al. that disulfide binding to the cytoskeleton and actin contraction is involved in disulfidptosis during glucose deficiency. Interestingly, Amyotrophic lateral sclerosis, diabetic cardiomyopathy, and primary focal segmental glomerulosclerosis (FSGS) were also significantly enriched. In conclusion, our findings suggest that, in addition to causing cell death in a glucose-deficient state, DRGs might also promote cellular malignancy by activating the Cell Cycle and EMT pathways when the cell genetic variants occur in the cell genome and that disulfidptosis might also be involved in the formation of non-tumor diseases.
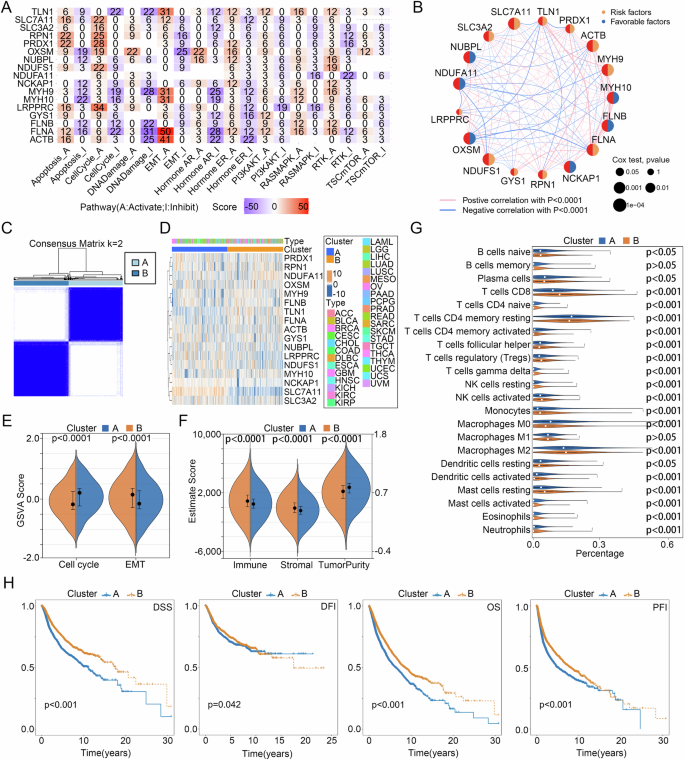
A The tumor-associated pathways GSVA score of DRGs in pan-cancer. B Prognostic value of DRGs for pan-cancer patients. C Cluster analysis, D DRGs expression heatmap, E GSVA scores of cell cycle and EMT pathways, F Estimate score, G immune cell infiltration, and H DSS, DFI, OS, and PFI differences between two disulfidptosis subtypes. DSS disease-specific survival, DFI disease-free interval, OS overall survival, PFI progression-free interval.
Identification of disulfidptosis subtypes in pan-cancer
With univariate COX regression analysis, we found that mRNA expression of 16 DRGs, except for LRPPRC, significantly affected the overall survival of patients with pan-cancer (Fig. 5B). Subsequently, based on the 16 DRGs that had a significant impact on the prognosis of tumor patients, we divided all pan-cancer patients into cluster A and cluster B of disulfidptosis subtypes using consensus clustering analysis (Fig. 5C, D). Based on the results of the above functional analysis, we analyzed the differences in EMT and CellCycle pathways between the subtypes of disulfidptosis using the GSVA algorithm, while the ESTIMATE and CIBERSORT algorithms were developed to investigate the differences in TIME between the two subtypes. The results demonstrated that Cluster A had higher CellCycle and tumor purity scores, but lower EMT, immune, and stromal scores than Cluster B (Fig. 5E, F). In addition, except for B cell memory and Macrophages M1, the level of immune cell infiltration between clusters A and B showed a significant difference (Fig. 5G). Finally, Kaplan–Meier curves, which were performed to compare the prognosis of the two disulfidptosis subtypes, indicated that Cluster B had a better prognosis than Cluster A in DSS, DFI, OS, and PFI (Fig. 5H). Taken together, the above studies revealed that the two disulfidptosis subtypes had significant differences in tumor malignancy characteristics, TIME, and prognosis, which also confirmed the association of Cell Cycle and EMT pathways with disulfidptosis. Since Cluster A is characterized by high tumor purity and poor prognosis, we defined it as the malignant type, while Cluster B is characterized by a high immune score, stromal score, and favorable prognosis, so we defined it as the immune type.
DRGs Score model development
At first, with the TCGA train cohort, 12 genes from 16 prognosis-related DRGs were screened for model construction using the LASSO regression algorithm (Fig. 6A). Subsequently, the COX regression algorithm was utilized to construct the DRGs Score model, and after deleting two genes with similar expression patterns, a model consisting of 10 genes was obtained, and the DRGs Score of all patients was calculated (Fig. 6B, Supplementary Table 3). After dividing all patients into high and low groups according to the median DRGs Score, we found that patients with LAML, DLBC, and GBM had higher DRGs Scores and almost all were in the high DRGs Score group, whereas patients with PCPG, UVM, YHYM, KICH, and THCA had lower DRGs Score and almost all were in the low DRGs Score group (Fig. 6C, D). In addition, we analyzed the relationship between the distribution of pan-cancer patients in the disulfidptosis subtypes and their DRGs Scores and found that in all three cohorts, Cluster B had a lower DRGs Score than Cluster A (Fig. 6E, F). Comparison of the prognostic differences between the high and low DRGs Score groups in the three TCGA cohorts by Kaplan-Meier curves showed that patients in the low DRGs Score group had significantly more favorable DSS, DFI, OS, and PFI than the high group in all three cohorts, which was mutually validated with the worse prognosis of the malignant type that has a higher DRGs score than the immune subtype in the disulfidptosis subtypes (Fig. 7A–C). In addition, we further analyzed the prognostic predictive power of the DRGs Score for patients with 33 cancers, and the results showed, likewise, that in multiple tumors, such as BLCA, KIRC, and LIHC, patients in the low DRGs Score group had a significantly better prognosis than those in the high group (Supplementary Fig. 6). To further confirm the reliability of the DRGs Score model in predicting the prognosis of cancer patients, we conducted a validation using four external cohorts, namely CGGA325 for Glioma, GSE17538 for CRC, GSE30219 for LUAD, and GSE19188 for NSCLC, and the results showed that the DRGs Score model still performed effectively in external cohorts (Fig. 7D).
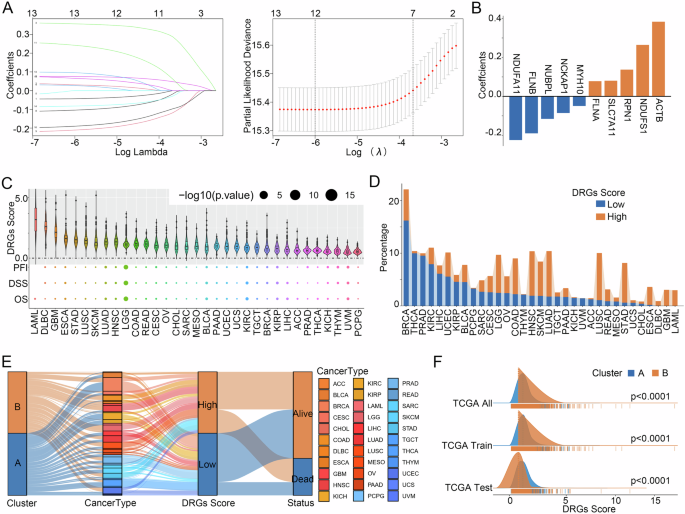
A LASSO regression screening of DRGs for model building. B Constitutive DRGs of the model and their coefficients. C Overview of DRGs Score in 33 cancers. Relationship between disulfidptosis subtypes and DRGs Score model. D, E Distribution and (F) differences of DRGs Score in the two disulfidptosis subtypes.
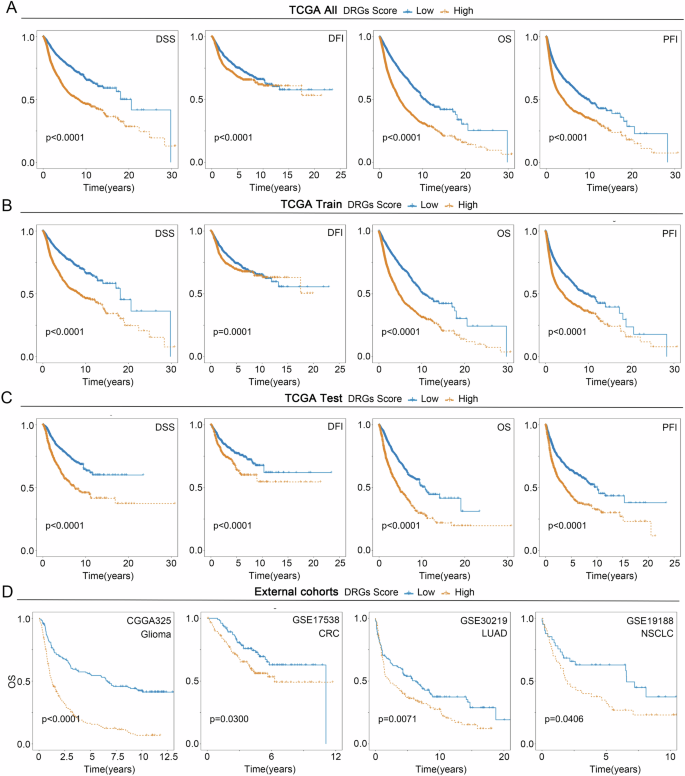
Differences of DSS, DFI, OS, and PFI between the two groups in (A) the TCGA all cohort, (B) the TCGA train cohort, (C) the TCGA test cohort, and (D) the External cohorts.
Analysis of DRGs Score model characteristics in pan-cancer
To compare the functional and pathway differences between the high and low DRGs Score groups, an enrichment analysis was performed (Supplementary Fig. 7A). The results showed that compared with the low DRGs Score group, in terms of GO, processes related to cell cycle were significantly upregulated in the high DRGs Score group, such as chromosome segregation, nuclear division, spindle, tubulin binding, and microtubule motor activity, while processes related to substance transport and metabolism were significantly downregulated, such as cellular modified amino acid metabolic process, organic acid catabolic process, CoA−ligase activity, organic acid transmembrane transporter activity, and carboxylic acid transmembrane transporter activity. In KEGG, the Cell cycle and IL-17 signaling pathway were significantly upregulated; similarly, anabolic processes, such as thyroid hormone synthesis and glycine, were significantly downregulated. Serine and threonine metabolisms. Furthermore, the GSVA algorithm was used to score 50 hallmark pathways in pan-cancer patients, and Pearson’s correlation analysis was applied to calculate the association between the DRGs Score and hallmark pathways. Interestingly, we observed a positive correlation between the DRGs Score and cell cycle- and inflammation-related pathways, such as G2M_CHECKPOINT, E2F_TARGETS, and INFLAMMATORY_RESPONSE, and a negative correlation with substance metabolism-related pathways, such as BILE_ACID_METABOLISM, ADIPOGENESIS, and PEROXISOME (Supplementary Fig. 7B). Heatmap showed the correlation between the DRGs Score and GSVA score of hallmark pathways in 33 cancers, and we found that the GLYCOLYSIS and EMT pathways were positively correlated with the DRGs Score in most tumors (Supplementary Fig. 8).
Based on the above results, we used the ssGSVA and Spearman algorithms to verify the relationship between the DRGs Score and EMT and Cell cycle (Supplementary Fig. 7C). Not surprisingly, the DRGs Score remained significantly positively correlated with EMT (R = 0.25, p < 22e-16) and cell cycle (R = 0.45, p < 22e-16). We further analyzed the relationship between DRGs Score and TIME. First, the immune subtype analysis results revealed that among the six immune subtypes, patients in the C2 subtype had the highest DRGs Score, while patients in the C3 subtype had the lowest Supplementary Fig. 7D). In addition, the results of the TIME analysis showed that the DRGs Score was positively correlated with the immune and stromal score, while negatively correlated with tumor purity (Supplementary Fig. 9A). The violin plot confirmed that the immune score and stromal score were higher in the high DRGs Score group than in the low DRGs Score group, while the tumor purity was the opposite (Supplementary Fig. 9B). For immune cell infiltration, we found that DRGs Score was positively correlated with Macrophages M0 and M1 infiltration levels and negatively correlated with Macrophages M2 in most tumors. The infiltration levels of Macrophages M0 and M1 were significantly higher in the high DRGs Score group than in the low DRGs Score group, while the Macrophages M2 were the opposite (Supplementary Fig. 9A, B). Finally, the radar plots demonstrated the Spearman correlations of DRGs scores with MSI, TMB, DNAsi, and RNAsi in 33 tumors, and the results demonstrated that the correlations of DRGs scores with genomic heterogeneity, and tumor stemness index varied in different tumors (Supplementary Fig. 9C). Taken together, these findings indicated that patients with high DRGs scores are characterized by high immune and stromal cell infiltration, high tumor malignancy, and poor prognosis.
Construction and validation of the DRGs Score-based nomogram
Considering the significant correlation between the DRGs Score and the prognosis of pan-cancer patients, we developed the DRGs Score-based nomogram to help clinicians predict the overall survival of patients in a more readable and intuitive form and validated the accuracy of the nomogram with calibration plots (Fig. 8A, B). In addition, we plotted ROC curves to investigate the ability of DRGs Score and nomogram, in three cohorts, to predict the pan-cancer patients’ overall survival over the next one, three, and five years, and the results showed that both had the same AUC values, which was 0.65 for the TCGA train cohort, 0.71 for the TCGA test cohort, and 0.66 for the TCGA tall cohort (Fig. 8C, D). To further compare the clinical utility of the DRGs Score and nomogram, we plotted DCAs for the three cohorts, and the results suggested that the nomogram had a superior net benefit compared to the DRGs Score (Fig. 8E). Together, the above studies revealed that the DRGs Score-based nomogram, which had excellent accuracy and precision, although as accurate as the DRGs Score in predicting patients’ overall survival, had considerably superior clinical utility than the DRGs Score, making it valuable in helping clinicians make decisions.
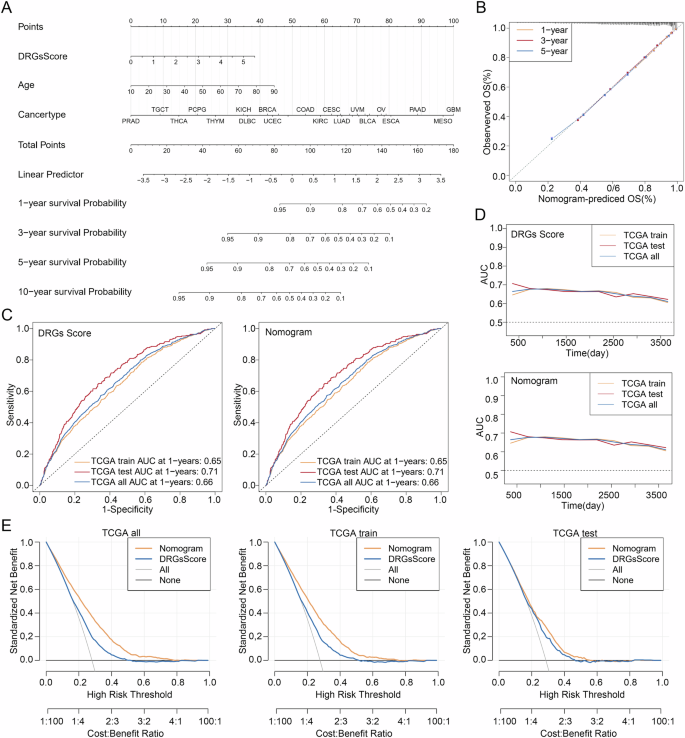
A DRGs Score-based Nomogram. B The calibration curve of the nomogram. C The ROC, D AUC, and E DCA curves of DRGs Score and Nomogram in the TCGA all, train and test cohorts. AUC Area Under the Curve, DCA decision curve analysis, ROC Receiver Operating Characteristic.
DRGs Score available to guide personalized treatment for pan-cancer patients
Using the immunotherapy datasets GSE67501 of KIRC, GSE78220 of SKCM, and IMvigor210, we analyzed whether DRGs Score could predict the immunotherapy response in oncology patients. Unfortunately, there was no significant difference in the DRGs scores between the immunotherapy response and non-response groups in the three datasets (Supplementary Fig. 10A). In addition, we used the “pRRophetic” R package to predict chemotherapeutic agents with significant differences in IC50 between the high and low DRGs Score groups and used the GDSC database to identify the targets and pathways of the drugs (Supplementary Table 4). Interestingly, among the sensitive drugs, PF-562271, which has a lower IC50 for the high DRGs Score group, and EHT-1864 and IPA-3, which have a lower IC50 for the low DRGs Score group, act directly on the cytoskeleton (Supplementary Fig. 10B, C). In addition, we observed some sensitive drugs acting on the cell cycle, which were significantly and positively correlated with the DRGs Score, such as CGP-082996, Tozasertib, and ZM447439, which were more sensitive to the high DRGs score group, and Palbociclib and CCT007093, which were more sensitive to the low DRGs score group (Supplementary Fig. 10B, C). For PF-562271, EHT-1864, and IPA-3, Autodock software was used to predict their molecular docking patterns with β-Actin, which is the major component of F-actin, and to calculate the free binding energy, which was -6.2 -6.75, and -7.09 (kcal/mol), respectively. (Supplementary Fig. 10D). Taken together, our study suggests that the DRGs Score might not be able to guide immunotherapy for pan-cancer patients, but it has significant implications for guiding personalized chemotherapy.
Discussion
Disulfidptosis, a recently discovered pattern of cell death, has been described as the formation of copious disulfide bonds between actin cytoskeletons due to excessive glutathionylation modification of actin in glucose-deficient high SLC7A11 renal and lung cancer cells, leading to cytoskeletal disruption and cell death9. Interestingly, glucose deficiency and high SLC7A11 expression, which are preconditions for the occurrence of disulfidptosis, are common in all cancers. As known, cancer cells require energy for massive replication, which is prone to glucose starvation and increases SLC7A11 expression to counteract ferroptosis caused by excess reactive oxygen species (ROS)12. Based on the above, the present study is the first time to combine computational and laboratory approaches to explore the manifestation of disulfidptosis in pan-cancer. In addition, we revealed the genomic variation and DNA methylation of disulfidptosis-related genes (DRGs) in pan-cancer through multi-omics analysis and found that the disulfidptosis subtypes and DRGs Score model developed based on DRGs expression could effectively predict survival and guide individualized treatment for pan-cancer patients.
Same as Liu et al. finding that extensive glutathionylation modification of actin cytoskeletal proteins occurs when renal and lung cancer cells undergo disulfidptosis, leading to disulfide bond accumulation, which causes abnormal actin cytoskeletal morphologies manifested as the collapse of lamellipodia and cell edge contractions, we found that β-actin was abnormally distributed at sites of high SLC7A11-expressing glucose-starved tumors compared with normal tissues by immunofluorescence staining of paraffin sections from patients with KICH, COAD, LUSC, LUAD, and LIHC9. Furthermore, it is well known that glutathionylation modification of proteins is mainly catalyzed by Grx13. Considering this, we performed single-cell and spatial transcriptome analyses of 12 cancers, and the results indicated the Grx family, which leads to the formation of excess disulfide bonds triggering disulfidptosis, is generally highly expressed in malignant tumor cells, whereas the expression of DRGs is heterogeneous in different tissues and cells, which suggests that studying DRGs genomic genetic variation would better assist us in deciphering the disulfidptosis. Collectively, through the analysis of clinical samples and single-cell spatial transcriptomic data, we investigated the manifestation of disulfidptosis in 16 tumors in a multidimensional manner and found its prevalence in pan-cancer. Obviously, disulfidptosis provides new directions for cancer research, and its value for diagnosis, prognosis, and treatment in pan-cancer has aroused our interest.
Genetic variation is the molecular basis for the development of various diseases, especially tumor cells, which constantly divide and proliferate, resulting in a large number of genetic variants14. However, DNA methylation, which is different from genomic variation, affects gene expression by changing DNA conformation and other mechanisms without altering the DNA sequence, leading to the occurrence of various diseases15. Therefore, we attempted to decipher the effects of genetic variation and methylation of DRGs on the prognosis of patients with pan-cancer by analyzing CNV, SNV, and methylation of DRGs. First, we found that DRGs had a very high frequency of CNV and SNV, and the CNV of DRGs had a significant influence not only on mRNA expression but also on the overall survival of pan-cancer patients, which was most prominent in UCEC. This suggests that the CNV of DRGs may provide a new horizon for studying the prognostic factors affecting patients with UCEC. Moreover, methylation of 16 DRGs was negatively correlated with mRNA expression in 33 tumors. Interestingly, the methylation of NCKAP1 was mainly positively correlated with mRNA expression. Although several studies have reported aberrant expression of NCKAP1 in a variety of cancers, such as non-small cell lung cancer, methylation of NCKAP1 in cancer has not been reported16. Combined with our findings, it is reasonable to believe that methylation of NCKAP1 is probably the initiating factor for aberrant NCKAP1 expression in multiple cancers, and further studies are needed to verify this hypothesis.
To investigate the molecular pathways and biological functions of A affecting the survival of pan-cancer patients, we conducted a functional analysis using a variety of methods. Firstly, in the tumor malignancy pathway analysis, we found that DRGs had a high score for the activation pathways of CellCycle and EMT. We, therefore, hypothesized that DRGs, in addition to causing disulfidptosis in glucose-starved high SLC7A11 cells, may also activate the cell cycle and EMT-related pathways to promote cellular malignancy, leading to poor prognosis in pan-cancer patients. Interestingly, our speculation was verified in the pathway analysis of both the disulfidptosis subtype and the DRGs Score model that we developed. In the disulfidptosis subtype, we found a significant difference in cell cycle and EMT scores between the two subtypes, with Cluster A having a higher CellCycle score and Cluster B having a higher EMT score. Furthermore, in the DRGs Score model we found that in GO and KEGG differential enrichment analysis, CellCycle-related processes and pathways were significantly upregulated in the high DRGs Score group compared to the low DRGs Score group. In GSVA analysis of hallmark pathways, the CellCycle-related G2M_CHECKPOINT pathway showed the highest correlation with the DRGs Score. Therefore, we validated the results of GSVA using ssGSEA analysis and, not surprisingly, the DRGs Score again showed a significant positive correlation with CellCycle and EMT pathways, with the CellCycle correlation coefficient higher than EMT, which explains the reason for the poorer prognosis of Cluster A with a higher CellCycle score than Cluster B with a higher EMT score17. Conversely, we found that in GO analysis, substance transport and substance metabolic processes showed significant down-regulation in the high DRGs Score group compared to the low DRGs Score group, and the basal plasma membrane and apical plasma membrane also showed significant down-regulation in CC. In line with the finding of Liu et al., that actin contraction leads to cell morphology alteration during disulfidptosis, it can be speculated that the abnormalities in substance transport and substance metabolic processes in the low DRGs Score group are caused by dysfunction of cell membrane transport that result from cell morphology alteration9,18. In addition, in KEGG we found that the IL-17 signaling pathway related to inflammation and immunity was significantly upregulated, and in hallmark pathways analysis, multiple pathways related to inflammation were positively correlated with the DRGs Score.
In line with the result of the functional analysis, we performed further immune analyses. In the immune cell infiltration analysis, we found that the high DRGs Score group had significantly higher levels of macrophage M0 and M1 infiltration, while the infiltration level of macrophage M2 was reversed, suggesting that higher M1/M2 macrophage polarization was present in the TIME of high DRGs Score group patients. Previous studies have shown that M1 macrophage infiltration promotes inflammation, while M2 macrophages suppress inflammation and promote tumor proliferation19. This explains the results of our TIME analysis, which showed that the low DRGs Score group had a higher immune score and lower tumor purity than the high DRGs score group. Combining the results of the immune analysis and survival analysis, we found that pan-cancer patients in the high DRGs Score group were characterized by high M1/M2 macrophage polarization, high immune cell infiltration, and poor prognosis. Interestingly, we found that the characteristics of the patients in the high DRGs score group were very similar to those of the C2 immune subtype patients found by Thorsson et al.20. Therefore, we analyzed the DRGs Score of patients in the six immune subtypes proposed by Thorsson, and the results showed, not surprisingly, that patients with type C2 had the highest DRGs Score. This also demonstrates the reliability of the DRGs Score model.
The accurate prediction of individual survival of tumor patients is not only an important reference indicator for tumor treatment but also a challenge for clinical work21. Therefore, to better utilize the DRGs Score model to help clinicians predict the overall survival of oncology patients, we established a DRGs Score-based nomogram by combining tumor type and patient age. The calibration curve showed that the nomogram we developed had excellent accuracy in predicting the overall survival of pan-cancer patients. Although the AUC values of the nomogram and DRGs Score model were the same for predicting the overall survival of patients with pan-cancer, DCA showed that the nomogram had higher clinical utility and was more helpful for clinicians to make decisions, which is the core of nomogram clinical application.
In the context of precision medicine, a new chapter on individualized treatment for tumor patients has been opened, which aims to select more beneficial targeted therapeutic drugs according to the genomic alterations of patients22. Although our study showed that the DRGs Score model could not predict the effectiveness of immunotherapy in pan-cancer patients, we found that the DRGs Score model could be effectively used to guide the individualized treatment of oncology patients. In the study by Liu et al., based on the findings of disulfide death, they concluded that GLUT inhibitors could be used to treat cancers with high SLC71A11 levels. However, in our study, with the widely used drug sensitivity algorithm analysis and molecular docking simulation, PF-562271, which was more sensitive to patients with high DRGs Score, and EHT-1864 and IPA-3, which were more sensitive to low DRGs Score group patients, were found not only to target the cytoskeleton but also showed extremely low free binding energy with β-actin, which means that they can be used to treat patients with low SLC71A11 expression, who have attenuated disulfidosis, or patients with high SLC71A11 expression but not suitable for GLUT inhibitors by targeting β-actin. In addition, based on our finding that DRGs were significantly correlated with the cell cycle pathway, we screened sensitive drugs that act on the cell cycle, such as Tozasertib and Palbociclib, for individualized treatment of patients with pan-cancer in the high and low DRGs Score groups, respectively. There are some limitations to our study. First, our findings were not validated in a large prospective clinical trial. In addition, the number of DRGs is small because disulfidptosis is a newly discovered form of cell death. Finally, we failed to test the DRGs Score model using clinical samples, owing to conditional limitations. These constraints will be included in the next study.
In summary, in this paper, we reveal for the first time the importance of disulfidptosis in pan-cancer research by combining multi-omics, single-cell analyses, spatial transcriptome analyses, and clinical specimens validation, and develop a disulfidptosis subtypes and DRGs Score model, which can assist clinicians in accurately predicting overall survival and guiding individualized treatment for pan-cancer patients.
Methods
Tumor patient mRNA sequencing data collection
The mRNA sequencing (mRNA-seq) and clinical data of patients with cancer were collected from The Cancer Genome Atlas (TCGA) (https://portal.gdc.cancer.gov/), Gene Expression Omnibus (GEO) (https://www.ncbi.nlm.nih.gov/geo/), Chinese Glioma Genome Atlas (CGGA) (http://www.cgga.org.cn/) databases, and the IMvigor210CoreBiologies R package. First, we obtained the mRNA-seq and clinical data of 19052 patients among 33 cancers in the TCGA database as the TCGA all cohort and randomized, according to the ratio of 7 to 3, the 19,052 pan-cancer patients into the TCGA train cohort (7669/ 10952) and the TCGA test cohort (3283/ 10952). Moreover, in the GEO database, five datasets, namely GSE17538 for 218 colorectal cancer (CRC), GSE30219 for 278 lung adenocarcinoma (LUAD), GSE19188 for 82 nonsmall-cell lung cancer (NSCLC), GSE67501 for 11 renal cell carcinoma (RCC), and GSE78220 for 28 melanoma patients were downloaded. The CGGA325 cohort of 313 glioma patients was acquired from the CGGA database. Finally, the IMvigor210 cohort of 298 tumor patient data was downloaded using the R package “IMvigor210CoreBiologies.”
Clinical specimens
To obtain clinical specimens, three samples of each type of cancer tissue and their corresponding paired normal tissues, including COAD, LUAD, LUSC, KICH, and LIHC, were obtained from The Second People’s Hospital of Lianyungang and Oncology Hospital of Lianyungang. Clinicopathological details of the specimens are listed in Supplementary Table 5. Ethical approval was obtained from the Clinical Research Ethics Committee of the Second People’s Hospital of Lianyungang and Oncology Hospital of Lianyungang as well as Shanghai Tongji Hospital, following the Declaration of Helsinki guidelines. Informed written consent was obtained from the patient for the publication of this report and any accompanying images.
Immunofluorescence
Paraffin sections from clinical patients were deparaffinized in xylene and rehydrated using a graded ethanol series. Antigen retrieval was performed by heating the sections in 10 mM sodium citrate buffer (pH 6.0) in a pressure cooker. The sections were blocked with 5% bovine serum albumin in phosphate-buffered saline (PBS) for 1 h at room temperature. Primary antibodies against SLC71A11 (#ab307601; Abcam, 1:500), β-actin (#ab8226; Abcam, 1:1000) and GLUT1 (#ab115730; Abcam, 1:500) were incubated overnight at 4 °C. The sections were then incubated with the appropriate secondary antibodies conjugated with fluorophores or horseradish peroxidase for 1 h at room temperature. DAPI was used for nuclear staining. Confocal images were acquired using an Olympus FluoView FV1000 confocal microscope. At least three random fields were evaluated in three sequential sections per human in each group. Ethics approval for the study was obtained from the Clinical Research Ethics Committee of the Second People’s Hospital of Lianyungang & the Oncology Hospital of Lianyungang and Shanghai Tongji Hospital.
Single-cell analysis
Utilizing the Tumor Immune Single-cell Hub 2 (TISCH2) database (http://tisch.comp-genomics.org/), a single-cell data analysis platform, six single-cell datasets in the GEO and Genome Sequence Archive database were analyzed, including GSE125449 for cholangiocarcinoma (CHOL) and liver cancer (LIHC), GSE103322 for head and neck cancer (HNSC), GSE118056 for Merkel cell carcinoma (MCC), GSE127465 for nonsmall-cell lung cancer (NSCLC), and CRA001160 for pancreatic cancer (PAAD)23. The analysis procedure is to click on the Gene option, enter SLC7A11, GLRX, GLRX2, GLRX3, and GLRX5, and start the analysis with the default settings.
Spatial transcriptome analyses
Three publicly available spatial transcriptome datasets, including glioblastoma (GBM), colon and rectal cancer (CRC), gastrointestinal stromal tumor (GIST), oral squamous cell carcinoma (OSCC), breast cancer (BRCA), and endometrioid cancer (UCEC), were analyzed to investigate the manifestations of disulfidptosis in pan-cancer24,25,26. Dimensionality reduction, clustering, and visualization of spatial transcriptome data were performed using the default parameters of the “Seurat” R package. Disulfidptosis and glutaredoxin (Grx) scores were calculated using single-sample Gene set enrichment analysis (ssGSEA) algorithms of the “GSVA” R package. KEGG glutamine metabolism pathway scores for each point were measured with the “scMetabolism” R package.
Genetic variation, DNA methylation, tumor heterogeneity, and tumor stemness analysis
Differential expression, copy number variation(CNV), single nucleotide variation(SNV), and DNA methylation analysis of disulfidptosis-related genes (DRGs) were performed using the Gene Set Cancer Analysis (GSCA) database (http://bioinfo.life.hust.edu.cn/GSCA/), which is a network cancer analysis platform based on TCGA database27. After entering the 17 DRGs into the website, click on “Select All Cancers” and select the “Expression” and “Mutation “ modules to start the analysis. The details can be found in the GSCA database. The DNA stemness index (DNAsi), RNA stemness index (RNAsi), and microsatellite instability (MSI) data of patients in the TGCA cohort were obtained from previous studies and the tumor mutation burden (TMB) data of pan-cancer patients were downloaded from the Genomic Data Commons Data Portal (https://portal.gdc.cancer.gov/)28,29. The correlation between the DRGs Score and MSI, TMB, DNAsi, and RNAsi in 33 tumors was determined by Spearman correlation analysis.
Disulfidptosis subtypes identification and DRGs Score Model establishment
First, we performed univariate COX regression using the “survival” R package (v3.4-0) and identified 16 DRGs that had a significant effect (p < 0.05) on the survival of patients with pan-cancer. Then, the consensus clustering analysis was conducted based on the expression of 16 prognosis-related DRGs for each pan-cancer patient with the “ConsensusClusterPlus” R package (v1.60.0), and the cumulative distribution function (CDF) curve showed that k = 2 as the best clustering pattern. In addition, the DRGs Score Model consisting of 10 DRGs was built using LASSO regression combined with the COX regression algorithm in the TCGA train cohort, and the coefficient β of each gene constituting the model was obtained. The DRGs Score for patients was formulated as DRGs Score=({sum }_{i=1}^{n}{beta }_{i}{{Exp}}_{i}), where n is the number of DRGs constituting the model, β is the coefficient of the corresponding gene, and Exp is the expression of the corresponding gene.
Functional and pathway analysis
Gene set variation analysis (GSVA) of DRGs and pathways associated with tumor malignancy was performed using the GSCA database. Gene Ontology (GO) and pathway enrichment analyses of DRGs were conducted using the Enricher database (https://maayanlab.cloud/Enrichr/). In the disulfidptosis subtypes and DRGs Score model analysis, GSVA and ssGSEA of cell cycle, epithelial-mesenchymal transition (EMT), and hallmark pathways analysis were performed using the “GSVA” R package (v1.44.5)30,31. Differentially expressed genes (DEGs) between the high and low DRGs Score groups were filtered using the R package “limma” (v3.40.6) with a screening threshold of adjust.P Value < 0.05 and |log2FC | >1, and the GO and Kyoto Encyclopedia of Genes and Genomes (KEGG) enrichment analysis of DEGs was conducted with the R package “ClusterProfifiler” (v4.7.1.002).
Immunity analysis
The tumor immune microenvironment (TIME) score and immune cell infiltration level of each pan-cancer patient were calculated utilizing the ESTIMATE and CIBERSORT algorithms, respectively32,33. Immune subtypes of TCGA pan-cancer patients were obtained from a previous study20. The correlation between the DRGs Score and TIME score, and immune cell infiltration level was determined by Spearman correlation analysis.
Building and validating the DRGs Score model-based Nomogram
With the “rms” R package (v6.3-0), the nomogram combining tumor type, patient age, and DRGs score was created, which was used to help clinicians predict the overall survival of oncology patients, and the calibration curve was plotted using R packages “survival” (v3.4-0) to check the accuracy of the nomogram. The time-dependent receiver operating characteristic (ROC) curves for the DRGs Score model and nomogram were calculated and plotted by the “timeROC” R package (v0.4) and the decision curve analysis (DCA) curves of the DRGs Score model and nomogram were drawn by the “ggDCA” R package (v1.2).
Drug screening and molecular docking
For the purpose of using the DRGs Score model to guide individualized treatment of oncology patients, the “pRRophetic” R package (v0.5) was used to screen for sensitive chemotherapeutic agents for the high and low DRGs Score groups. The Genomics of Drug Sensitivity in Cancer (GDSC) database (https://www.cancerrxgene.org/) was used to retrieve the targets and pathways of the screened drugs34. Molecular docking and free binding energy calculations of the drugs with β-actin were performed using AutoDockTools (v1.5.7) software and PyMOL software was used to visualize the results. The PubChem database (https://pubchem.ncbi.nlm.nih.gov/) was used to obtain the drug structures, and the structure of β-actin was obtained from a previous study35.
Statistical analyses
Statistical analyses were conducted with the R software (v4.2.1). Pearson and Spearman algorithms were used to perform the correlation analysis. The analysis of survival differences in disulfidptosis subtypes and DRGs Score Model was performed with Kaplan-Meier analysis, and p values were calculated using the log-rank test. Differences between the two groups in other analyses were calculated by the Wilcoxon test. A p-value < 0.05 was considered statistically significant. *p < 0.05, **p < 0.01, ***p < 0.001, and ****p < 0.0001 for significance level.

Responses