Particle-particle interface corrosion of cold sprayed copper in dilute nitric acid solutions: geometry-controlled corrosion mechanism

Introduction
Cold spray (CS) deposition is a solid-state deposition technique that finds applications in additive manufacturing (AM)1,2, coating3, and repair of damaged components1,4. Aluminium and copper flanges1, cones and gears1, and various other complex structures5 have been successfully fabricated by CSAM. During the CS process, feedstock particles are accelerated by compressed gas and impinged onto a substrate at high velocity. Bonding between the particles and the substrate is established via the severe plastic shear deformation induced by the high kinetic energy of the particles6, in contrast to the thermal energy employed in thermal spray and other AM techniques. Thus, feedstock particles remain solid throughout, minimizing oxide formation7. The surface oxide films on the particles shatter and are mostly ejected upon impact, yet some of their debris is incorporated as inclusions at the particle-particle interfaces (PPIs)8,9, which are the major sources of oxygen in CS materials. There is a wealth of literature on the characterization and simulation of the oxide break-up process and the effect of the subsequently incorporated inclusions8,9,10,11,12,13, which suggests that the critical velocity of deposition, the deposition efficiency, and the bonding strength are subject to the influence of the surface oxide film and/or the incorporated oxide inclusions14,15.
Oxide inclusions are commonly considered to be microstructural defects that can decrease corrosion resistance16,17. This raises concerns about whether the PPIs in CS materials, where the oxide inclusions universally exist, are prone to corrosion, especially in aggressive environments. Despite most studies having revealed unremarkable to marginally increased corrosion damage at the PPIs3,18,19,20, a recent study showed that CS Cu, a candidate for part of the corrosion-resistant coating of Canadian-designed used nuclear fuel containers (UFCs)21, exhibited a higher degree of reactivity at the PPIs when exposed to naturally aerated dilute nitric acid (HNO3) solution22. HNO3, an oxidant, may form due to the radiolysis of humid air23 within a deep geological repository where the UFCs will be stored. Its presence may contribute to the corrosion of the UFCs, making it essential to understand the corrosion mechanisms of CS Cu in HNO3.
Copper corrosion in nitric acid solutions has been a topic of study for over a century. Millon first described the process as involving autocatalytic cycles in 184224. Russel and Veley proposed that the catalytic activity of nitric acid was due to the presence of a small amount of nitrous acid (HNO2), which reacted with the metal to initiate the process25,26. Acknowledging the importance of HNO2, Bancroft criticized this view, arguing instead that HNO2 activates HNO3 rather than directly reacting with the metal24. Evans reviewed earlier studies and suggested possible pathways for catalytic cycles27. Although HNO2 was long regarded as the catalyst driving catalytic corrosion in the Cu-HNO3 system28,29, more recent studies by Turnbull and colleagues have shown that Cu+ is, in fact, the catalyst responsible30,31,32. Their experiments demonstrated that the O-free Cu was inert in HNO3 solutions unless dissolved oxygen was present. Upon introducing oxygen, the oxygen reduction reaction (ORR) produced Cu+, which then activated NO3− to form HNO2—a strong oxidant for Cu capable of regenerating Cu+, thereby initiating the catalytic corrosion cycles30,31,32.
In this work, we studied the corrosion behaviour of three types of Cu, namely O-free Cu, low-temperature (LT, 350 °C) annealed CS Cu, and high-temperature (HT, 600 °C) annealed CS Cu, by electrochemical methods in dilute HNO3 solutions with various oxygen contents. The microstructure of the CS Cu specimens was characterized by electron backscatter diffraction (EBSD). The corrosion morphology was characterized by scanning electron microscopy (SEM) and X-ray micro-computed tomography (μ-CT) and compared with Auger electron spectroscopy (AES) elemental mappings acquired on pristine surfaces prior to exposure to HNO3 solutions. The gaseous products generated during PPI corrosion were analysed by gas chromatography-mass spectrometry (GC-MS). The results obtained are consistent with the mechanisms of Cu+-induced catalytic corrosion reactions in the Cu-HNO3 system, while also highlighting a unique corrosion mechanism associated with the geometry of the corrosion sites, which is determined by the form and distribution of the oxide inclusions in CS Cu.
Results
Microstructure characterization
Figure 1 shows the microstructural characteristics of the LT and HT CS Cu obtained via EBSD. Grain orientation and grain size are apparent in the inverse pole figures (IPFs) and image quality (IQ) maps, Fig. 1a, b. Annealing twins were observed for both LT and HT CS Cu. For LT CS Cu, ultrafine grains are concentrated around the PPIs where the zero-solution pixels, indicating non-indexable areas, are primarily situated, outlining the particles. This is not obvious for the HT CS Cu, where PPIs are not noticeable, and grains are generally visually larger than in the LT CS Cu. Moreover, zero-solution pixels are much less common on HT CS Cu and are primarily present in clusters.

a IPFs for LT and HT CS Cu. b CSL boundaries superimposed on IQ maps for LT and HT CS Cu. Green pixels are zero-solution areas where electron diffraction patterns could not be indexed. c The fractions (of length) of the CSL boundaries with Σ values of 3, 9, and ≥11 (top) and the misorientation angle (the lower two) for LT and HT CS Cu.
Grain boundary characteristics, including coincident site lattice (CSL) boundary designations and misorientation angles, were extracted from the EBSD results and plotted in Fig. 1c with the CSL boundaries also superimposed with the IQ maps, Fig. 1b. On both LT and HT CS Cu, CSL boundaries are uniformly distributed and account for more than half the total grain boundary length, among which the Σ3 boundaries are predominant, likely due to their lower energy compared to other Σ boundaries. Annealing at a higher temperature decreased the abundance of the small angle boundaries from ~10% to ~5% by length and resulted in a slight increase in the number of Σ3 boundaries.
AES elemental mapping was used to characterize the chemical composition of the oxide inclusions. For LT CS Cu, voids were observed along PPIs, where AES elemental mapping indicated an O enrichment, Fig. 2a1–3. This indicates that the remains of the particles’ surface oxides are located at the PPIs. For HT CS Cu, the argon sputtering process resulted in some topographic features, which have minor effect on the contrast that can be easily distinguished33. No PPIs can be clearly distinguished in the SEM image. Instead, several dark spots are observed, which are confirmed by AES elemental mapping to be Cu oxide inclusions, Fig. 2b1–3.
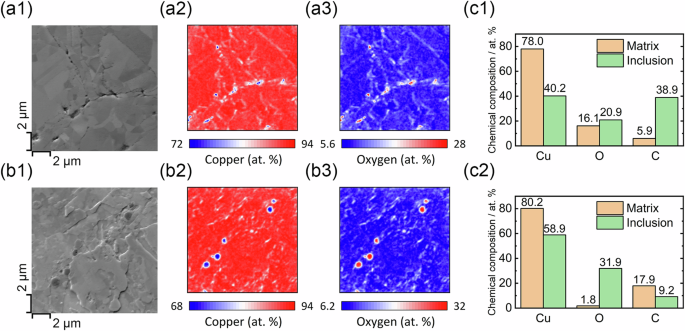
SEM images and the corresponding AES elemental maps for a1–3 LT and b1–3 HT CS Cu. The chemical compositions of the matrix and inclusions quantified from the Auger electron spectra for LT (c1) and HT (c2) CS Cu.
The chemical composition of the oxide inclusions and the surrounding matrix was obtained by quantifying the Auger electron spectra and compared, Fig. 2c1, 2. For both specimens, the quantification yielded a Cu/O ratio close to two, implying that the trapped inclusions are cuprous oxide (Cu2O). The carbon detected by AES can be attributed mainly to the adventitious carbon, although that for the inclusions may come partially from organic contamination present on the surfaces of the feedstock particles before cold spraying. The presence of these carbon signals did not interfere with the quantifications, as the Cu-to-O ratio remained roughly the same (2:1) regardless of the amount of carbon present. Hence, it can be generalized that annealing at a higher temperature does not alter the composition of the oxides but consolidates them and decreases the number of voids at the PPIs, consistent with previous studies9.
Electrochemical behaviour
Figure 3 shows representative corrosion potential (Ecorr) and polarization resistance (Rp) values recorded on the three types of Cu under three different aeration conditions, namely naturally aerated solution (NA), Ar-sparged solution (AS), and a solution placed inside an anaerobic chamber (AC). A commonality for all the measured Ecorr transients is the initial high values, which quickly dropped within the first half hour. During this high-Ecorr period, gas bubbles were visually observed on all the specimens. Following the drop, Ecorr values for LT CS Cu and O-free Cu showed a steadily descending trend accompanied by a modest increase in Rp indicating that corrosion was cathodically controlled. The Ecorr of LT CS Cu was always higher, and Rp consistently lower, than those of the O-free Cu under all three conditions, suggesting a higher corrosion rate for LT CS Cu driven by the cathodic reaction. A broad peak was observed at ~5 h for O-free Cu under NA condition, accompanied by a decrease in Rp values, indicating an increased corrosion rate. We suspect this was due to surface coverage by initially generated gas bubbles, which later detached, exposing a relatively fresh surface and leading to an increase in corrosion rate, rather than being due to localized corrosion events. This hypothesis is consistent with the transient increase in Ecorr, as an increase in available surface area would enhance the cathodic half-reaction rate, necessitating a matching increase in the anodic half-reaction; one would expect the initiation of localized corrosion to result in a transient decrease in Ecorr. We repeated this experiment twice, and no such peak was observed again. Given the lack of passivity in the Cu-HNO3 system, we conclude that the observed peak likely resulted from extrinsic factors, such as the proposed bubble detachment, that do not frequently occur.
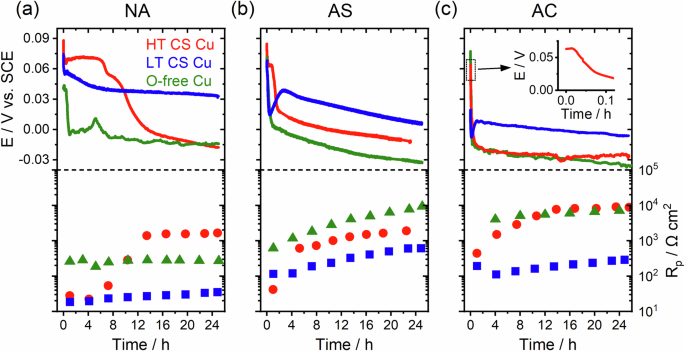
Ecorr and Rp values recorded on O-free Cu (green), LT CS Cu (blue), and HT CS Cu (red) in 0.1 M HNO3 solutions under a NA, b AS, and c AC conditions. All panels have the same Ecorr scale, so labels are only shown in a. The same applies to Rp panels with the labels only shown in c. The inset in c shows the short plateau of Ecorr measured on HT CS Cu.
Gas bubbles stopped forming on the O-free Cu after the initial drop in Ecorr but continued on the LT-CS Cu, see Supplementary video 1. The difference in Ecorr between LT CS Cu and O-free Cu is ~50 mV for NA and decreased to ~40 mV and ~30 mV under AS and AC conditions, respectively. Rp values for O-free Cu are roughly an order of magnitude higher than those of the LT CS Cu. These higher Rp values (lower corrosion rates) for O-free Cu under AS and AC conditions are consistent with previous studies showing that Cu corrosion in HNO3 solution was minimal in the absence of dissolved oxygen30.
In contrast, HT CS Cu experienced transitions, manifested by a decrease in Ecorr and an increase in Rp, after a period of time which was longest for NA and shortest for AC conditions (Fig. 3a–c). Ecorr was high, and Rp values were low before the transition, after which Ecorr dropped, accompanied by an increase in Rp by a factor of up to 80. This transition was observed to be concomitant with the discontinuation of gas bubble generation. These results point to a pronounced decline in corrosion kinetics, which is clearly cathodically controlled. For exposure periods beyond ~10 h under AC conditions, HT CS Cu and O-free-Cu exhibited similar Ecorr and Rp values.
Corrosion morphology characteristics
The corrosion morphology of the CS Cu specimens after immersion was characterized by SEM, Fig. 4. The corrosion morphology of LT CS Cu under NA showed the same features as previously reported22, with evident corrosion at PPIs, Fig. 4a1, 2. Despite corrosion being similarly localized on HT CS Cu under the same conditions, Fig. 4b1, 2, instead of the trench-like damage, PPI corrosion was in the form of cavities, with more limited corrosion at the PPIs. Characterization by µ-CT (Fig. 4g) revealed that corrosion penetrated along PPIs to a depth of ~75.5 μm for LT CS, compared to a maximum depth of ~37.7 μm for the HT CS Cu. Within the interior of the particles, corrosion caused extensive crystallographic etching, Fig. 4a2, b2, the extent of which depended on the grain orientation. This is consistent with the grain-dependent corrosion morphology of O-free Cu under similar conditions30.
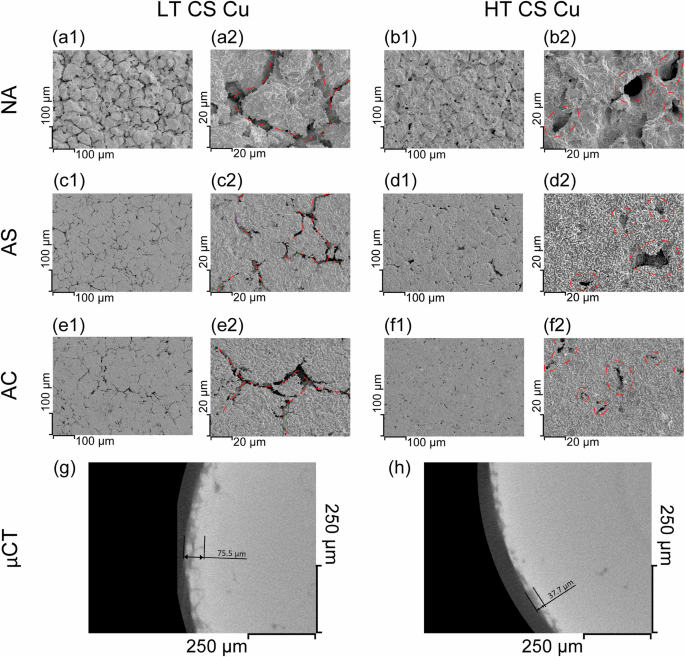
a1, 2, c1, 2, and e1, 2 SEM images of LT CS Cu corroded under NA, AS, and AC conditions, respectively. b1, 2, d1, 2, f1, 2 SEM images of HT CS Cu corroded under NA, AS, and AC conditions, respectively. g, h μCT characterization of the LT and HT CS Cu under NA conditions. Dark contrast areas in g and h in the interior of the materials are voids originally present. Red dashed lines indicate either PPIs (for LT CS Cu) or cavities (for HT CS Cu) in the high-magnification SEM images.
Corrosion of CS Cu under AS and AC conditions further highlighted the differences between LT and HT CS Cu, Fig. 4c1, 2–f1, 2. The matrix, as expected, suffered from minimal corrosion due to the limited amount (AS) or quasi-absence (AC) of oxygen. This is what we should expect, since it has been demonstrated that NO3− is not an effective oxidant for Cu30. Moreover, unlike its behaviour on some reactive metals27,34,35, the hydrogen evolution reaction requires significant overpotentials on a Cu electrode in nitric acid36, so metal oxidation coupled to proton reduction should not be expected to corrode the CS Cu matrix. Yet PPI corrosion still occurred. The form and distribution of oxide inclusions and corrosion damage on both LT and HT CS Cu were coincident, suggesting at first glance that the damage observed on CS Cu could simply be attributed to the dissolution of the Cu2O inclusions in the acidic environment. Indeed, Cu2O is soluble, albeit slightly37, at pH 1 (i.e., the pH value of the 0.1 M HNO3 solution used in this work). However, the width of the oxide inclusions, as characterized by AES, was in the sub-micrometre range, whereas the width of the corroded PPI locations, estimated visually, was at least several micrometres and some corrosion sites were up to ~20 μm wide. This suggests that a corrosion process was involved in causing the damage to the Cu matrix surrounding the PPIs, in addition to any oxide dissolution that may have occurred.
Gas formation during PPI corrosion
The formation of gas coincided with the periods of high Ecorr, indicating its important role in ascertaining the PPI corrosion mechanism. To investigate this, we performed headspace analysis to determine the gas composition. Gas generated during corrosion of LT CS Cu in 0.1 M HNO3 in air- and Ar-filled vials was collected from the cell headspace and analysed using GC-MS.
As shown in the chromatogram, Fig. 5a, two peaks were detected for both air- and Ar-filled vials. For the air-filled vial, based on the mass-to-charge ratio (m/z), N2+ (m/z = 28) was identified as the principal species with O2+ (m/z = 32), O+ (m/z = 16), N+ (m/z = 14), and Ar+ (m/z = 40) also detected, indicating the presence of N2, O2, and Ar, Fig. 5b1, which are the main components of air. For the second peak (b2), the mass spectrum indicated the presence of N2O (with a trace amount of H2O), with the species detected being N2O+ (m/z = 44), NO+ (m/z = 30), N2+, O+, and N+, Fig. 5b2. For the Ar-filled vial, the gases detected were Ar and N2O, corresponding to the first and second peaks in the chromatogram, Fig. 5c1, c2.
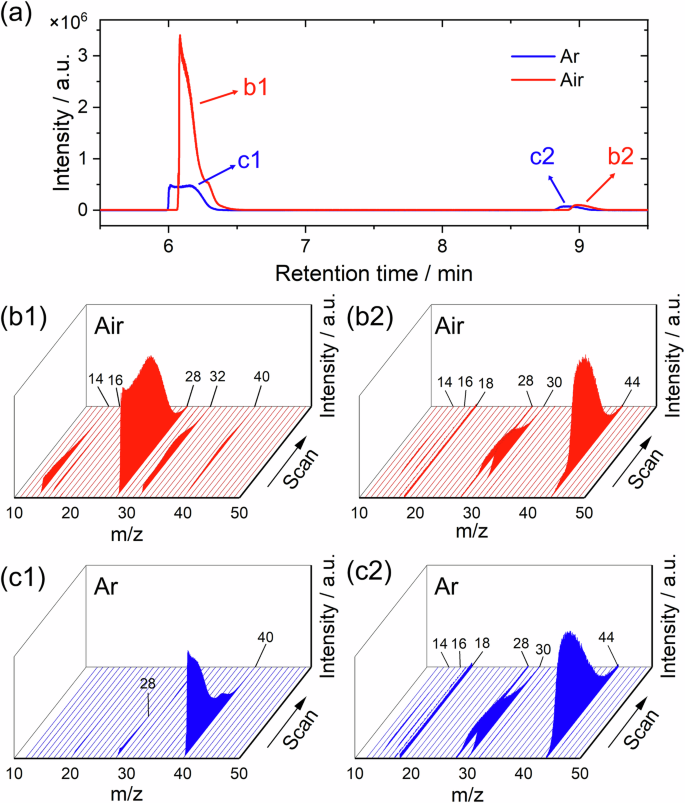
a Chromatogram and b, c mass spectra of the gas generated during corrosion of CS Cu in 0.1 M HNO3 in b1, 2 Air-filled and c1, 2 Ar-filled glass vials.
Closer inspection of the mass spectra showed that a small volume of NO was present in both air- and Ar-filled vials. Figure 6 shows the measured intensities of the m/z of 12 (corresponding to C+), 30 (corresponding to NO+) and 44 (corresponding to N2O+) as a function of retention time for both cases. Here the m/z = 44 peak is assigned to N2O instead of CO2 due to the absence of C+ with a m/z of 12 in the gas collected in the air-filled vial and is confirmed by the mass spectrum collected in the Ar-filled vial where CO2 was absent.
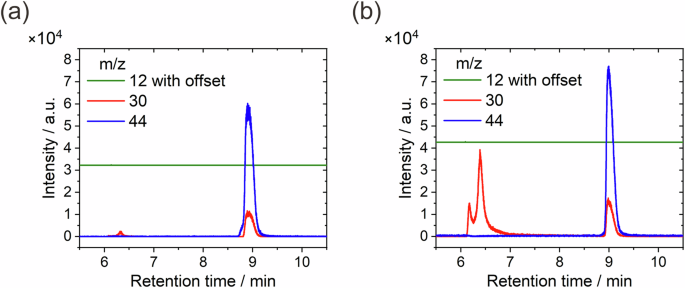
a Air-filled vial, b Ar-filled vial.
We noticed that at the retention time where the ambient gas (air or Ar) was detected, approx. 6–7 min, peaks for m/z = 30 were observed without the detection of species with m/z = 44. This indicates the presence of NO instead of N2O. The second peak with m/z = 30 was accompanied by a peak for m/z = 44 in both cases, indicating the presence of N2O. Although quantitative analysis was not performed to determine the exact amounts of NO and N2O, it can be roughly estimated from the intensities of the mass spectra that the amount of NO present under Ar ambience was greater than that under air ambience. We can conclude that the final gas products during CS Cu corrosion in 0.1 M HNO3 were N2O and NO.
Discussion
Based on these analyses, we propose a corrosion mechanism for PPI corrosion on CS Cu by incorporating the Cu-Cu+-NO3−-HNO2 and Cu-Cu+-Cu2+ catalytic corrosion cycles reported previously for O-free Cu22,30,32.
Initially, dissolved O2 is the effective oxidant for Cu in aerated HNO3 solution, leading to the production of Cu+ by reaction (1):
In anoxic solutions, an initial amount of Cu+ may be produced by dissolution of Cu2O, present in an air-formed oxide or as oxide inclusions in the material.
The Cu+ can then activate NO3− via reaction (2), leading to production of HNO2, a strong oxidant for Cu,
and, under free corrosion conditions32, reaction (3),
to produce the gaseous product, NO. The Cu2+ produced by reaction (2) then reacts with Cu through the comproportionation reaction, reaction (4):
Finally, HNO2 is known to be unstable in acidic solutions and decomposes via reactions (5) and (6):
The rapid reaction of HNO2 at the Cu surface via reaction (3) limits the extent of HNO2 loss via the homogeneous reactions (5) and (6).
Both reactions (3) and (4) result in the regeneration of Cu+, thereby completing two catalytic corrosion cycles, allowing Cu corrosion to continue without the involvement of oxygen. The contribution of the Cu-Cu+-Cu2+ cycle to the corrosion process is difficult to quantify experimentally. According to the proposed mechanism, NO is produced by reaction (3), and this can be used as a qualitative indicator of the Cu-Cu+-NO3−-HNO2 corrosion cycle. As analysed by GC-MS, the gas formed during Cu corrosion in both aerated and deaerated 0.1 M HNO3 was mainly N2O, with some NO. Although N2O could be a product of NO reduction by Cu38, it is more likely that its generation is a consequence of the vapour phase reaction involving NO (reaction (7)), as reported elsewhere39:
NO2(g) generated through reaction (7) would react rapidly with water vapour and gaseous HNO2, reactions (8)-(9)39:
Therefore, the detected gases were N2O with minor amounts of NO. Despite these complexities, gas formation during Cu corrosion in HNO3 is a clear sign of the activation of NO3− to HNO2 and the subsequent reduction of HNO2.
The proposed mechanism for the corrosion of CS Cu in HNO3 is illustrated schematically in Fig. 7. Initially, the air-formed surface Cu2O film40, which also existed on the O-free Cu, served as a reservoir of Cu+, triggering the catalytic corrosion cycles, Fig. 7a I. NO3− was possibly activated by the Cu+ produced through the chemical dissolution of Cu2O and/or by a direct electrochemical reaction with Cu2O. The latter may have been more favourable as Cu2O was converted to the much more soluble Cu2+41. Nonetheless, HNO2 was generated, and the catalytic cycles were initiated by the reaction of HNO2 with Cu, which regenerated Cu+. The occurrence of these catalytic corrosion cycles is indicated by the initially high Ecorr and the gas formation on all types of Cu used, including the O-free Cu.
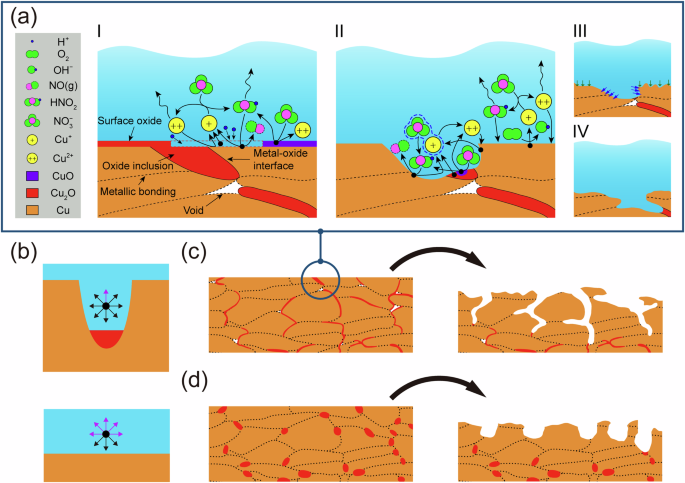
a The PPI corrosion mechanism for CS Cu in HNO3; b simplified models showing the diffusion pathways for species under different geometrical conditions; the corrosion process for c LT, and d HT CS Cu. Arrows in a III indicate the corrosion propagation caused by the ORR (green) and catalytic cycles (blue). Arrows in b represent possible diffusion directions, with the purple and black ones denoting directions into the bulk solution and to the Cu surface, respectively.
The rapid initial drop in Ecorr could have been due to the diffusive loss of corrosive species (HNO2 and Cu2+) to the bulk of the solution, leading to a decrease in available oxidant, and thus a decrease in Ecorr. Additionally, the adsorption energy for NO3− on the Cu surface is more negative than that of the corrosive NO2− according to density functional theory calculations42. Consequently, NO3− can compete for surface adsorption sites, thereby limiting NO2− adsorption, and leading to a decrease of Ecorr. During this period, the ORR contributed to Cu corrosion if oxygen was present. This support was minimal, as indicated by the substantially lower Ecorr observed on the O-free Cu under NA conditions, Fig. 3a, when O2 was an effective cathodic reagent30. Although coupling to the ORR would oxidize Cu to Cu+, offering new catalysing species for NO3– reduction, this process would have been limited by diffusion and the competitive adsorption processes.
On O-free Cu, Ecorr dropped to low values, accompanied by the discontinuation of gas formation, indicating the waning of the catalytic corrosion cycles. Corrosion was then dictated by the ORR under NA conditions. Under AS and AC conditions, the corrosion rate was very low, with Rp (AS) initially lower than Rp (AC) when a small dissolved oxygen level was maintained. However, Rp (AS) continuously increased to a value that was effectively similar (but possibly slightly greater) than Rp (AC). This could be attributed to the convection induced by Ar sparging, which would have facilitated the diffusion of corrosive species (HNO2) away from the Cu surface and enhanced, again by diffusion, the surface adsorption of the passivating species (NO3−).
However, corrosion of LT CS Cu continued at high rates (low Rp values) after the initial drop in Ecorr, even under AS and AC conditions. In addition, the generation of gas bubbles continued, demonstrating the ongoing production of N2O and NO (see Supplementary video 1). This implies that the catalytic corrosion cycles remained active and were responsible for the higher corrosion rate, strongly suggesting that the Cu2O inclusions along the PPIs continued activating NO3−.
These observations also suggest that the confined geometry of the corrosion sites, created by the (electro)chemical dissolution of the inclusions, plays a significant role. As illustrated in Fig. 7a II, the (electro)chemical dissolution of the inclusion, either as Cu+ or Cu2+, creates a confined geometry (a cavity) from which the transport of species is restricted. A simplified model is presented in Fig. 7b. Inside the confined space, a corrosive species has a limited chance of diffusive escape into the bulk solution without encountering and reacting with the Cu matrix (denoted by the purple arrow). Thus, the confined geometry enhances the reaction kinetics by maintaining the concentration of corrosive species, akin to the concept of “geometry-controlled kinetics”43.
We note that the measured Ecorr of LT CS Cu rebounds to more positive values following the drop in the initially high Ecorr. This is particularly noticeable for AS and AC conditions, Fig. 3b, c, and can be attributed to the confined geometry leading to an increased corrosion rate following an incubation period during which corrosive species are formed and accumulate inside the confined volume. Subsequently, catalytic reactions continue along the PPIs as the oxide inclusions continue to activate NO3−, and the confined geometry helps to retain the corrosive species. Simultaneously, corrosion proceeds on the Cu surface, supported by the ORR as long as oxygen is present, Fig. 7a III and IV. While the ORR would be expected to be accelerated within the confined geometry due to the co-existence of the Cu+ and Cu sites44, the finite transport of O2 into the confined geometry would limit it. The opening of the confined geometry by corrosion leads to the cessation of the catalytic reactions normal to the PPIs. However, the interconnected oxide inclusions, with contributions from the voids, permit corrosion to continue penetrating and developing the corrosion network at PPIs in LT CS Cu, Fig. 7c.
For HT CS Cu, although PPI corrosion also initiates at the locations where oxide inclusions exist, it is affected by the coalescence of these oxide inclusions in two aspects. First, the amount of initially available Cu2O at a specific site is larger. This eliminates the incubation period for HT CS Cu, with the corrosion rate being higher than that of the LT CS Cu. This is reflected in the absence of a minimum in Ecorr and higher Ecorr values, Fig. 3, following the initial drop in Ecorr.
Moreover, oxide inclusions are less interconnected, and the number of voids is diminished in HT CS Cu. As a result, the propagation of corrosion at PPIs terminates when the available inclusions are consumed and the sites with confined geometry become more open, Fig. 7d. The sharp decreases in Ecorr for HT CS Cu under all conditions indicate the termination of corrosion at PPIs. That PPI corrosion is limited for HT CS Cu is confirmed by the μCT measurements, Fig. 4h. Consequently, corrosion behaviour of HT CS Cu and O-free Cu are similar beyond ~10 h under AC conditions, Fig. 3c.
These results emphasize the important role of geometrical factors in corrosion when microstructural defects are present. As AM techniques become increasingly popular, the influence of inclusions and voids, the common microstructural defects found in AM materials45, merit greater scrutiny. In the present case, catalytic corrosion proceeds rapidly along the PPIs in CS Cu due to the confined geometry which retains corrosive species and allows them to accumulate. The incubation period is short or even nonexistent, owing to the chemically aggressive environment. However, a locally aggressive environment could take much longer to develop under milder conditions, such as in the case of crevice corrosion for corrosion-resistant alloys46. Studies to date rely heavily on short-term electrochemical methods to characterize corrosion properties47; these will not detect the long-term corrosion behaviour if nucleated pits/occluded zones are already present in the material.
Methods
Fabrication of the CS Cu
Low-O Cu powders (5N Plus, Montreal, Quebec, Canada) were used to fabricate CS Cu. The chemical composition and particle size of the Cu powders used to fabricate the LT and HT CS Cu, as analysed by the supplier, are shown in Tables 1 and 2, respectively.
4-mm-thick CS Cu coatings were deposited onto carbon steel substrates (A 516 Gr. 70) by a cold spray system (Plasma Giken PCS-100), with a N2 carrier gas at 800 °C and 4.9 MPa. After deposition, CS Cu specimens were annealed in air at 350 °C and 600 °C for 1 h and are referred to as LT CS Cu and HT CS Cu, respectively.
The O-free, P-doped (30–100ppm) wrought Cu specimens were provided by the Swedish Nuclear Fuel and Waste Management Company (SKB, Solna, Sweden).
Electrochemical measurements
Cu specimens were prepared as follows: 1 cm × 1 cm CS Cu coupons were cut from the sprayed plates, while O-free Cu was machined into cylinders with a diameter of 1 cm and a height of ~1 cm. Each specimen was mounted in epoxy (Loctite Hysol) with a Cu wire attached to the back using conductive epoxy, ensuring an electrical connection to external circuitry. Prior to each electrochemical experiment, the Cu coupon was ground to a P4000 finish, rinsed with Type-1 H2O (18.2 MΩ·cm), and dried with Ar gas. The 0.1 M HNO3 solution used for electrochemical experiments was made by diluting a stock HNO3 solution (ACS reagent, 68–70%, Fisher Scientific) to the desired concentration using Type 1 H2O. Electrochemical experiments were conducted using a three-electrode system with the coupon, a saturated calomel electrode (SCE), and a Pt flag as the working, reference, and counter electrodes, respectively. Each electrochemical experiment was performed at least twice to ensure reproducibility.
Ecorr and linear polarization resistance (LPR) measurements were performed on Cu specimens to monitor their corrosion behaviour in 0.1 M HNO3 solutions containing different dissolved O2 concentrations, namely NA (~1 mM), AS (≤1 µM), and AC (≤1 nM).
Ecorr was recorded for ~24 h, with Rp measured periodically at one-hour intervals by LPR. For LPR measurements, the potential of the working electrode was swept to ±5 mV vs. Ecorr at a scan rate of 10 mV min−1 for two cycles, and the Rp values was calculated as the slope of the linear fit to the E-i curve. When plotting the Rp values, the number of data points was reduced for clarity.
Microstructural, compositional and morphological characterizations
The microstructure of the CS Cu was characterized by EBSD using a Hitachi SU6600 SEM equipped with an Oxford Symmetry Nano EBSD detector in the Zircon and Accessory Phase Laboratory (ZAPLab) within the Earth Sciences Department at Western University. Each specimen was ground to a P4000 finish using grinding paper, followed by polishing with a 1 μm diamond suspension. Afterwards, specimens were electropolished in an electrolyte composed of HNO3:CH3OH = 1:3 by volume (HNO3, ACS reagent, 68–70%; CH3OH, ACS reagent) using a GPR-H Series Linear D.C. Power Supply with an applied voltage of 10 V for 10 s. Final polishing was conducted using a Hitachi IM4000 Ar+ ion milling system for 120 s. EBSD measurements were performed with a step scan of 0.5 μm. The recorded data were analysed using Oxford HKL Chanel 5 software.
AES was used to characterize the oxide inclusions along the PPIs. Specifically, a PHI 710 Scanning Auger Nanoprobe (Physical Electronics Inc., Chanhassen, MN, USA) was used to obtain the Auger electron spectra of the area of interest. Auger electron spectra of the oxide inclusions and the surrounding Cu matrix were obtained by point and area analysis, then quantified to give the respective chemical composition. The distribution of the oxide inclusions in the CS Cu was characterized by AES element-mapping. The AES data were analysed by PHI MultiPak software.
The corrosion morphology of the CS Cu exposed to 0.1 M HNO3 with different dissolved O2 concentrations was characterized by SEM (Hitachi SU3900). The internal corrosion damage in CS Cu exposed to NA 0.1 M HNO3 was characterized by X-ray micro-computed tomography (Zeiss Xradia 410 Versa μ-CT). Specifically, cylindrical LT and HT CS Cu specimens (diameter = 3 mm, length = ~1 cm) were immersed in NA 0.1 M HNO3 solutions for 24 h, followed by μ-CT characterization at 80 kV and 10 W. The obtained images were processed with ORSI’s Dragonfly software.
Gas analysis
Headspace analysis was used to identify the composition of the gas formed during CS Cu corrosion in naturally aerated and deaerated 0.1 M HNO3 solutions. The CS Cu specimens were placed in a glass vial (~15 mL) half-filled with naturally aerated or deaerated 0.1 M HNO3 and sealed with a metal cap with a silicone septum. The latter was performed in an anaerobic chamber filled with Ar; thus, the ambient gas in the vial was Ar. The gas generated after ~12 h was collected in a gas-tight syringe and injected immediately into a GC-MS system (Agilent Technologies 6890 N Network GC System and 5973 Network Mass Selective Detector) for analysis. Helium was used as the carrier gas.


Responses