Patient-centered brain transcriptomic and multimodal imaging determinants of clinical progression, physical activity, and treatment needs in Parkinson’s disease

Introduction
Parkinson’s disease (PD) is a pervasive neurodegenerative disorder that presents with a variety of clinical manifestations such as motor (e.g., rigidity, resting tremor, bradykinesia), psycho-cognitive (e.g., cognitive decline, depression, anxiety) and autonomic symptoms (e.g., constipation, hyposmia, sleep disorder). However, patients display heterogeneous brain changes, clinical manifestations, and response to treatment. Therefore, the etiopathogenesis of PD points to multiple probable causes including genetics, environment, and lifestyle1. But the complex interplay between these biological factors is not clearly understood. Moreover, the pathological processes leading to the disease recruit many biological pathways at different cellular and molecular levels2. Thus, a comprehensive framework incorporating several disease-associated variables is crucial for advancing the understanding of the disease. This is further supported by the recent efforts in transitioning towards a biological definition of PD3,4.
Genetic analyses have contributed significantly to the understanding of the biology of PD5,6,7. Mendelian studies of familial forms of PD identified over 20 causative genes8,9. Genomic-wide association studies have also revealed over 100 susceptible loci that confer risk to sporadic PD6,10. Further, transcriptomic analyses across the brain and peripheral tissues have identified putative causal genes and biological pathways, providing insights into the mechanisms of the disease process11. These studies have suggested that the underlying biological mechanism and inter-individual differences may influence disease course, symptom severity and response to treatment. Hence, genetics-informed research has important implications for developing personalized treatment and improving clinical trial design through patient selection and stratification12.
Current PD treatments are only symptomatic, and no single drug addresses the wide range of symptoms seen in patients. The mainstay of PD treatment, dopamine replacement therapy, relieves motor symptoms for a considerable number of patients, especially at the early stage of disease13. However, 9-16% of patients do not respond to dopamine-based therapies, suggesting that patient heterogeneity plays a pivotal role in treatment response. Disappointingly, even hitherto responsive patients subsequently experience medication dose wear off and drug-associated worsening of symptoms, including drug-resistant tremor and medication-induced dyskinesias. As an adjuvant non-pharmacologic intervention, physical therapy helps improve a broad range of symptoms13,14. However, the biological mechanisms underpinning the interaction of physical activity with PD are not fully understood. Furthermore, despite the perceived benefits of physical activity, sedentariness is still found among PD patients due to debilitating motor symptoms and other barriers such as perceived low expected benefit, lack of time, fear of falling, etc., that prevent patients from conducting exercise regimens15. Understanding the biological substrates of physical activity in PD can facilitate the discovery of pharmacological alternatives, especially for those patients in advanced stages of the disease when physical activities are almost impractical.
Neuroimaging measures offer standard tools for routine clinical diagnosis of neurodegenerative diseases, further enabling the elucidation of disease pathogenesis and progression. Initial attempts integrating several neuroimaging modalities with either gene expression or receptor densities provided insights into the multiscale interactions in healthy aging and Alzheimer’s disease16,17. This approach, called multifactorial causal modeling (MCM)18, affords a mechanistic way of understanding how the longitudinal changes in a biomarker emerge from the complex interplay between several biomarkers. Unified multimodal neuroimaging and expression of hundreds of genes revealed critical genetic determinants of healthy aging and Alzheimer’s disease, as well as biological mechanisms separating the two processes16. Similar approach combining neuroimaging with neurotransmitter receptor associated distinct neurotransmitter mechanisms with motor and visuospatial axes of PD19. The applicability of such unified multifactorial approach to subject-level modeling offers the unprecedented opportunity to harness inter-patient heterogeneity for better treatment plans and clinical trial design.
In this study, we extend the multiscale spatiotemporal characterization of PD in four fundamental ways: (i) integrating whole-brain gene expression with six longitudinal molecular, functional and (micro)structural neuroimaging-derived biological factors to infer synergistic gene-mediated longitudinal brain reorganization in PD patients, (ii) linking distinct biological mechanisms and protein-protein interaction networks with different configurations of PD symptoms (iii) identifying molecular mediators of the interplay between PD progression and physical activity, and (iv) using patient-level in silico gene perturbations to identify putative disease-modifying drugs for PD. This work represents a pioneering attempt to unify multiple aspects of PD-associated biomarkers and physical activities at different resolutions, paving the way for a deeper understanding of PD biological mechanisms and identifying effective personalized treatments.
Results
Whole-brain multiscale transcriptomic-neuroimaging model of Parkinson’s disease
To characterize widespread molecular, functional and (micro)structural brain changes in PD patients at the individual level, we fit a whole-brain model with gene expression and six longitudinal neuroimaging-derived biological factors. The used imaging modalities macroscopically captured neurodegenerative brain changes, namely, dopaminergic loss (DAT-SPECT), neuronal activity integrity (via fractional amplitude of low frequency fluctuations [fALFF] from resting-state fMRI), directed microstructural changes (fractional anisotropy), undirected microstructural damage (mean diffusivity), dendrite density (t1/t2 ratio20), and tissue atrophy (gray matter density). They are acquired over at least 3 longitudinal scans (3.9 ± 0.7 years) in 89 PD patients from the Parkinson’s Progression Markers Initiative (PPMI) cohort. The transcriptomic data was derived from 6 neurotypical brains from the Allen Human Brain Atlas (AHBA)21 across 976 landmark genes, which have been shown to be central to biological functions and recapitulate about 89% of the whole human transcriptome22. Anatomical connectivity was estimated from the high-resolution Human Connectome Project template (HCP-1065; Methods: Anatomical connectivity estimation).
Our mathematical framework, named gene expression multifactorial causal model (GE-MCM; Fig. 1a), is formulated to capture the across-brain influence of gene expression on a particular biological factor (imaging-derived) and accounts for the network-mediated spreading of the subsequent aberrant changes across the brain (see Methods: Gene Expression Multifactorial Causal Model). Using a robust Bayesian optimization technique, we estimated regression coefficients (gene-imaging parameters) that capture the modulation effect of each gene on the dynamic changes and interactions of the individual imaging-derived biological factor. Even though we used a single fixed neurotypical gene expression template across the population (AHBA), the personalized gene-imaging parameters quantify individual gene dysregulation patterns and serve as proxies for gene-specific deviations needed for individual model fitting. Indeed, when applied to the studied PD population, the model showed a good predictive ability to reproduce the six disease-affected longitudinal imaging-derived biological factors (R2 = 0.71 ± 0.2). Notably, the model parameters demonstrated the capacity to (i) correctly unravel the biological mechanisms underlying inter-patient variability in clinical manifestations or physical activity (Fig. 1b) and (ii) infer patient-specific complete model for in silico drug discovery via gene perturbation (Fig. 1c).

a Patient’s temporal disease evolution captured by longitudinal multimodal neuroimaging is decomposed into: i) local transcriptome-mediated interactions between neuroimaging measures disease-related biological factors, namely dopaminergic loss, neuronal activity integrity, directed microstructural changes, undirected microstructural damage, dendrite density, and neuronal atrophy, and ii) network-mediated propagation of pathological effects between brain regions. The patient-specific gene-imaging parameters {α} are obtained by robust Bayesian regressions optimizing the differential equations (Methods). b Covariance between the gene-imaging parameters and slopes of clinical evaluations or physical activities are resolved along multiple principal axes to unveil the underlying biological pathways. c In silico bidirectional perturbation of genes identifies putative PD drugs. The perturbation of a therapeutic gene is expected to cause a slower disease progression when compared to progression without perturbation.
Identifying transcriptomic mechanisms mediating behavioral and cognitive deterioration in PD
We sought to identify genetic drivers of multifactorial brain reorganization due to PD progression, particularly those genes controlling direct spatiotemporal interactions among dopaminergic loss, neuronal activity integrity, directed microstructural changes, undirected microstructural damage, dendrite density, and tissue atrophy. First, out of a total of 35,136 gene-imaging parameters, we identified 953 stable parameters whose 95% confidence intervals (CI) exclude zero. Singular value decomposition (SVD) was then used to find the shared latent space between these stable parameters and 11 different clinical evaluations (Methods: Clinical and Physical Activity Measures). Five of eleven principal components were significant following permutation tests (p < 0.05), with the first principal component accounting for a notable proportion (43.7%) of the overall explained covariance. Projection of the gene-imaging interactions and clinical evaluations on this first latent component showed a very high correlation of r = 0.93 (p = 0.001: Fig. 2a). Furthermore, we discovered 85 genes with significant contributions to the first axis (bootstrap ratio >1.96). Querying the diseases associated with the specific genes in DisGeNET database revealed PD as the leading disorder (q < 0.05; Fig. 2b). Specifically, 17 out of the 85 genes are enriched in PD. Other identified disorders are esophageal carcinoma, medulloblastoma and shigella disease, which are associated with the PD and non-PD enriched genes (Fig. 2b). Interestingly, shiga toxins are linked to damage in blood-brain barrier, microvasculature, astrocytes and neurons with characteristic motor symptoms23. Similarly, α-synuclein (SNCA) is suggested as a biomarker for medulloblastoma (Li et al. 2018). These results support the relevance of the identified genes to PD pathogenesis and its potential complex interaction with other disorders.
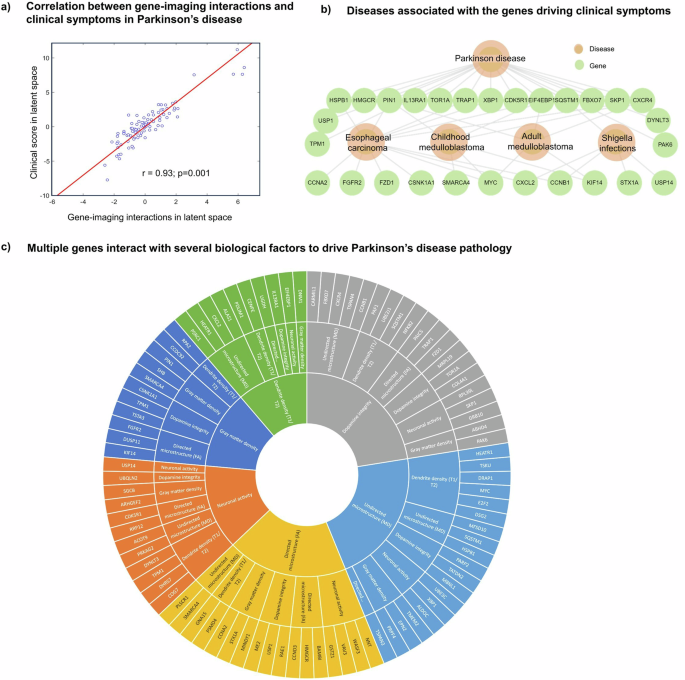
a High correlation (r = 0.93; p = 0.001, FWE-corrected) between projections of gene-imaging pathological interactions and rates of clinical deterioration on the obtained first latent component. This component accounts for 43.7% (p = 9.99 ×10⁻⁴, FWE-corrected) of the explained covariance between clinical evaluations and the pathological interactions of gene expression and neuroimaging measures. b DisGeNET disease-gene associations of the genes contributing to the pathological interactions on the first latent component. The hierarchical relationship shows the significant cognate diseases and their shared genes (q < 0.05). c Multifactorial interactions between identified genes and neuroimaging-derived biological factors. A gene directly influences how a neuroimaging-quantified biological factor interacts with other factors to cause a factorial alteration along the disease’s course. Notably, the outermost ring represents the genes modulating the interactions among biological factors, the middle ring displays the biological factor directly influenced by a gene, and the innermost ring shows the biological factor undergoing longitudinal changes because of the interactions.
Next, we investigated the specific dopaminergic, functional, microstructural or structural that are modulated by the 85 genes in the first latent component. Since each optimized gene-imaging parameter associates a gene with an imaging-derived biological factor, we retrieved the factors of the significant parameters associated with these 85 genes, observing a broad range of significant causal interactions underlying brain reorganization in PD (Fig. 2c). Among the genes previously linked with PD, we observed that TPM1 modulates dopamine level in driving longitudinal changes in tissue atrophy, which is consistent with the gene’s role in controlling striatal dopamine release24,25. Our results further suggested that TPM1 also modulates dendrite density to drive longitudinal alterations in neuronal activity integrity, in agreement with the gene’s activity of regulating actin filament and neurite growth26. Similarly, we found that CXCR4 modulates mean diffusivity (a measure of myelin or axon integrity) to drive dopamine change longitudinally. Activation of CXCR4 promotes the development of oligodendrocytes for remyelination of injured adult central nervous system27. Among the novel genes, we found HEATR1 directly modulating dendrite density and undirected microstructure, which is consistent with its known role in cell growth and proliferation28,29. Furthermore, even though MBNL1 has been shown to shape dendrite structure30, our result suggests that it modulates dopamine to drive undirected microstructural changes in PD. The fact that some of the suggested mechanistic interactions have been previously reported in experimental studies supports the validity of our approach. Hence, our transcriptomic-neuroimaging analysis has the capacity -based on the estimated model parameters- to clarify the specific levels at which the identified genes mechanistically impact the macroscopic brain reorganization associated with PD progression. In this sense, this approach transcends the traditional single-scale transcriptomic, neuroimaging or clinical analysis of PD, by mapping the synergistic interactions among these different but strongly interrelated measurement levels.
Protein-protein interaction networks underlying PD phenotypic landscapes
To further clarify how the model-derived multiscale biological interactions might be related to different clinical manifestations of PD, we analyzed all the five significant latent components of the SVD. The explained co-variance of these components are 43.7%, 14.5%, 10.2%, 7.1% and 6.3%, respectively. Projecting the 11 clinical scores onto these components allowed us to disentangle the contributions of psychiatric, motor, cognitive and other PD symptoms to each latent component. Using a high confidence score (cut-off = 0.7), we then retrieved the protein-protein interaction (PPI) networks of the genes associated with each component from STRING database31. The biological pathways (q < 0.05) relevant to PPI networks were also obtained from Wikipathways.
In contrast to other components, the first latent component, whose genes were earlier associated with PD in Fig. 2, shows a balanced contribution from the four groups of symptoms (Fig. 3). This observation suggests that the leading biological mechanisms underlying PD engender a wide range of clinical symptoms. Nevertheless, the largest individual symptomatic contribution comes from motor signs (UPDRS-III), the principal hallmark of PD. The associated PPI network points to the active roles of cell cycle, DNA damage, and rapamycin signaling.
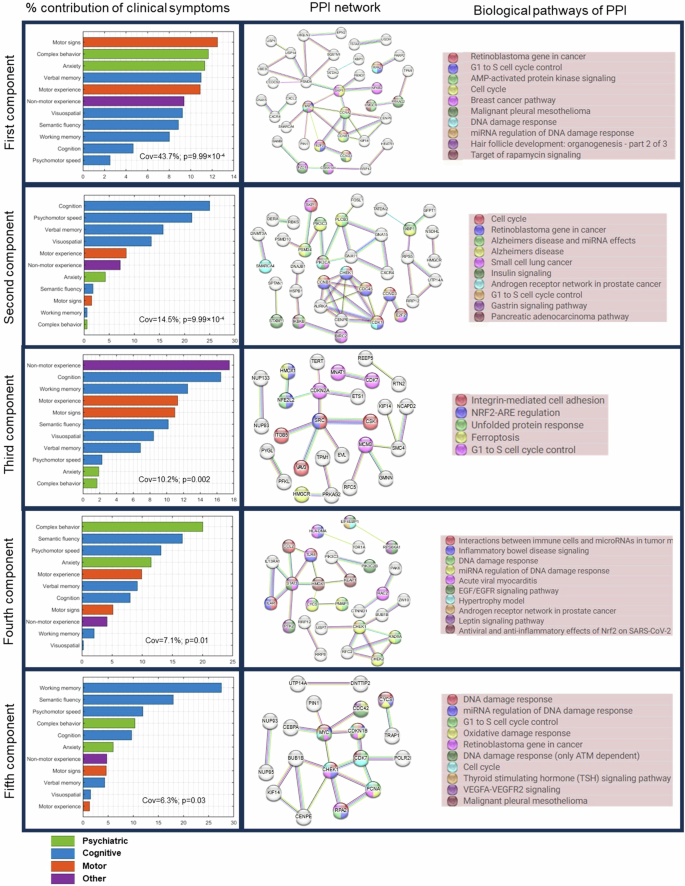
Left: Five significant latent components were identified based on permutation analysis (FWER < 0.05) of shared covariance between gene-imaging pathological interactions and clinical evaluations. Bar graph shows the relative contributions of each clinical evaluations, grouped by symptom types, on each latent component. Middle: Protein-protein interaction networks (PPI) of significant genes associated (bootstrap ratio >1.96) with each latent component. PPI networks were retrieved from STRING with a high confidence score ≥0.7. Right: Top biological pathways (q < 0.05) associated with the genes in the PPI networks. Colored nodes in the PPI networks correspond to genes implicated in the top biological pathways.
The second component is dominated by cognitive symptoms, which supports why the biological pathways include Alzheimer’s disease, in addition to insulin signaling, cell cycle, and gastrin signaling. The largest contributions to the third component come from motor, cognitive and other non-motor symptoms of daily living (e.g., pain, fatigue, and autonomic dysfunctions). Notably, the implicated pathways include ferroptosis, unfolded protein response, cell cycle and oxidative stress. The fourth and fifth components are predominantly psychiatric and motor symptoms, with suggested roles of inflammation, leptin signaling, cell cycle, DNA damage response, and oxidative stress. Despite the varied symptom profiles and underlying PPI networks, we observed a common association of cell cycle processes with all the latent components.
As hub genes are believed to play central roles in biological processes and gene regulatory networks32, we sought to identify the leading hub genes in the PPI networks. Interestingly, each latent component has at least one dense PPI sub-network which could be prioritized for biomarker or drug discovery. We therefore selected the hub genes as those with the highest node degrees. We identified 3 hubs genes, namely, MYC, CCNA2 and PSMD4 in the first component due to a tie in their rankings. CDK1, SRC, and STAT3 were ranked highest for the second, third and fourth components, respectively. The PPI network of the fifth component was not queried because its enrichment PPI value was not significant (p = 0.194; Fig. 3). Apart from PSMD4, other genes have been previously identified as hub genes in PD. Our results however suggests that different hub genes might be associated with different patterns of clinical symptoms in PD.
Uncovering molecular pathways associated with physical activity in PD
Physical activity reduces the risk of developing PD and ameliorates both motor and non-motor PD symptoms33,34,35. Conversely, the symptomatology of PD presents many barriers (such as motor dysfunction, cognitive impairment, depression and apathy) to engaging in physical activities (Amara et al.34). Molecular pathways modulating the relationship between PD and physical activity may therefore shed light onto key neuroprotective mechanisms. We investigated possible biological mechanisms associated with physical activity in PD by applying SVD to identify axes of covariance between the stable gene-neuroimaging parameters and three different domains of physical activity, namely household, work, and leisure activities. The individual scores for the different domains were derived from PASE, a self-reported questionnaire commonly used to quantify physical activity levels in older adults36. Two SVD principal components were relevant based on permutation tests (p < 0.05), and they separately explained 47% and 37% of the data covariance. Leisure activities (e.g., resistance training, jogging, swimming) account for about half (49%) of the first axis (Fig. 4). Conversely, work-related activities (e.g., walking and lifting) contribute (54%) principally to the second axis. Nevertheless, household activity account for 27% and 40% of first and second axes, respectively.
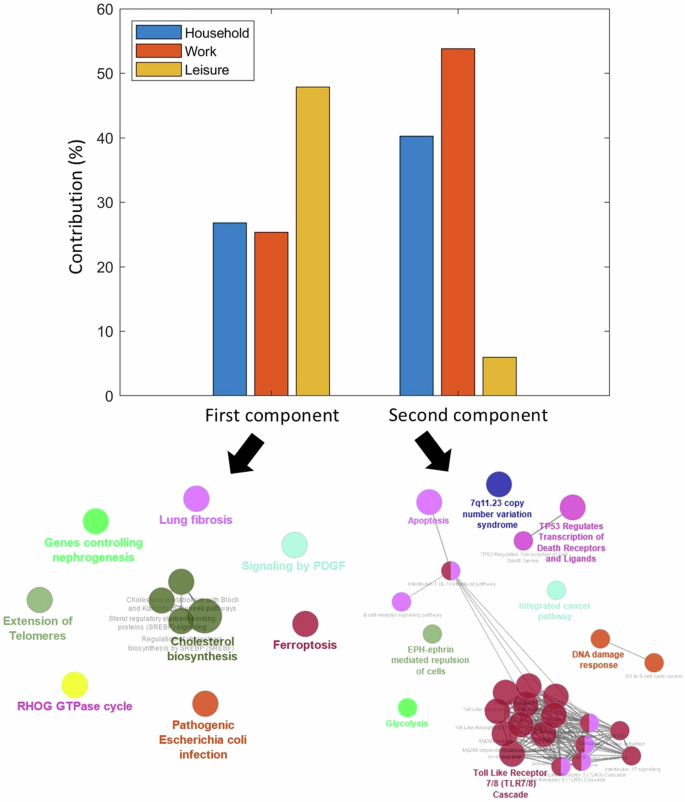
Contributions of the three domains of the Physical Activity Scale for the Elderly (PASE) towards the first and second principal axes. The corresponding biological pathways mediating the interactions between physical activity and PD in each axis are pointed by the arrows. The primary and secondary axes were obtained from the SVD of the covariance matrix of the gene-neuroimaging parameters and slopes of physical activity scores. The biological pathways were queried from Reactome and Wikipathways (q < 0.05).
Next, using the genes with significant contributions to each axis (bootstrap ratio >1.96), we queried the associated biological pathways from Reactome and WikiPathways. The two pathway databases were combined to ensure the robustness of our findings and avoid database bias. The first component is principally associated with cholesterol biosynthesis (q < 0.05) while the second component is largely implicated in immune-related processes such as toll-like receptor and B cell signaling. Even though reverse causation cannot be disregarded (as reduced activity levels may accelerate PD progression, and vice versa), the identified biological pathways may be partly explaining individual predisposition/variation to physical activity under PD progression and its associated multiscale brain changes.
Virtual gene perturbations reveal potentially effective drug candidates
Finally, we used a first-of-its-kind multifactorial causal perspective to predict potential therapeutic drugs candidates for PD. For this, we utilized the individually fitted GE-MCM to simulate the disease’s subsequent progression for 2 years after the last evaluated time point. We then up- and down-perturbed each gene and quantified the influence of each perturbation on the brain’s multifactorial and multiregional imaging descriptors associated with disease progression (Methods: Gene Perturbation for Drug Discovery). A gene was considered therapeutic if the perturbation-induced brain changes implied a slower disease progression than the actually observed within the two years under consideration. We then ranked the genes based on the number of subjects for which they have a hypothetical therapeutic effect and selected the top genes in the 90th percentile. Next, using the CMap database in EnrichR, we queried the inverse-drug relationship between selected genes and several drugs. CMap allowed us to map previous drug-induced transcriptomic perturbations to our in silico perturbation profiles. We checked for the alignment between the genes up- and down-regulated by drugs in CMap and our up- and down-perturbed therapeutic genes, respectively. We then retrieved the associated disease and pharmacological classification of these drugs from PubChem.
Figures 5a and 5b show the list of the top respective drug candidates ranked by combined score (product of odds ratio and negative natural log of the p-value). Three of the drugs are associated with dopamine, the principal neurotransmitter implicated in PD. The first among the list of drugs associated with the upwardly perturbed genes is nomifensine, a drug that increases synaptic dopamine availability by inhibiting dopamine reuptake (Fig. 5a). Similarly, the fourth drug is Levodopa, the most commonly used drug for treating PD symptoms. Among the top drugs identified through the in silico down-perturbation is pergolide, an ergoline-based dopamine receptor agonist still being used to treat PD in some countries. Furthermore, we found a notable number of drugs currently used to treat infections, hinting at the potential of repurposing anti-infectives for PD treatment. Other drugs are implicated in cardiovascular disease, insomnia and inflammation.
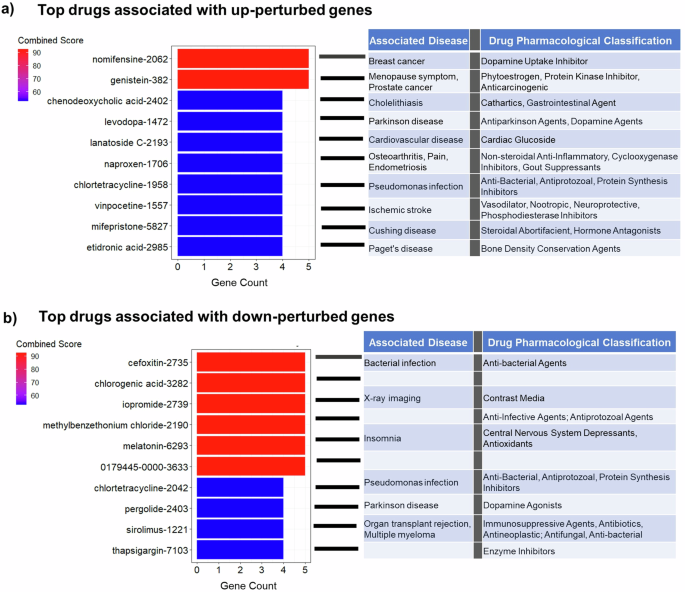
a The top 10 drugs identified by upward perturbation of genes. The hypothetically therapeutic genes were discovered by increasing their expressions by 10% and observing the effect of disease progression within 2 years. The drugs were obtained by comparing the identified therapeutic genes with the transcriptomic effect of drugs from CMAP database. The drugs are ranked by the combined score (odds ratio × −log(p-value)). b The top 10 drugs identified by downward perturbation of genes.
Discussion
Parkinson’s disease is a biologically complex and heterogenous disorder. Here, we developed a novel computational approach that incorporates bulk gene expression, longitudinal multimodal neuroimaging, clinical evaluations, and physical activities information to unravel the multiscale and multifactorial changes accompanying the disease’s progression and therapeutic needs. We validated the relevance and informativeness of the personalized models by identifying PD as the primary neurodegenerative disease associated with the molecular pathways and clinical symptoms. We further unraveled the biological substrates underpinning longitudinal brain changes, clinical deterioration and the relevance of physical activity to the disease course. Finally, we demonstrated the usefulness of our approach for drug discovery and repurposing via in silico (computational) transcriptomic perturbations. This first-of-its-kind study proposes a self-contained bottom-up causal approach for advancing the understanding of complex multilevel disease processes and identifying potential disease-modifying therapeutic targets.
Most genetic studies in PD focus on detecting relevant genes to explain clinical diagnosis or a few brain phenotypes, without considering their complex interdependent relationships37. Contrarily, our modeling approach allowed us to uncover PD-relevant genes in terms of their capacity to synergistically control multifactorial brain interactions in time, and the subsequent biological and clinical processes that they influence. For instance, among the genes identified are PIN1, SKP1, TRAP1, TOR1A (Fig. 2c). PIN1 is expressed in neurons and found play active roles in neuronal cell death and apoptosis38,39. Mice lacking PIN1 displayed neuronal degeneration including motor and behavioral dysfunctions40. Concordantly, our result suggests that PIN1 directly modulates gray matter density in PD (Fig. 2c). Similarly, decreased expression of SKP1 homolog (SKPA) and TRAP1 have been shown to cause loss of dopamine in flies, accompanied by motor symptoms41,42. We found that these two genes directly interact with dopamine to drive longitudinal change in neuronal activity integrity and directed microstructure, respectively. TOR1A is highly expressed in the substantia nigra, a key region in the pathogenesis of PD, and is responsible for primary hereditary form of dystonia, partly due to its effect on striatal dopamine24. Concordantly, our findings suggest that TOR1A modulates dopamine to drive the longitudinal alterations in dopamine integrity. Many of the gene-imaging relationships identified in our study of PD patients have also been reported in vivo in animal models. Hence, the novel gene-neuroimaging associations can be further validated through experimental models. The insights afforded by these relationships can advance our mechanistic understanding of the disease, from a multiscale and multifactorial perspective, and help to streamline the identification of possible off-targets when targeting genes for drug development.
Although the hallmark signs of PD are motor complications, dysregulation of multiple clinical domains including cognition, memory, mood, behavior, and autonomic functions supports the complex and multisystem view of the disease. Moreover, heterogeneity in patients’ symptoms and response to treatment has led to the definition of various PD subtypes43. Even though our study did not subtype patients because of the small sample size, we uncovered five distinct axes of association between biological mechanisms of PD and clinical symptoms. Interestingly, we observed qualitive differences in the relative involvement of symptom types to these axes. Network biology approach also revealed different PPI topology and biological pathways underlying these symptom distribution profiles. Despite the association of numerous pathological processes such as protein aggregation, oxidative stress, ferroptosis, and neuroinflammation with PD, the link between these processes and heterogenous symptom manifestations are lacking. Our study aligns symptom profiles with multiscale biological pathways. We found that inflammation, leptin signaling DNA damage response and oxidative stress may be associated with predominant motor and psychiatric symptoms while insulin and gastrin signaling could be implicated in pronounced cognitive symptoms. Nevertheless, we observed a general involvement of G1/S cell cycle control (or its associated processes) with all the symptom distributions. Cell cycle re-entry in post-mitotic neurons might cause neurodegeneration by triggering response to oxidative stress, DNA damage, and other pathological processes44. Concordantly, rotenone-based model of PD showed that lowering the amount of rotenone reduces endoreplication-induced neurodegeneration by blocking cell cycle progression at G1/S phase45,46. We further prioritized 6 hub genes related to these symptom profiles. Interestingly, five of these genes (MYC, CCNA2, CCDK1, SRC and STAT3) have been previously identified as PD hub genes from different cohort studies of gene expression in substantia nigra and peripheral blood47,48,49,50,51. The novel hub gene, PSMD4, is a receptor of the 26S proteosome which is responsible for protein degradation52. Given the relevance of proteosome homeostasis to intracellular accumulation of α-synuclein53, this novel hub gene may play a key role in PD pathogenesis. The hub genes in this multifactorial study can guide the identification of druggable targets and biomarkers for heterogenous PD symptom profiles.
The benefits of physical activity to PD symptoms and progression are widely acknowledged. Even though the biological mechanisms mediating these benefits are not fully understood, it has been hypothesized that physical activity may promote neuronal plasticity and survival of dopaminergic neurons by simulating the expression of neural growth factors54. Here, we found that physical activity is associated with PD through two principal pathways, namely, cholesterol biosynthesis and inflammation via toll-like receptors. A previous study of animal model of PD showed that MPTP-bearing mouse had reduced α-synuclein and downregulation of toll-like receptors after eight weeks of treadmill exercise55. Although the results on the association of cholesterol with PD are mixed, several PD-related genes are involved in cholesterol homeostasis56,57. Moreover, cholesterol biosynthesis has been shown to decrease in the fibroblasts of PD patients58. The most compelling insights into the tripartite association between PD, cholesterol and physical activity was demonstrated recently59. The authors found that physical activity activates PPARα in the dopaminergic neurons of PD mouse model. Activation of PPRAα alone suppressed the aggregation and spreading of α-synuclein in the mouse. As PPRAα is a transcription factor that regulates the expression of genes involved in fatty acid oxidation, the mouse was treated with fenofibrate, a PPRAα medication for abnormal cholesterol level. The authors observed that one month of daily treatment with fenofibrate conferred similar benefits as two months of regular exercise. Despite that our analysis does not rule out the bidirectional relationship between PD and physical activity, our results are consistent with the foregoing studies. However, the mode and intensity of exercise remains an open question. A meta-analysis of 19 randomized human clinical trials showed that different modes and regimens of exercise provide different forms of benefits to PD symptoms60. Indeed, our findings could guide a more personalized prescription of physical activity in PD, tailored to individual biological mechanisms and associated predisposition. Perhaps, leisure-related activities (likely shorter duration, higher intensity) would be more beneficial to patients having abnormal cholesterol levels while home- or work-related activities (likely repetitive and lower intensity) could help with neuroinflammation-induced PD pathogenesis. Furthermore, personalized physical activity regimen can be prescribed by comparing the gene-neuroimaging parameters of a patient with the parameters of other patients who have benefited from a particular exercise regimen.
Current treatments for PD are symptomatic, hence the search for disease-modifying treatments addressing the underlying pathology is a priority. While the mainstay of PD treatments are dopamine-based drugs, their effectiveness largely varies with disease subtype and stage13. Interestingly, among the top 20 putative PD drugs identified in our study, there are three dopamine-based drugs, including levodopa, the current first line treatment for PD (Fig. 5a, b). Even though dopamine-based drugs are considered symptomatic, our analysis does not preclude the identification of disease-modifying treatments, given the drugs were discovered through the genes underlying the disease’s multifactorial mechanisms. Moreover, due to the limited number of subjects, we performed the drug identification at the population level and could not determine which drugs may confer disease-modifying effects on distinct patient subtypes. Nevertheless, apart from dopamine-based drugs, we identified multiple immune-related and anti-inflammatory drugs, including naproxen (a non-steroidal anti-inflammatory drug) and tetracycline. Other drugs such as vinpocetine, chlorogenic acid and melatonin have also been reported to modulate inflammation. Although vinpocetine is typically prescribed for treating memory loss in aging and dementias (including PD patients with dementia), it has been demonstrated to regulate the circulation of inflammatory molecules in PD patients61. Chlorogenic acid, found in coffee, is suggested to offer neuroprotective roles in animal models of PD62,63,64. Similarly, melatonin, which may improve sleep disturbance in PD65, has also been shown to reduce neuroinflammation66. The convergence of these medications on immune system/inflammation highlights the need to consider this pathway for drug discovery and repurposing.
Our study also has a number of limitations. The lack of patient-specific gene expression data constrained us to use a single neurotypical gene expression template. Nevertheless, we previously demonstrated that the interaction of the ‘static’ transcriptomic information with patient-specific longitudinal neuroimaging measures provides a proxy for patient-specific genetic deformation in healthy aging and Alzheimer’s disease16. Furthermore, the static gene expression data was obtained by combining the mRNA values of six different subjects and inferring the gene expression for the brain regions with missing values16. Despite the inherent variability and bias that could arise from inter-subject variability and mRNA interpolation, the identification of PD as the underlying neurodegenerative disease demonstrates the validity of our approach (Fig. 2b). Recent works incorporating single neurotransmitter receptor template in personalized brain models also showed that the estimated model parameters capture disease-related mechanisms better than neuroimaging data only17,19. However, subject-specific gene expression may help refine the derived gene-imaging parameters and better facilitate personalized treatments.
Overall, our universal mathematical formulation can be used to analyze other complex multiscale, multifactorial and progressive disorders such as frontotemporal dementias and amyotrophic lateral sclerosis. As subtyping often requires a large number of subjects and raises a question of within-subtype homogeneity, our gene-imaging parameters provide a way to mechanistically capture biological and clinical variability for better diagnostics and treatment plans in heterogenous diseases. Future work will also consider how these biologically-defined parameters can predict patient response to treatment in clinical trials.
Methods
Ethics statement
This article does not contain any studies with human participants performed by any of the authors. The neuroimaging and clinical data were acquired from the multicenter Parkinson’s Progression Markers Initiative (PPMI; ppmi-info.org). As per PPMI protocols, study participants and/or authorized representatives gave written informed consent at the time of enrollment for sample collection and completed questionnaires approved by each participating site Institutional Review Board (IRB). The authors obtained approval from the PPMI for data use and publication, see documents https://www.ppmi-info.org/documents/ppmi-data-use-agreement.pdf and https://www.ppmi-info.org/documents/ppmi-publication-policy.pdf, respectively.
Study participants
This study involved 89 individuals with baseline PD diagnosis from PPMI (RRID:SCR_006431; http://ppmi-info.org/). All the participants have at least three imaging modalities out of the following: dopamine SPECT, resting functional MRI, diffusion MRI, structural MRI ; for at least three longitudinal visits. Please see Supplementary Table 1 for demographic characteristics. The PPMI was launched in 2010 as an observational study of longitudinal changes in volunteer subjects with and without PD. PPMI is led by Principal Investigator Kenneth Marek, MD and sponsored by the Michael J. Fox Foundation, with the goal of understanding the onset and progression of PD.
Structural MRI
Structural T1- and T2-weighted 3D brain images were acquired as described in PPMI manuals (http://www.ppmi-info.org/). The images were corrected for intensity nonuniformity using the N3 algorithm (Sled et al. 1998). They were segmented into gray matter (GM), white matter (WM), and cerebrospinal fluid (CSF) probabilistic maps, using SPM12 (http://www.fil.ion.ucl.ac.uk/spm). The gray matter segmentations were standardized to MNI space (Evans et al.67) using DARTEL (Ashburner, 2007). Each map was corrected for the effects of spatial registration to preserve the initial amount of tissue volume. Mean gray matter density values of the T1- and T2-weighted images were calculated for a total of 163 gray matter regions described in Methods: Gene Expression and Brain Parcellation.
Dopamine SPECT
A 111-185 MBq (3–5 mCi) bolus injection of I-123 FB-CIT was administered to each participant and the SPECT scans were obtained 4 h post-injection. Raw projection data was acquired as a 128 × 128 matrix, after which the SPECT image was reconstructed. The images were preprocessed using SPM12. The scans underwent attenuation correction and noise reduction using Gaussian blurring with a 3D 6 mm filter. After alignment to T1, the reconstructed and corrected SPECT images were normalized to MNI space67, and average values were calculated for the 163 brain regions of interest.
Resting-state fMRI
Resting-state functional images were acquired using an echo-planar pulse sequence on a 3.0 T Philips MRI scanner with the following parameters: 140 time points, repetition time (TR) = 2400 ms, echo time (TE) = 25 ms, flip angle = 80°, number of slices = 40, slice thickness = 3.3 mm, in-plane resolution = 3.3 mm, and in-plane matrix size = 68 × 66. The fMRI images were preprocessesd using FSL (v5.0) toolbox (https://fsl.fmrib.ox.ac.uk/fsl/fslwiki)68. The preprocessing steps are: 1) Motion and splice timing correction 2) Alignment to the structural T1 image 3) Spatial normalization to the MNI space using the registration parameters obtained for the structural T1 image with the nearest acquisition date, and 4) Signal filtering to retain only low-frequency fluctuations (0.01–0.08 Hz) (Chao-Gan and Yu-Feng, 2010). Due to its high sensitivity to disease progression (Iturria-Medina et al., 2016), we used fractional amplitude of low-frequency fluctuation (fALFF) as a regional quantitative indicator of the brain’s functional integrity. fALFF quantifies resting-state regional brain activity as the ratio of the power spectrum of the low frequency band (0.01–0.08 Hz) to the power spectrum of the whole frequency range (0–0.25 Hz)69.
Diffusion MRI
Diffusion MRI (dMRI) was obtained using standardized protocols on Siemens Verio and Siemens Tim Trio 3 T MRI scanners. A single-shot echo-planar imaging scheme was used with 64 sampling directions, a b-value of 1000 s/mm2 and a single b = 0 image. Other parameters include 116 × 116 matrix, 2 mm isotropic resolution, TR/TE 900/88 ms, and two-fold acceleration. More information on the dMRI acquisition and processing can be found online at http://www.ppmi-info.org/. Further preprocessing was done in FSL (v5.0). First, the DTI scans were corrected for motion, eddy current and EPI distortion. Then, the b0 images were aligned to the corresponding subject’s T1-weighted images based on mutual information. The deformation field between the diffusion and T1-weighted image was calculated. The deformation field and eddy current transformations were applied to the dMRI images. Diffusion tensor models were then fitted independently for each voxel. Next, the scans were normalized to MNI space67 using the registration parameters obtained for the structural T1 image with the nearest acquisition date. The mean values of the fractional anisotropy and mean diffusivity were estimated for each of the 163 brain regions of interest.
Gene expression and brain parcellation
Microarray data was downloaded from the Allen Human Brain Atlas (AHBA) (RRID:SCR_007416) website (http://www.brain-map.org) (Hawrylycz et al.21). The AHBA data consists of mRNA expression in 3702 tissue samples obtained from six adult human brains, with no known neuropathological history. The data was preprocessed by the Allen Institute to reduce the effects of bias due to batch effects. Description of the processing steps can be found in the technical white paper on AHBA website. For each brain, there are 58,692 probes representing 20,267 unique genes. Leveraging the spatial dependence of gene expression patterns70, Gaussian kernel regression was applied to predict the mRNA intensity in each of the 3702 samples in MNI space using leave-one-out cross-validation. The probe with the highest prediction accuracy (among the multiple probes for a gene) was chosen as the representative probe for that gene. Next, because mRNA values were not available for all the gray matter voxels of the brain, Gaussian kernel regression was again used to predict the GE for the remaining MNI coordinates without mRNA expression intensity. Thus, the whole-brain GE data was obtained for the selected 20,267 probes/genes. As it was infeasible to use these ~20,000 AHBA genes for modeling, we therefore selected 976 landmark genes (Supplementary Table 2)22. These landmark genes are universally informative transcripts with the capacity to cover most of the information in the whole human transcriptome across a diversity of tissue types. The average expression value of each gene was then calculated for the 163 brain regions of interest.
A brain parcellation was derived from a combination of the Jülich71, Brodmann, AAL372, and DISTAL73 atlases. First, structural T1 images of the four atlases were registered to the MNI ICBM152 T1 template using FSL’s FLIRT affine registration tool74. Then, the obtained transformations were used to project the corresponding parcellations to the MNI ICBM152 space using nearest neighbor interpolation. The resulting parcellation has 163 gray matter regions of interest which were used to extract the multimodal imaging data, gene expression, and diffusion-based connectivity matrix.
Anatomical connectivity estimation
The connectivity matrix was constructed in DSI Studio (http://dsi-studio.labsolver.org) using a group average template from 1065 subject75. A multi-shell high-angular-resolution diffusion scheme was used, and the b-values were 990, 1985, and 2980 s/mm2. The total number of sampling directions was 270. The in-plane resolution and slice thickness were 1.25 mm. The diffusion data were reconstructed in MNI space using q-space diffeomorphic reconstruction to obtain the spin distribution function76. The sampling length and output resolution were set to 2.5 and 1 mm, respectively. The restricted diffusion was quantified using restricted diffusion imaging and a deterministic fiber tracking algorithm was used77. Using the brain atlas previously described under Methods: Gene Expression and Brain Parcellation, seeding was placed on the whole brain while setting the QA threshold to 0.15. The angular threshold was randomly varied from 15 to 90 degrees and the step size from 0.5 to 1.5 voxels. The fiber trajectories were smoothed by averaging the propagation direction with a percentage of the previous direction, which was randomly selected from 0 to 95%. Tracks with lengths shorter than 30 mm or longer than 300 mm were discarded. A total of 100,000 tracts were calculated, and the connectivity matrix was obtained by using count of the connecting tracks.
Multimodal neuroimaging modalities
After preprocessing the imaging modalities, the data were harmonized using ComBat78. As each site used the same scanner for all subjects, the harmonization procedure corrected for batch effects. The harmonized neuroimaging modalities were extracted for 6 measures, namely dopamine SPECT values, fALLF, fractional anisotropy, mean diffusivity, T1/T2 ratio, and gray matter density. Subjects having at least three neuroimaging modalities in at least three time points were selected. For these subjects, the modalities missing at each time point having actual individual data were automatically imputed using the trimmed scores regression with internal PCA79. Ultimately, a total of 89 subjects were included in the study with all the 6 neuroimaging modalities for an average of 4 (±0.5) time points. The average numbers of imputed time points per neuroimaging modality are presented in Supplementary Table 3.
Clinical and physical activity measures
For general clinical measures, we used eleven scores obtained from the PPMI testing battery, namely the Benton Judgment of Line Orientation Test (BJLOT)80, Hopkins Verbal Learning Test (HVLT)81, Letter Number Sequencing (LNS)82, Geriatric Depression Scale (GDS)83, Movement Disorders Society – Unified Parkinson’s Disease Rating Scale (MDS-UPDRS)84 Parts 1 (non-motor aspects of daily living), 2 (motor aspects of daily living), and 3 (motor examination), the Montreal Cognitive Assessment (MoCA)85, semantic fluency (SF), State-Trait Anxiety Inventory for Adults (STAIAD)86, and Symbol Digit Modalities (SDM)87. For the measures of physical activity, we used the three different subscores of the Physical Activity Scale for the Elderly (PASE)36, with higher scores indicating higher levels of physical activity. The subscores include PASE leisure score, PASE work score, and PASE household score. The methods for deriving all the composite scores are described in the respective PPMI protocols documentation. For each subject, we calculated the rate of change of the scores with respect to the examination date. The slopes of the clinical and physical scores are then used for subsequent analyses.
Gene expression multifactorial causal model (GE-MCM)
The GE-MCM models how alterations in different regional neuroimaging-derived biological factors and their interactions are controlled by regional gene expression patterns in the brain16,18. Simply, the model is defined by: (i) the influence of each gene on the local direct interactions among all the macroscopic imaging modalities factors, constrained within each brain region, (ii) the potential spreading of macroscopic factor-specific alterations through anatomical and/or vascular networks. (iii) the temporal changes in each macroscopic imaging factor due to (i) and (ii).
In this work, we considered six biological factors namely, brain atrophy, neuronal activity integrity, dopaminergic neuronal loss, dendritic density, and (un)directed measures of white matter integrity. The factors are derived from T1-weighted MR1, resting-state fMR1, DAT-SPECT, T1/T2 ratio, mean diffusivity and fractional anisotropy, respectively. We also considered the regional mRNA patterns of 976 genes. The temporal evolution of the disease-associated process is thus depicted mathematically as:
({N}_{{genes}}=976) is the number of genes normalized across ({N}_{{rois}}=163) brain regions of interest covering most of the brain’s gray matter. Each gene i is denoted as Gi, and ({N}_{{factors}}=6) is the number of different biological factors measured at the same brain region. The first term on the right-hand side of the equation models the local direct influences of multiple macroscopic biological factors on the given factor m. The interaction parameters (({alpha }_{o}^{nto m},{alpha }_{k}^{nto m})) and gene expression (({G}_{i}^{k})) modulate the direct within-region impact of the factor n on m, including intra-factor effects, i.e., when (n=m).({sumlimits_{mathop {j=1}limits_{jne i} }^{{N}_{{rois}}}}{C}_{{ji}}^{m}left({S}_{j}^{m}-{S}_{i}^{m}right){S}^{m}) reflects the resultant signal propagation of factor m from region i to other brain regions through the physical network ({C}_{{ji}}^{m}.frac{{{dS}}_{i}^{m}}{{dt}}) is the local longitudinal alteration of a macroscopic factor m at region i due to the foregoing multiscale interactions.
Model fitting
Using the GE-MCM differential equation, for each subject j and biological factor m, we calculated (frac{{{dS}}_{i}^{m}(j)}{{dt}}) between each pair of consecutive time points. The regional values obtained were concatenated into a subject-factor-specific vector ((frac{d{S}^{m}(j)}{{dt}})) with ({N}_{{rois}}cdot left({N}_{{times}}-1right)) unique values. This allowed us to formulate the identification of the model parameters (({alpha }_{o}^{nto m},{alpha }_{k}^{nto m})) as a regression problem (({rm{with}}frac{d{S}^{m}(j)}{{dt}}) as dependent variable). Due to the high dimensionality of the data, we used a Bayesian sparse linear regression with horseshoe hierarchy to identify the distribution of the model parameters88,89. We then obtained regression coefficients (gene-imaging parameters) as a measure of transcriptomic effect on the interaction of a macroscopic imaging-based factor with the other macroscopic factors, in driving a longitudinal biological factor alteration. We calculated coefficient of determination (R2) for each subject and neuroimaging modality as a measure of model fit.
Covariance of gene-neuroimaging parameters with clinical evaluations
Due to high dimensionality, we first reduced the number of gene-imaging parameters by selecting only the stable parameters whose population-wide 95% confidence interval (CI) excludes zero. We then applied singular value decomposition (SVD) to evaluate how the stable transcriptomic-imaging interactions mediate the rates of change in the eleven clinical scores. The aim of SVD is to identify a few pairs of ‘principal components’ that maximize the cross-correlation between the two sets of variables (i.e., gene-imaging interactions and slope of clinical evaluations). We tested for the significance of the identified principal components (PC) by permuting the mapping the gene-imaging parameters and the clinical scores. The permutation was run 1000 times and principal components with a null p < 0.05 were considered significant. To identify the genes (gene-imaging parameters) with large and reliable contributions on the significant PCs, we drew 1000 bootstrap samples and calculated the bootstrap ratio of the gene-imaging parameters. The bootstrap ratio is obtained by dividing the saliences (contributions) of the gene-imaging parameters by their respective bootstrap standard errors. Top contributing genes were obtained at a bootstrap ratio >1.96 (corresponding to 95% CI). Diseases associated with the genes were queried from DisGeNET database in Enrichr-KG90 at a significance level of q-value < 0.05. We derived the PPI networks and the associated WikiPathways from STRING database while setting the PPI confidence score cut-off to 0.731. The hub genes for each PPI network were identified by ranking according to node degrees using cytoHubba plugin91 in Cytoscape (v3.9.1)92.
Covariance of gene-neuroimaging parameters with physical activity
We again applied SVD to the stable gene-imaging parameters and the slopes of the three different PASE subscores. Significant principal components were obtained by running 1000 permutation iterations and applying a p-value threshold of 0.05. To identify the top genes mediating physical activity, we drew 1000 bootstrap samples and applied a bootstrap ratio threshold of 1.96 (95% CI). The biological pathways associated with the genes were identified by combining WikiPathways and Reactome databases via the ClueGO (v2.5.9)93 plugin in Cytoscape. For each of the significant PCs, we evaluated the contribution of each of the PASE subscores by calculating the relative variances along the axis of the PC.
Gene perturbation for drug discovery
To discover putative drugs for PD treatment, we sequentially perturbed the gene expressions in both directions. Using Eq. (1), gene expression values, most recent neuroimaging measurements, and estimated gene-imaging parameters of each subject, we simulated disease progression for two years, as captured by the longitudinal change of each neuroimaging modality. To perturb a gene, we increased or decreased its expression value by 20% across the population while keeping the values of other genes constant. We then re-simulated the disease progression for 2 years and observed the impact of the perturbation on disease progression. The relative measure of disease progression score is calculated thus:
Where Sgene is the relative disease progression score of a gene in a patient. ||Sperturbation||2 is the norm of 2-year predictions of the six predicted neuroimaging values obtained by perturbing a gene in each direction. ({{||}{S}_{{normal}}{||}}_{2}) is the norm of 2-year predictions of all neuroimaging modalities without perturbing any gene.
A gene is therapeutic if ({S}_{{gene}} < 1); i.e., disease progression induced by perturbation is slower compared to actual disease progression. For each of the perturbation direction, we ranked the genes based on the number of subjects where they are predicted to have therapeutic effects. We selected the genes in the top 90th percentile and used EnrichR94 to query the Connectivity Map (CMap)95 drug database. Specifically, the top genes that are therapeutic due to upward and downward perturbation are queried using CMap-Up and CMap-Down databases, respectively. Top putative drugs were then ranked by EnrichR combined score. Using PubChem database96, we retrieved the diseases (Therapeutic Target Database (TTD)) and the pharmacological classifications (Medical Subject Headings (MeSH)) associated with the top drugs.
Responses