PD-1 transcriptomic landscape across cancers and implications for immune checkpoint blockade outcome

Introduction
Programmed cell death protein 1 (PD-1) is a critical immune checkpoint receptor that regulates T cell function and immune homeostasis in various physiological states, including infection and autoimmunity. In cancer, PD-1 can be exploited by tumors to evade the innate immune system and promote tumor growth. The binding of PD-1 to its ligands, programmed cell death-ligands 1 and 2 (PD-L1 and PD-L2), expressed on cancer cells, leads to inhibition of T cell receptor (TCR) signaling and modulation of key cellular pathways (Fig. 1)1,2,3; this in turn results in persistent antigen stimulation and subsequent T cell exhaustion4. This finding has led to the development of multiple immunotherapy agents, known as immune checkpoint inhibitors (ICI), targeting the PD-1/PD-L1 axis in cancer.

PD‐1 interacts with both PD-L1 and PD-L2, which can be expressed on an APC or a tumor cell. Upon ligand binding, the ITSM in the intracellular tail of PD-1 can recruit tyrosine acid phosphatases such as SHP2, which then phosphorylate and inactivate molecules such as ZAP70. This signaling cascade ultimately results in the inhibition of TCR signaling, as well as suppression of the PI3K/AKT/mTOR and Ras/MEK/ERK pathways to reduce T cell proliferation and survival. Images created using draw.io. Abbreviations: PD‐L1 programmed cell death-ligand 1, PD‐L2 programmed cell death‐ligand 2, APC antigen‐presenting cell, ITSM immunoreceptor tyrosine‐based switch motif, SHP2 Src homology region 2 domain‐containing phosphatase, ZAP70 Zeta chain of T cell receptor associated protein kinase 70, TCR T cell receptor. MHC peptide-major histocompatibility 1 complex, PI3K Phosphoinositide 3-kinase.
Currently, the FDA has approved five anti-PD-1 antibodies (pembrolizumab, nivolumab, cemiplimab, dostarlimab, retifanlimab) and three anti-PD-L1 antibodies (atezolizumab, durvalumab, and avelumab)5. In a subset of cancer patients, ICI therapy is capable of eliciting deep and durable responses, resulting in significantly longer overall survival (OS). Unfortunately, biomarkers in addition to DNA mismatch repair deficiency (dMMR) and high tumor mutation burden (TMB) that accurately predict ICI response are not yet well defined6,7. PD-L1 is another existing biomarker for ICI response8; high PD-L1 expression has been shown to predict favorable ICI response in patients with non-small cell lung cancer (NSCLC)9, head and neck cancers10,11, esophageal cancer11, and gastric cancers12. However, there is currently insufficient evidence to support the use of PD-L1 expression across all cancer types as a predictor of ICI response, given inconsistent immunohistochemistry (IHC) procedures and cutoff values used to score PD-L1 expression6. For instance, the tumor proportion score (TPS) considers the proportion of tumor cells with PD-L1 expression, whilst the combined positive score (CPS) examines both the tumor cells and immune cells, with variable use across cancer types and clinical trials13,14,15,16.
Recent studies have demonstrated that the expression of PD-1 is highly variable across different cancer types and within different tumor subtypes17. PD-1 expression has been shown to correlate with immune cell infiltration and T cell exhaustion in different tumors, including NSCLC18 and melanoma19. Some reports have suggested that positive PD-1 expression by IHC on tumor infiltrating lymphocytes (TILs) may predict better outcome after ICIs20. However, the exact mechanisms underlying the regulation of PD-1 expression and its correlation with clinical outcomes in cancer patients are still not fully understood.
In this paper, we aim to characterize the RNA expression patterns of PD-1 across different cancer types and explore the relationship between PD-1 expression and clinical outcomes as well as response to immunotherapy in a previously defined patient cohort21. We show that high PD-1 RNA expression is significantly associated with improved progression-free survival (PFS) and OS in patients treated with ICI. Our results nominate PD-1 expression as a biomarker that warrants further exploration for predicting ICI response in different human cancers.
Results
Patient characteristics
A total of 514 patients with tumor samples representing 31 different cancer types were evaluated for immune gene expression using the OmniSeq assay (Supplementary Table 1)22,23,24. Altogether, 489 patients with advanced/metastatic disease had clinical therapy annotation. The median age of patients was 60.8 years, and 310 (60.3%) were female. Colorectal cancer (n = 140, 27.2% of 514), pancreatic cancer (n = 55, 10.7%), breast cancer (n = 49, 9.5%), ovarian cancer (n = 43, 8.4%), stomach cancer (n = 25, 4.9%), uterine cancer (n = 24, 4.7%), sarcoma (n = 24, 4.7%), lung cancer (n = 20, 3.9%), and neuroendocrine cancer (n = 15, 2.9%) were the most common tumor types evaluated. The distribution of tumor types was based on physician ordering of the clinical-grade immune profiling for their patients as per perceived clinical need. (Supplementary Data 1). Of the 514 patients, 217 were treated with immune checkpoint inhibitors targeting PD-1, PD-L1, and/or CTLA-4 (Supplementary Table 2).
PD-1 RNA expression differed across and within cancer types
The expression of PD-1 transcripts was stratified into three categories: “high” (75–100 percentile), “moderate” (25–74 percentile), and “low” (0–24 percentile). Out of 514 tumors examined, 93 (18.1%) had high PD-1 expression, 247 (48.1%) had moderate expression, and 174 (33.9%) had low expression (Fig. 2A). Although high levels of PD-1 RNA expression were most frequently detected in pancreatic and liver/bile duct malignancies (21.82% and 21.05%, respectively), it should be noted that 11 of the most common tumor types (uterine, neuroendocrine, stomach, head and neck, small intestine, colorectal, breast, ovarian, and lung) in the UCSD cohort demonstrated high PD-1 RNA expression in at least 15% of the samples examined. Lowest proportion of samples with high PD-1 expression was noted in occult primary cancers (7.59%). Heterogeneity of PD-1 expression was noted in all cancer types; for instance, high, moderate, and low PD-1 expression was noted in 21.82%, 49.09%, and 29.09% of pancreatic cancer samples, respectively. Finally, we evaluated the pattern of PD-1 expression in The Cancer Genome Atlas (TCGA) dataset containing 10,071 tumor samples (Fig. 2B). The three cancer types with largest proportion of “PD-1 high” expression in the UCSD cohort (pancreatic, liver and bile duct, and uterine/endometrial cancer) also demonstrated higher overall PD-1 expression in the TCGA dataset (cholangiocarcinoma, pancreatic, and uterine/endometrial cancer).
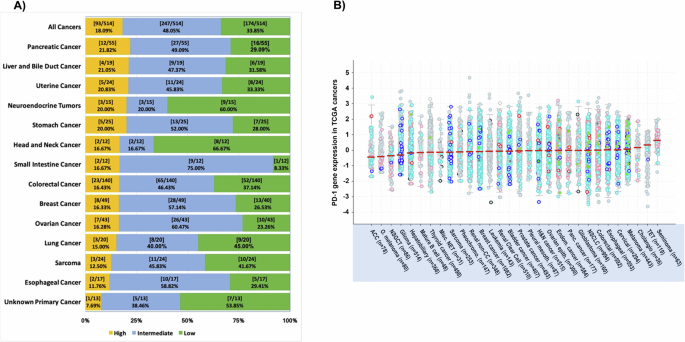
A PD-1 expression by RNA sequencing was measured as a percentile rank, with ≥75 considered ‘high’ (yellow), 25–74 as ‘intermediate’ (blue) and <25 considered ‘low’ (green), based on comparison to a reference population of 735 tumors and normalized to a value of 1–100. B PD-1 RNA expression in 10,071 TCGA cancers (as z-scores relative to all samples) is generated in cBioPortal for Cancer Genomics. Median PD-1 expression, indicated by the solid red line, is ranked from low to high (left to right), with adrenocortical carcinoma having lowest median PD-1 expression and seminoma having highest median PD-1 expression. Abbreviations: TCGA The Cancer Genome Atlas, ACC Adrenocortical Carcinoma, O. melanoma Ocular melanoma, NSGCT Non-Seminomatous Germ Cell Tumo, Misc. NET Miscellaneous Neuroepithelial Tumor, Pheochromo. Pheochromocytoma, Renal non-CC renal non-clear cell, Pleural mesoth. Pleural Mesothelioma, H&N cancer Head & Neck cancer, Ovarian epith. Ovarian Epithelial Tumor, Endom. Cancer Endometrial Cancer, Panc. Cancer Pancreatic Cancer, NSCLC Non-Small Cell Lung Cancer, TET Thymic Epithelial Tumor.
High PD-1 RNA expression independently correlated with high CTLA-4, LAG-3 and TIGIT expression
We next sought to determine whether PD-1 expression is associated with the expression of other immune checkpoint proteins. Univariate analysis revealed an association (p < 0.10) between high PD-1 expression and high expression of other immune inhibitory molecules: BTLA, CTLA-4, LAG-3, PD-L1, PD-L2, TIGIT, TIM-3, TNFRSF14, and VISTA (Table 1). Of these genes, high transcriptomic expressions of CTLA-4 (odds ratio (OR) 3.44; p = 0.002), LAG-3 (OR 4.14; p < 0.001), and TIGIT (OR 11.1; p < 0.001) were independently associated with high PD-1 expression on multivariate analysis (Table 1). High PD-1 expression was not significantly associated with a specific age group, sex, or tumor type.
High PD-1 expression is not a prognostic factor for survival in immunotherapy-naïve patients
To determine whether PD-1 expression may be of prognostic value, we analyzed OS from time of metastatic/advanced disease; we focused on the subgroup of UCSD patients that were immunotherapy naïve (n = 272) in order to avoid the potential confounding effect of ICI treatment. As demonstrated in the Kaplan–Meier model (Fig. 3), there was no significant different in OS between patients with tumors harboring high PD-1 expression compared with those having low/moderate PD-1 expression (hazard ratio (HR) 0.70; 95% confidence interval (CI) 0.43–1.16; p = 0.17).
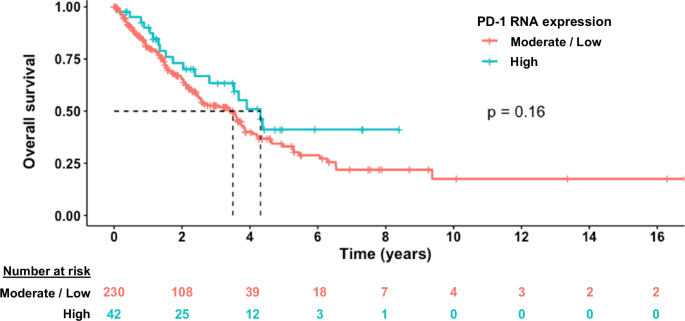
Kaplan–Meier analysis of OS from the time of metastatic/advanced disease. High transcript expression indicates ≥75th expression percentile rank. Moderate/low transcript expression indicates <75th percentile expression rank. This graph demonstrates that there is not a statistically significant difference in survival between those who have high vs moderate/low PD-1 expression, indicating lack of significant prognostic effect. P value was derived from log-rank test.
High PD-1 expression was predictive of longer survival after ICI therapy
To determine the predictive value of PD-1 expression on outcome after immunotherapy, we performed univariate and multivariate analyses in the subset of 217 patients who received immunotherapy. On univariate analysis, we found that high expression of BTLA, CTLA-4, LAG-3, PD-1, PD-L1, PD-L2, TIGIT, TIM-3, and TNFRSF14 was associated with longer OS (Table 2). Of these immune checkpoint molecules, PD-1 was the sole factor whose high expression independently associated with longer OS (Fig. 4A) after multivariate analysis (HR 0.40; 95% CI 0.18–0.92; p = 0.03). Patients whose tumors had TMB ≥ 10 mut/Mb also experienced longer OS after multivariate analysis (HR 0.50; 95% CI 0.27–0.96; p = 0.036), consistent with prior knowledge that high TMB is positively associated with immunotherapy response25.
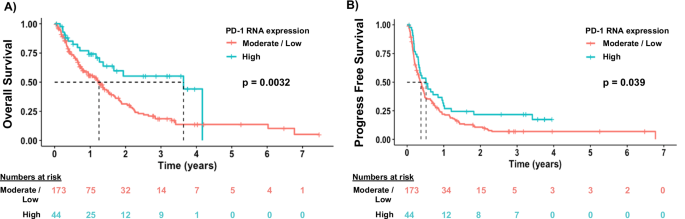
A High PD-1 RNA expression is predictive of longer OS after ICI therapy, p = 0.0032. P value was derived from log-rank test. Patients discontinued ICI at the time of progression. Red line represents low to moderate PD-1 expression. Teal line represents high PD-1 expression. B High PD-1 RNA expression is predictive of longer PFS after ICI therapy, p = 0.039. P value was derived from log-rank test. Median PFS was 4.5 and 6.2 months for moderate/low and high PD-1 expressors, respectively. In the moderate/low PD-1 expressor group, 25% of patients remained on therapy at 10.0 months; in the high PD-1 expressor group, 25% of patients remained on therapy at 14.5 months.
Conversely, high expression of NECTIN2 was independently associated with shorter OS (HR 1.50; 95% CI 1.00–2.24; p = 0.048) on multivariate analysis. Across cancer types, colorectal cancer (HR 1.72; 95% CI 1.12–2.65; p = 0.014) and pancreatic cancer patients who received immunotherapy had shorter OS (HR 2.36; 95% CI 1.06–5.25; p = 0.035), consistent with the clinical observation that both of these cancer types tend to be refractory to ICI therapy and often have poor outcomes26,27.
In the same 217 patients treated with immunotherapy, we analyzed factors associated with PFS, defined as time to progression or death from start of immunotherapy. Our univariate analysis revealed that age < 61 years, high PVR expression, and TMB < 10 mut/Mb were associated with shorter PFS (p ≤ 0.1) (Table 3). Older age (≥61 years), high expression of BTLA, CTLA-4, PD-1, and TNFRSF14, as well as TMB ≥ 10 mut/Mb were associated with a longer PFS on univariate analysis (Table 3). Kaplan–Meier curves demonstrated that high PD-1 expression was significantly associated with longer PFS compared with low/moderate expression (p = 0.039; Fig. 4B). However, no significant independent associations, including for PD-1, were identified on multivariate analysis (Table 3).
Discussion
The development of immune checkpoint inhibitor (ICI) therapy has transformed the treatment landscape and clinical outcomes for patients with both blood and solid cancers. The identification of biomarkers to accurately predict ICI response is of intense clinical interest, since this will eventually lead to the nomination of patients that benefit from ICI28,29. Given that ICI can be associated with serious complications, selecting the right patients for ICI therapy while mitigating the risk of ICI-related adverse events is an important clinical consideration. The tumor or immune cell expression of PD-L1, high microsatellite instability (MSI-H), and high TMB, as well as specific HLA genotypes and T cell receptor repertoires, are currently accepted as biomarkers predictive of benefit from ICI therapy30. Of these above, PD-L1 expression, as quantified by IHC, is the most widely implemented biomarker to guide patient selection for ICI treatment. Multiple commercial PD-L1 assays using different antibody clones (Dako 22C3 and 28-8; Ventana SP142) are available for clinical use, and there is a high level of inter-assay variability31. For instance, a prospective, multi-institutional NCCN study comparing the performance of various PD-L1 antibodies in NSCLC showed that SP142 was the least sensitive antibody32. Results of the Blueprint Phase 2 Project evaluating five PD-L1 assays also showed lower sensitivity for SP142, as well as poor reliability of immune cell PD-L1 scoring by a panel of international pathologists33. A recent study further showed the utility of performing PD-L1 RNA-sequencing from tumor tissues in addition to IHC, particularly when PD-L1 is quantified as low or negative by IHC, to improve patient selection for ICI treatment32. Finally, PD-L1 expression (both protein and RNA) may also exhibit intra- and intertumor heterogeneity, and a single tumor biopsy that does not reflect the full spectrum of its expression may be erroneously used to select patients for anti-PD1/PD-L1 therapy. In summary, although widely used, PD-L1 remains an imperfect predictive biomarker of ICI response due to both technical and clinical challenges8.
Recent studies have demonstrated an emerging role for PD-1 expression in predicting ICI response. A multi-omic (whole exome and RNA sequencing) analysis of 7187 patients from The Cancer Genome Atlas, coupled with objective response rates (ORR) data of 21 cancer types from clinical trials, revealed CD8 + T cell abundance as the most predictive of response to ICI (anti-PD-1/PD-L1), followed by high TMB and high PD-1 gene expression34. Another study focused on evaluating the relationship between immune cell or TIL PD-1 expression and clinical outcome after ICI treatment in a cohort of 123 patients with different solid cancers17; TIL PD-1 expression (≥1% versus <1%) was associated with higher ORR, as well as increased median PFS (7.0 vs 1.9 months, p = 0.006) and OS (18.1 vs 8.0 months, p = 0.04).
In the current study, we re-interrogated the expression of immune checkpoint proteins, as determined through bulk tumor RNA-sequencing, from a well-annotated clinical cohort. We demonstrate that high PD-1 expression, while lacking prognostic value in immunotherapy naïve patients, was significantly associated with longer survival in patients who received ICI treatment. In multivariate analysis, high PD-1 expression remained predictive of OS but not PFS after immune checkpoint blockade. Consistent with our results, discordance between early efficacy endpoints (PFS and ORR) and OS has been reported, including in several landmark ICI trials, in which statistically significant improvements in OS without a meaningful PFS benefit were noted14,35,36; this discordance is specifically discussed in a recent publication from the Food and Drug Administration (FDA).37 The FDA noted that the lack of PFS effect may be due to the special mechanism of action of ICI therapy, which affects the rate of tumor growth rather than incurring direct cytotoxicity, as is the mechanism of action of conventional chemotherapies.
One of the limitations of the study was that bulk RNA expression did not permit us to ascertain the cell type from which PD-1 expression originated. Given bulk RNA-sequencing data, it is possible that PD-1 RNA expression in the tumor samples analyzed emanated from TILs; this question merits future investigation. We acknowledge a second limitation of our analysis in that tumor tissue was not available for interrogation of PD-1 protein levels. Despite this, our paper validates findings in a different patient cohort in which PD1 TIL IHC levels were predictive of ICI outcome20, and a prior multi-omic analysis that showed that PD-1 was amongst the most robust predictors of ICI outcome34. A third limitation of our study is the relatively small cohort size for individual tumor types. It is possible that PD-1 expression may be variable in different tumor types and have different optimal cut-off values; the limited number of patients in each tumor type precluded robust analysis of this issue, but it merits investigation in future studies. On the other hand, finding that high PD-1 correlates with survival after ICI across tumor types may point to the generalizability of these observations. Additional validation of our results using larger cohorts of patient data, as well as prospective evaluation, are needed to confirm high PD-1 as a biomarker of better ICI outcome.
Finally, our results demonstrated that high PD-1 expression was also significantly associated with elevated expression of CTLA-4, LAG-3, and TIGIT, which are notable checkpoint targets outside the PD-1/PD-L1 axis38,39,40. LAG-3 is a checkpoint molecule that inhibits CD4 T cell activation through Class II MHC binding21; TIGIT, upon binding to its ligand PVR, also inhibits T cell activation and NK cell cytotoxicity41. Our findings support the co-targeting of LAG-3 and TIGIT, along with PD-1/PD-L1, to maximally activate the cytotoxic T cell response. We envision that, in the near future, as the number of non-PD-1/PD-L1 ICI increases, the implementation of “precision immunogenomics” will have a significant impact on patient outcomes. As we have shown that there exists significant heterogeneity in PD-1 gene expression both across and within cancer types, this heterogeneity could be extrapolated to other checkpoint proteins, setting the stage for comprehensive immune checkpoint profiling for every patient. Although targeting one or more immune checkpoints may ultimately lead to a more potent anti-tumor response, this also potentially elevates the risk of severe immunotherapy-related adverse events. The latter emphasizes the importance of identifying factors or biomarkers that predict the emergence of immunotherapy-related toxicity.
In conclusion, our study demonstrates that high PD-1 transcript expression correlates with high levels of other checkpoints such as CTLA-4, LAG-3, and TIGIT. Furthermore, high PD-1 associates significantly and independently with longer survival after immune checkpoint blockade. Future prospective studies may be needed to validate PD-1 as a biomarker for ICI responsiveness, and to determine if composite biomarkers (such as PD-1 and TMB) may be useful in predicting the complex and multifaceted response to PD-1/PD-L1 blockade in cancers.
Methods
Patient cohort
The RNA expression levels of PD-1 were examined in 514 solid tumor samples from patients at the University of California San Diego (UCSD) Moores Center for Personalized Cancer Therapy clinic. All patients had metastatic disease at the time of data collection22,24,28,42. Data cut-off date was June 24, 2022. This study was conducted in accordance with the guidelines of the UCSD Institutional Review Board (Study of Personalized Cancer Therapy to Determine Response and Toxicity, UCSD_PREDICT, NCT02478931), as well as informed consent from all participants and any other relevant ethical regulations including the Declaration of Helsinki.
Sampling of tissue, RNA quality, and analysis of immune gene expression
The samples were formalin-fixed, paraffin-embedded (FFPE) tumors that were evaluated by RNA sequencing at the OmniSeq laboratory (https://oncology.labcorp.com/cancer-care-team/test-menu/omniseq-insight). The OmniSeq immune response assay is a NYS CLEP approved, CLIA lab run assay analytically validated to ensure accuracy, sensitivity and specificity. As previously described23, performance characteristics were established using RNA derived from a wide range of FFPE tissue types including resections, punch biopsies, needle cores, and fine needle aspirate cell blocks. A wide range of preanalytical, analytical, and reproducibility studies addressed variability in specimen format, neoplastic content, necrosis, RNA input amounts, DNA contamination of RNA, batch size, and linearity of detection across all genes within a wide distribution of signal on overall immune response signature. RNA was extracted from FFPE using the truXTRAC FFPE extraction kit (Covaris, Inc., Woburn, MA) and subsequently dissolved in 50 µL water. The yield was measured through Quant-iT RNA HS assay (Thermo Fisher Scientific, Waltham, MA), and a pre-defined titer of 10 ng of RNA was deemed acceptable. All samples included in the study met RNA quality and input criteria for clinical testing. RNA expression absolute read count estimation was computed using Torrent Suite’s plugin immuneResponseRNA (v5.2.0.0) and the limit of detection for gene transcripts was ≥20 normalized reads per million (nRPM). Custom scripts were used to perform background subtraction, normalization, and percentile ranking.
Using an internal housekeeping gene profile dataset of 735 tumors encompassing 35 tumor histologies, transcript abundance was normalized and ranked into percentiles. For PD-1 RNA expression, “low” was defined as 0–24 percentile, “moderate” defined as 25–74, and “high” defined as 75 –100 percentile. Gene expression profiles of markers associated with T cell recognition and checkpoint receptors (BTLA, CTLA-4, LAG-3, NECTIN2, PD-1, PD-L1, PD-L2, PVR, TIGIT, TIM-3, TNFRSF14, VISTA) were examined (Supplementary Table 3)41,43,44,45,46,47,48,49,50. The expression profiles were then stratified by transcript abundance rank values into “Moderate/Low”(0–74), and “High” (75–100) percentile.
TMB was evaluated by obtaining genomic DNA from qualified FFPE tumors (>30% tumor nuclei) using the Covaris truXTRAC FFPE extraction kit with 10 ng DNA input for library preparation. DNA Libraries were readied with Ion AmpliSeq targeted sequencing chemistry utilizing the Comprehensive Cancer Panel, followed by enrichment and template preparation utilizing the Ion Chef system, and sequencing on the Ion S5XL 540 chip (Thermo Fisher Scientific). After removal of germline variants, indels and single nucleotide variants with <5% variant allele fraction, and synonymous variants, TMB is reported as eligible mutations per qualified panel size (mutations/megabase).
Outcome analysis
The relationship between PD-1 expression and immunotherapy outcome was ascertained by Kaplan–Meier analysis and log-rank test, which were used to evaluate the PFS and OS after ICI therapy (starting from the date of therapy initiation) (n = 217 patients). We used the univariate and multivariate Cox proportional hazard model to analyze correlations between survival and expression profiles of immune genes as well as patient factors. The prognostic impact (survival from the time of metastatic/advanced disease) of PD-1 expression was also analyzed by Kaplan–Meier method in a subgroup of 272 patients who were immunotherapy naïve using R software (Supplementary data 2). For all analyses, patients still progression-free at time of last follow up were censored at that time point for PFS, and those still alive at last follow up were censored for OS at that time point.
Responses