Perfluoroalkyl substances concentration from groundwater via direct contact membrane distillation

Introduction
Per- and polyfluoroalkyl substances (PFASs) are emerging toxic contaminants which are amphiphilic organic molecules comprising of hydrophobic fluorinated alkyl chains terminated by either hydrophilic carboxylic or sulfonic acid functional groups1. The inherent stability of strong carbon-fluorine bond allowing PFAS exhibiting non-volatile and non-degradable properties2. PFASs have been widely used in industries for consumer products such as paper packaging, textiles, pesticides, coatings, cosmetic products, semiconductors, and fire-fighting foams3,4. PFASs are highly soluble in aqueous solutions, reaching up to 9.5 g/L at 25 oC5, allowing widespread transfers to biomes and living organisms. PFAS-contaminated water sources are abundantly found in industrial areas, fluorochemical facilities, landfill areas, as well as, fire-fighting areas such as airports and training sites6,7. PFAS exposure to organisms and human was found to lead to major health conditions such as cancer, diabetes, hormone and thyroid disruptions, cardiovascular diseases, liver and kidney alteration3,8. Perfluorooctanoic acid (PFOA) and perfluorooctane sulfonate (PFOS), which are the most abundant PFAS compounds used to date, have therefore been listed as persistent organic pollutants within the International Stockholm Convention9, and multiple countries have set drastically low permissible limits in waste and drinking water. As an example, the United States Environmental Protection Agency (EPA) has set lifetime advisory limits of 4 and 20 pg/L for PFOA and PFOS in drinking water10,11. A major and unexplored source of contaminated waters is groundwater, where the diffusion of PFAS has shown alarming increases due to its long-term accumulation and limited degradation potential once absorbed or stored in aquifers. Studies have revealed that PFAS detection in groundwater occurs twice as frequently as in surface water12,13. To protect aquatic ecosystems, regulatory standards have set environmental concentration limits for PFOA and PFOS in groundwater at 5.1 and 13 ng/L, respectively14,15.
Various technologies have been trialed for PFAS remediation targeting minimum PFAS discharge to the water sources16, such as adsorption17,18, sonochemical degradation19,20, electrochemical21,22, and biological treatments23,24. These approaches require high chemical and energy consumption and extended treatment durations, particularly when treating PFAS at low concentrations. Membrane separation techniques, including pressure-driven nanofiltration (NF) and reverse osmosis (RO), have been successfully demonstrated for PFAS removal from contaminated water sources25,26. However, the pressure applied during the filtration rendered the NF and RO membranes vulnerable to PFAS and organic fouling, suffering a sharp flux decline of up to 60% within a short duration, limiting the process efficiency27,28. Membrane distillation (MD) has emerged as a promising approach to effectively concentrate non-volatile compounds and dewatering toxic sludge solutions without major breakthroughs or surface fouling challenges29,30,31. MD is a thermal-driven membrane separation technique whereby volatile compounds or solvents are selectively evaporated at the interface between a solution and a porous membrane, prior to being condensed downstream, yielding a high recovery rate of the solvent, water in most cases. MD offers various advantages over pressure-driven membrane separation systems since able to operate at high salinity level and in high total organic carbon (TOC) matrixes, where surface fouling becomes rapidly a severe issue for technologies such as NF or RO. Although MD has the potential in concentrating pollutants such as PFAS very limited studies have been developed on amphiphilic pollutants, particularly in terms of long-term pore wetting, that remain general challenges during MD operation. A demonstration of PFAS concentration with model pure PFAS solution through direct contact membrane distillation (DCMD) was performed by our team, showcasing the need for evaluating more complex aqueous matrices and materials32.
The challenges associated with PFAS exposure to polymeric materials have garnered attention, revealing a correlation between PFAS-materials interactions and issues such as premature membrane failure and altered separation performance32,33. These interactions can manifest through various mechanisms such as adsorption, chemical bonding, and hydrophobic interactions between PFAS molecules and polymer chains34. PFAS molecules typically adhere to polymer surfaces via weak Van der Waals forces or electrostatic interactions, depending on the physicochemical properties of the polymer35. Polymers featuring hydroxyl, carboxyl, and amino functional groups tend to form strong chemical bonds with PFAS molecules. Additionally, hydrophobic domains within polymers attract PFAS molecules through hydrophobic interactions, facilitating PFAS adsorption onto the polymer surface36. Integration of PFAS molecules into polymeric material structures may induce plasticization, weakening the macromolecular chain between adjacent domains of polymer chains and partially softening the material37. Thus, meticulous evaluation of appropriate polymeric materials for PFAS removal is imperative for advancing PFAS removal technologies and designing affinity materials tailored for PFAS removal applications.
This study evaluates the long-term removal of PFAS compounds from groundwater by DCMD with commercial hydrophobic membranes to reveal both fouling behaviors and assess the material’s stability over time. The separation performance of DCMD membranes for PFOA removal from contaminated groundwater was assessed over long-term operation. Fouling mechanisms were related to the surface interactions between the PFAS compounds and the membrane materials based on thorough materials autopsy analysis. This work revealed a new pathway for PFAS-contaminated groundwater treatment and highlighted the future development of the next generation of robust DCMD membranes working in complex PFAS-water matrix.
Methods
Materials
PTFE and PVDF flat sheet membranes with an average pore size of 0.20 µm were purchased from Hawach Scientific Co., Ltd. (Shaanxi, China). Deionized (DI) water obtained from the Milli-Q Plus 185 purification system (Millipore Corp., USA) was used for all experiments. PFOA-contaminated water was prepared by dissolving 10 mg/L PFOA (MW: 414.07 g/mol) in DI water. Besides, PFOA-contaminated model groundwater was prepared by dissolving 336 mg/L sodium bicarbonate (NaHCO3), 222 mg/L calcium chloride (CaCl2), 30 mg/L potassium chloride (KCl), and 10 mg/L PFOA in DI water, while model groundwater was prepared as a control to evaluate the fouling propensity of membranes upon to PFOA and inorganic compounds38. All the chemicals were procured from Sigma-Aldrich (USA), received in analytical grade, and used without further purification.
DCMD setup and operations
The removal of PFOA-contaminated aqueous solution was evaluated by performing DCMD tests using the PTFE and PVDF membranes. The membrane module was placed vertically, allowing the hot feed solution and the cooling water to flow through to the top side of the module. The inlet temperatures of the hot and cold streams were controlled at temperatures of 60 and 20 oC, respectively, using two heat exchangers. The flow rates of hot and cold streams were controlled at 0.4 L/min by using a dual-channel peristaltic pump (Huiyu Weiye (Beijing) Fluid Equipment Co., Ltd, China). The feed and permeate solutions were kept in jacketed reservoirs and circulated through the membrane module using the peristaltic pump. All the reservoirs and lines were thermally insulated to minimize temperature loss. The membranes were set into a rectangular home-made PTFE module, offering a rectangular geometry for the membranes, with dimensions of 6 by 7 cm for a total area of 42 cm2. The module feed and outlet inlets were slit-like, offering a laminar flow across the entire surface of the membrane, and a fresh membrane was used in each test. Two series of experiments were conducted for PTFE and PVDF membranes, each over an operating period of 8, 16, 24, 48, and 104 h, to evaluate the temporal membrane fouling propensity upon PFOA-contaminated water. The inlet temperatures of hot and cold streams and the feed conductivity were manually measured in 4 h interval time. The conductivity of the permeate was measured by a conductivity meter (Apera Instruments, USA) and data-logged continuously. The permeate was collected in the cold jacketed reservoir and automatically weighed using an electronic balance. The average hourly permeate flux, Jp was calculated based on the ratio of the permeate weight collected per hour to the active membrane area used in the experiments. The feed solution was kept constant at the original volume of 2 L in the hot jacketed reservoir by replenishing the permeate product every 4 h interval in order to prevent concentration build-up in the reservoir and discern the fouling propensity of the membranes upon PFOA contaminant. Lastly. The DCMD tests were repeated for 120 h using PFOA-contaminated model groundwater to assess the practicality of the system for PFAS-contaminated groundwater treatment (Supplementary Fig. 1).
Materials characterization
The morphological characteristics of the PFOA-exposed PTFE and PVDF membranes was examined by scanning electron microscopy (SEM) (JEOL JSM-7610F, Japan) at accelerating voltage of 5 kV and working distance of 8 mm. Prior SEM imaging, the samples were sputtered by gold layer to reduce the charging effect. The surface roughness of the PFOA-exposed membranes were measured using an atomic force microscope (AFM) (Asylum Research, USA). The topography was scanned in non-contact mode with the cantilever, and the images were acquired in an area of 10 μm × 10 μm. The root-mean-squared surface roughness (Rrms) values of the pristine and fouled membranes were analyzed using Gwyddion software, and the average Rrms values were reported based on three field analyses on each sample.
The attenuated total reflectance Fourier transform infrared spectroscopy (ATR-FTIR) (Bruker Alpha-Platinum ATR, USA) was employed to determine the presence of PFOA functional groups in the membranes. The samples were examined under ambient conditions in the range of 400–4000 cm−1 at a scan rate of 24 scans per minute and resolution of 2 cm−1. The elemental composition and chemical structural change of the membranes were examined through an X-ray photoelectron spectrometry (XPS Escalab Xi+, Thermo Fisher Scientific, USA) equipped with monochromatic aluminium K-alpha radiation of 1486.6 eV operating at constant transmission energy of 40 eV under vacuum condition of 10 mbar. The samples were loaded into XPS without surface etching treatment to ensure the PFOA foulant deposition remained on the membrane surface for chemical composition analysis. The charging effect was corrected by adjusting component C-1s transition assigning to C–C bond at binding energy of 284.5 eV. The acquired spectra were then analyzed using CasaXPS software (Casa Software Ltd, United Kingdom).
The contact angles of 10 µL sessile DI droplet on the PFOA-exposed membranes were computed by Krüss GmbH Drop Shape Analyzer (DSA) with ten measurements taken at different spots under ambient conditions. In addition, sessile PFOA was dropped onto the pristine membrane surfaces and the contact angles were computed over 60 s to investigate the possibility of membrane wetting resulted from the PFOA surfactant.
A capillary flow porometry (Porolux™ 1000, Porometer, Belgium) was used to analyze the extent of pore blocking of the membranes caused by PFOA compounds via pore size distribution (PSD). The membrane samples were cut and placed onto a 25-mm diameter sample holder and then thoroughly wetted by the Porofil™ liquid before the analysis. The measurement was subjected to pressures ranging from 0.5 to 4.5 bar to obtain wet and dry curves for PSD analysis.
Analytical techniques
The sodium (Na), potassium (K), calcium (Ca), and chloride (Cl) ion concentrations of the model groundwater feed and the permeate obtained after DCMD test were analysed by ion chromatography (IC) (Dionex ICS-5000) to determine the salt rejection of the membranes after exposure to PFOA compounds. All the samples were prefiltered by 0.22-µm syringe filter PES membrane to remove the particle impurities. The feed and permeate samples were diluted up to 100 and 10 factors, respectively, prior to the IC analysis.
The PFOA concentration of the permeate was quantified using ultra-performance liquid chromatography (UPLC) coupled with a SCIEX 5500 triple quadrupole mass spectrometry. The UPLC was operated with a column temperature of 40 °C and a mobile phase consisting of 20 mM ammonium acetate (A) and methanol (B), employing a Gemini® C18 column (2.1 × 50 mm, 3 μm, Phenomenex). The elution flow rate was set at 0.60 mL/min, and a gradient elution program was utilized as follows: A:B = 90:10 at the beginning, A:B = 45:55 until 0.1 min, A:B = 1:99 until 4.95 min, A:B = 90:10 for 5–6.5 min. MS analysis was conducted in negative polarity mode, with an ion-spray voltage of −4500 V and a source temperature of 600 °C. The flow rate was maintained at 0.60 mL/min, and an injection volume was 10 μL. To avoid interference from contaminants generated during sample preparation, a blank comprising 50% methanol was conducted. All the samples were prefiltered by using a 0.22-μm PES syringe filter to reduce interference caused by particles. Subsequently, all the samples were diluted to ng/L level using 50% methanol. Triplicate analyses were performed to obtain the average PFOA concentration in the permeate and feed. A standard calibration curve of PFOA in a concentration range of 1000 to 20,000 ng/L was obtained with linear R2 of 99.91% to determine the PFOA concentration of the samples. The PFOA rejection of the membranes was calculated based on the difference between the initial PFOA concentration in the feed and the PFOA concentration in the permeate over the initial PFOA concentration in the feed. Error bars were plotted for each data set based on experimental variations from standard deviations and statistical analysis.
Results
The performance of both commercial PTFE and PVDF membranes for PFOA concentration from model groundwater was evaluated by DCMD to examine the temporal fouling of PFOA compounds across the membranes. The systematic performance analysis will be followed by a morphological and chemical structural analysis to assess the changes to the membrane materials due to interactions with the PFOA.
PFOA removal performance in DCMD
The DCMD permeate pure water flux and mixed PFOA-water flux are reported for a duration of 104 h in Fig. 1, along with PFOA rejection achieved for both PTFE and PVDF membranes. For the PTFE membrane, the initial flux upon PFOA solution increased from 18 to 21 kg/m2/h in the first 14 h operation, and the rejection of PFOA was dropped from 95 to 85% compared to the pure water flux data (Fig. 1a–c). The sharp decrease of PFOA rejection for the PTFE membrane is related to PFOA surface diffusion across the membrane, as seen from the gradual increase of PFOA concentration on the permeate side over time (Fig. 1d). The PFOA concentration increased to 5 mg/L in the permeate over the 104 h operation, leading to significant rejection drop of 51%. The increase of the water permeate flux in the beginning stage was related to the increased water vaporization resulted from the initial surface hydrophobization of the PTFE membrane surface resulting from PFOA compounds adsorption32. Between 15 and 85 h, a significant drop in the permeate flux for the PTFE membrane from 19 to 12.5 kg/m2/h was also observed. This may be attributed to surface fouling by PFOA leading to a reduced water evaporation rate. The increase of flux during 86–96 h operation was attributed to direct membrane wetting due to the PFOA bridging the membrane and, therefore, facilitating direct liquid transfer.

a Average pure water flux of pristine PTFE and PVDF membranes. b Average hourly permeate flux of the membranes upon exposure to 10 mg/L PFOA aqueous solution. c PFOA rejection attained by the membranes, and d PFOA concentration in the feed and permeate side of DCMD over 104 h operation. Test conditions: Feed solutions were fixed at 60 oC, while DI water was used as a cooling medium in the permeate side at 20 oC. The average pore size of both PTFE and PVDF membranes is 0.2 µm.
For the PVDF membranes, the flux across the membranes for PFOA concentration was found to be relatively stable over time, with a slight reduction of 12% compared to the pure water flux over the 104 h duration. This change may be attributed to the feed solution partial water vapor pressure change upon PFOA addition and to surface fouling consequently reducing the water evaporation rate. Overall, the PFOA rejection of the PVDF membrane was higher than the PTFE membrane (80 vs 51%) over the 104 h duration.
PFOA removal for groundwater treatment and practical implications
PFOA removal was further evaluated with a model groundwater solution dosed with low and high PFOA concentrations to investigate the interaction of inorganic compounds with PFOA as well as their effect on the separation efficacy over long-term DCMD operation.
As presented in Fig. 2a, the flux of the PTFE membrane tested with low PFOA-dosed groundwater was found to be slightly lower than that obtained with pure groundwater in the first 24 h operation (16 vs 18 kg/m2h), followed by a gradual decline from 16 to 11 kg/m2h over time. This flux decline could be attributed to the lower vapor pressure of groundwater containing PFOA molecules in the feed, and PFOA adsorption on the PTFE membrane surface that reduced the water evaporation rate on the feed-membrane interface layer. Likewise, the flux behavior of the PTFE membrane tested with high PFOA-dosed groundwater was similar to the flux of 10 mg/L PFOA aqueous solution, as shown in Fig. 1b. The initial flux of high PFOA-dosed groundwater was higher than the pure groundwater flux, followed by gradual decline and lastly with an increase of the flux over 120 h DCMD operation. This similar flux behavior proved that the presence of inorganic ions in water did not reduce PFOA fouling propensity on the membrane. As seen in Fig. 2c, the PTFE membrane fouling was predominantly covered by a large PFOA deposit layer with visible inorganic scales. This may be attributed to the adsorption of inorganic cations onto the membrane surface, leading to the suppression of electrostatic shielding effect, thus enhancing PFAS anion adsorption and accumulation on the membrane39,40. In addition, PFAS retained on the membrane surface due to hydrophobic interactions between the uncharged fluorinated alkyl chain and the membrane via Van der Waals interaction41,42. The permeate was contaminated more pronouncedly when the PTFE membrane was exposed to a higher PFOA dose, and the permeate conductivity spiked up to 213 µS/cm at the end of the test, as shown in Fig. 2b, leading to a significant salt rejection drop of 50%. PFOA diffusion and liquid intrusion may have compromised permeate quality, possibly due to a PTFE fibril break observed in Fig. 2c.
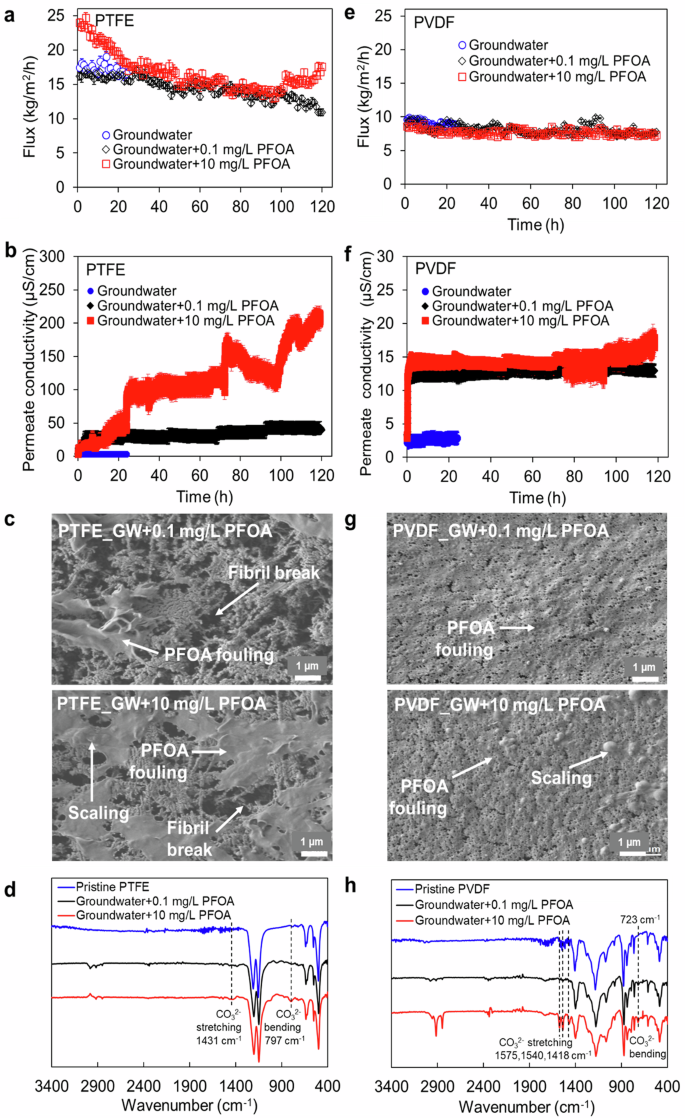
Data for PTFE membranes including a average hourly flux, b permeate conductivity, c SEM showcasing surface fouling and fibril damage and d FTIR spectra showcasing the impact of PFAS in groundwater; data for PVDF membranes including e average hourly flux, f permeate conductivity, g SEM showcasing surface fouling and fibril damage and h FTIR spectra showcasing the impact of PFAS in groundwater.
For the PVDF membrane, the permeate flux tested with both low and high-dosed groundwaters was found to be the same as that obtained with pure groundwater, as depicted in Fig. 2a. PVDF membranes exhibited stable flux over long-term operation regardless of the PFOA concentration level in the feed. These results imply that the interactions of PFOA with PVDF membrane may be not significant. As seen in Fig. 2c, the PVDF membrane was mildly deposited by a PFOA fouling layer, and its porous structure was retained after 120 h of operation. Excellent permeate quality was obtained with a low conductivity value of 18 µS/cm (Fig. 2b). Overall, the PVDF membrane achieved a higher salt rejection of up to 90% when exposed to lower concentrations of PFOA contaminants in groundwater. Similar to its rejection rate when exposed to the PFOA-water mixture, the PVDF membrane exhibited a PFOA rejection rate of 80% after prolonged exposure to PFOA-contaminated groundwater (data not shown).
Table 1 shows the previous studies on commercial RO and NF membranes for PFAS removal from contaminated waters. Most RO and NF membranes achieved 70–99% PFAS rejection, depending on membrane properties and operating conditions27,28,43,44,45,46. The PVDF membrane used in this study showed comparably high PFOA removal of up to 80% via DCMD and on a par with the removal by pressure-driven filtration processes with the advantage of experiencing lower flux decline attributed to fouling (15% vs 10–60%). It is also discovered that the hydrophobic PVDF membrane outweighed the performance of the PTFE membrane and hydrophilic PVDF membrane that have been reported in previous works32,47 by exhibiting more stable flux and higher PFOA rejection in a longer duration. Our results highlight the potential benefit of PVDF membrane in achieving water recovery while pre-concentrating PFAS solution in the feed side of DCMD for remediation of groundwater contaminated with PFAS. DCMD with the use of PVDF membrane with lower fouling intensity could also be applied for the treatment of other PFAS-contaminated water sources with high inorganic fouling potential, such as surface water, seawater, and brine. The analysis of the autopsy of the materials in terms of morphology and chemical composition will be performed in the following sections to reveal the long-term fouling and PFAS-membrane fouling mechanisms.
Autopsy of the membrane materials exposed to PFOA
The surface morphology of the PTFE membrane was evaluated at different times of testing, as shown within the SEM images in Fig. 3. After 8 h of DCMD operation, the PTFE membrane showed a clear thin fouling layer, suggesting PFOA adsorption onto the membrane surface. Compared to the pristine PTFE membranes exhibiting a fibrillary morphology, the PFOA-exposed PTFE membranes showed that the fibrils became more globular and aggregated, suggesting PFOA adsorption and accumulation around the PTFE fibrils (Fig. 3a, b). From 16 h of operation, much more extensive fouling occurred, with accumulation covering ~80% of the surface pores in a patchy manner (Fig. 3c–f). The patchy and dense PFOA fouling layer expanded to cover a larger area over time. Such extensive fouling layer led to a smoothing effect on the PTFE membrane surface and resulted in lower root-mean-square roughness, Rrms value, as revealed within AFM 3D images in Fig. 3. As compared with the Rrms of the pristine PTFE membrane (74.71 ± 13.33 nm), the Rrms of PTFE membrane was reduced by 57% (32.20 ± 4.89 nm) after 104 h of operation. Significant PFOA fouling layer extent also resulted in the large shift of pore size distribution of the PTFE membranes to smaller pore size (Fig. 4a). Partial pore blocking across the membrane attributing to the PFOA adsorption had reduced the membrane average pore size by 30% from 0.21 ± 0.01 to 0.15 ± 0.03 mm after 104 h of operation. These findings can explain the sharp flux decline of PTFE membrane as depicted in Fig. 1b. The accumulated PFOA fouling layer decreased the water contact angles of PTFE membranes by up to 11%, from 148.3 ± 1.0o to 131 ± 4.2o over the 104 h period (Fig. 4c). This indicates that PTFE membranes became less hydrophobic after being fouled by the PFOA deposition layer. Furthermore, based on the 60-s sessile drop test, the PFOA compounds acted as surfactant, and immediately hydrophilized the pristine PTFE membrane surface, as evidenced by the lower contact angle of the sessile drop of 10 mg/L PFOA compared to the water contact angle (Fig. 4d). As revealed by SEM (Fig. 3d–f), starting from 24 h, the fibrils of PTFE membranes experienced damage and subsequent fibril loss after 104 h of operation. The structural defects of the PTFF membrane led to alterations in separation performance and pore wetting, as observed in the sudden increase in the permeate flux and poor PFOA rejection (Fig. 1b, c).
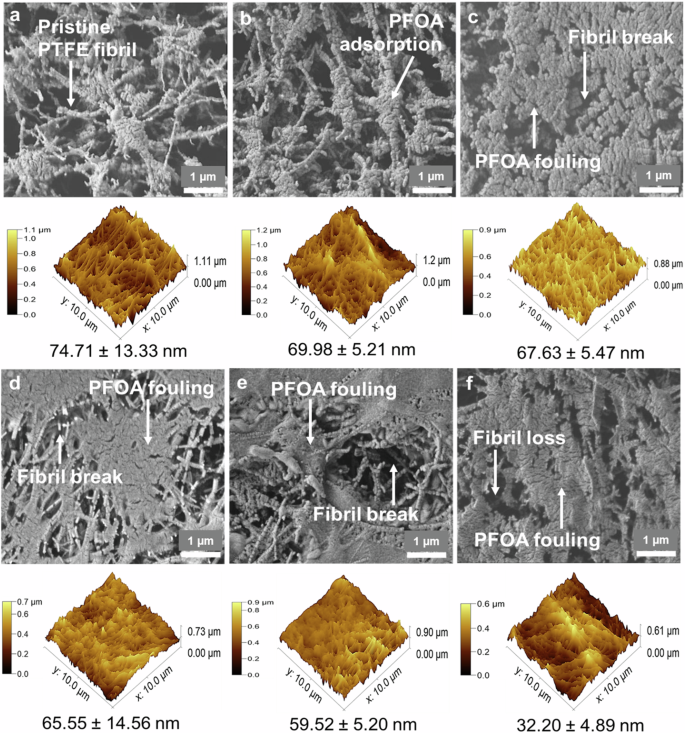
Morphological assessment of the a pristine PTFE membrane, b 8 h, c 16 h, d 24 h, e 48 h, and f 104 h tested membranes over DCMD operation at a feed temperature of 60 oC and permeate temperature of 20 oC. through SEM (top) and AFM (bottom).
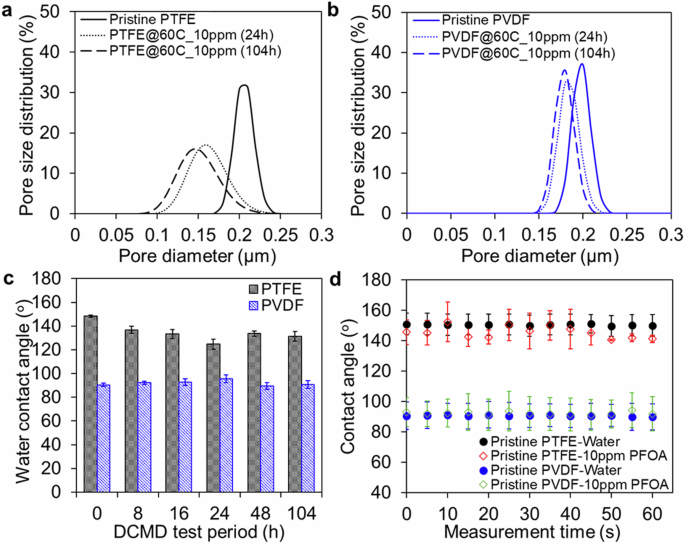
Pore size distribution of 24 h and 104 h tested a PTFE membranes and b PVDF membranes compared to the pristine membranes over DCMD operation. c Hydrophobicity degree of PTFE and PVDF membranes over DCMD operation time compared to the pristine membranes. d Wettability of pristine PTFE and PVDF membranes upon 60 s exposure to a sessile drop of 10 mg/L PFOA solution.
As opposed to the PTFE membranes, after 8 and 16 h of DCMD operation, the PVDF membranes displayed a sponge-like porous structure similar to the pristine membrane morphology, indicating minimal visible deposition of PFOA as observed in SEM images (Fig. 5a–c). However, fouling became evident after 24 h of operation, with PFOA adsorption covering ~30% of the surface pores of the PVDF membrane in a continuous manner (Fig. 5d–f). This PFOA fouling layer progressively deposited the membrane surface over time without fully obstructing the pores. The PFOA fouling layer on PVDF membranes did not alter the membrane surface roughness. The Rrms of the PVDF membrane (14.03 ± 2.11 nm) tested after 104 h of operation was almost the same as the Rrms of the pristine PVDF membrane (15.85 ± 1.67 nm) (Fig. 5). Furthermore, the average pore size of the PVDF membrane over the 104 h test only reduced by 10% from 0.20 ± 0.01 to 0.18 ± 0.01 mm (Fig. 4b). The minimal reduction in average pore size due to PFOA fouling fell within the range of pore size variation observed in the pristine PVDF membrane. This indicates that the fouling layer of PFOA may be loosely attached to the membrane surface. Additionally, the hydrophobicity of PVDF membranes remained unchanged throughout the 104 h operation. The water contact angles (90.8 ± 3.3o) of the tested PVDF membranes were almost the same as that of the pristine membrane (90.4 ± 1.3o) (Fig. 4c). Furthermore, the contact angle of the sessile drop of 10 mg/L PFOA was almost the same as the water contact angle on the PVDF membrane surface (Fig. 4d), suggesting a weak interaction between the PVDF membrane surface and PFOA compounds. The weak PFOA- PVDF interaction could retain the PVDF membrane integrity, as no structural defect was observed on the PVDF membrane over the 104 h operation, as shown in SEM in Fig. 5f.
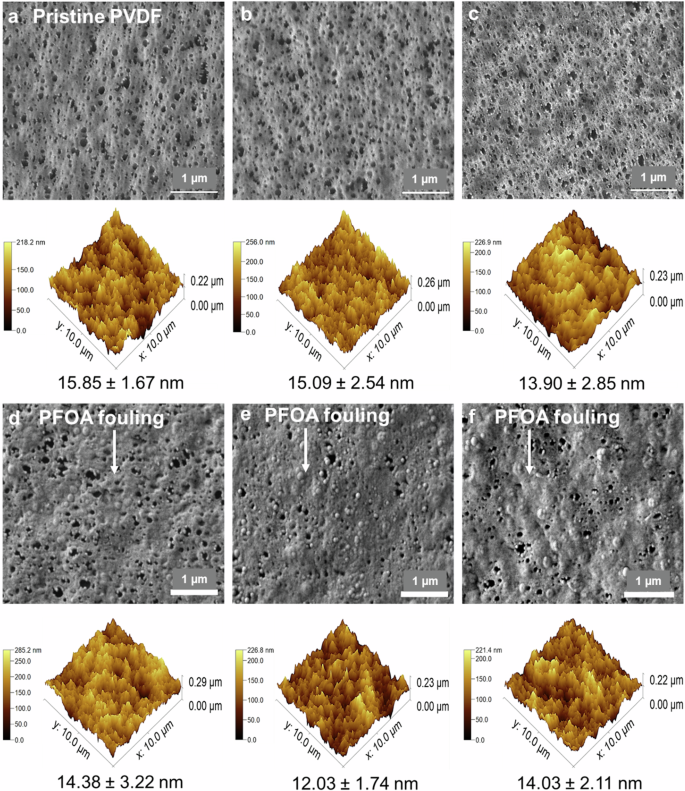
Morphological assessment of the a pristine PVDF membrane, b 8 h, c 16 h, d 24 h, e 48 h, and f 104 h tested membranes over DCMD operation at a feed temperature of 60 oC and permeate temperature of 20 oC, through SEM (top) and AFM (bottom).
These results can provide additional support for the achieved performance of the PVDF membrane, demonstrating consistent flux stability and effective PFOA rejection, as illustrated in Fig. 1b, c.
FTIR was employed to evaluate the chemical composition of the membranes before and after the DCMD test as well as determine the presence of PFOA functional groups across the membranes. As shown in Fig. 6a, b, an increased peak at ~1025 cm−1 was found on the PTFE membrane after 24 h of testing in DCMD, which was assigned to the C–O stretching vibration, attributed to the carboxylic group of the PFOA compounds fouled on the membrane32,43. The intensity of this band was more prominent for the PTFE membrane tested after 104 h in DCMD, further affirming the higher density of PFOA deposition on the PTFE membrane with DCMD duration time. In addition, significant bands at ~804 and 875 cm−1 could be attributed to the C–F stretching vibration of PFOA deposited on the PTFE membranes, and the intensity of these two bands also increased for the membranes tested for longer periods (Fig. 6c). In brief, FTIR analysis revealed that the PFOA fouling intensity across the PTFE membrane increased with the DCMD test period.

a FTIR spectra of PTFE membrane during DCMD operation time. A zoom-in range b between 970 and 1070 cm−1, and c between 750 and 950 cm−1 on FTIR spectra for the PFOA-fouled PTFE membranes. d FTIR spectra of PVDF membrane during DCMD operation time. A zoom-in range e between 970 and 1070 cm−1, and f between 750 and 950 cm−1 on FTIR spectra for the PFOA-fouled PVDF membranes.
The high-resolution XPS analysis of C-1s and O-1s spectra (Fig. 7a) of the tested PTFE membranes over 104 h of DCMD operation reveals the characteristic C–O and C–F peaks resulted from PFOA foulants. The intensity of the C–F2 signal at 291.75 eV, arising from the polymer backbone of PTFE, was reduced over the DCMD operation time (Fig. 7a)48, indicating the presence of PFOA foulants deposited on the PTFE membranes. It can be observed that the carbon atom peak at 287.7 eV and the oxygen atom peak at 536 eV, attributed to C=O and O–C=O groups of PFOA foulants, respectively increased with DCMD operation time (Fig. 7a, b)49, demonstrating an increase in PFOA fouling intensity on the PTFE membrane with test duration. The peak of the oxygen atom of C–OH bond at 533.2 eV, assigning to the carboxyl group of PFOA compounds, was also present across the tested PTFE membranes (Fig. 7b)50. The intensity of the C–C bond of the PTFE membrane at 284.5 eV decreased over the DCMD operation time and diminished after 104 h of operation (Fig. 7a)51, suggesting a loss of structural integrity of the PTFE membrane, which is consistent with the SEM image obtained, as evidenced in Fig. 3f.
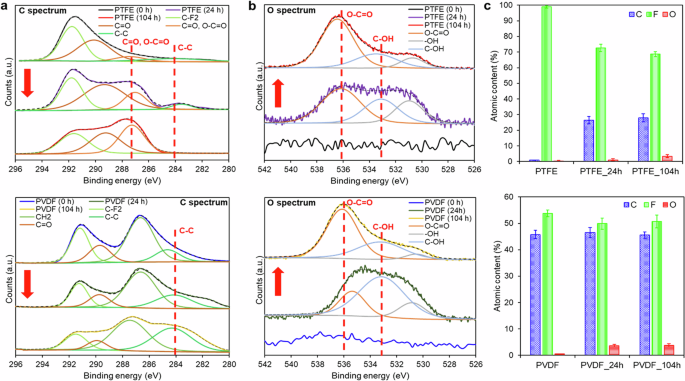
High-resolution a C spectra and b O spectra of the surface of PTFE membrane (top) and PVDF membrane (bottom), along with c the chemical composition of the membranes before and after DCMD operation as determined by XPS.
FTIR spectra of the PVDF-tested membranes were similar to that of the pristine membrane. The C–O and C–F bands of PFOA foulants at 1025, 875, and 804 cm−1, respectively, were not present across the PVDF membrane (Fig. 6d–f). Based on the high-resolution XPS analysis of C-1s and O-1s spectra of the PVDF membranes under test, there was a reduction in the intensity of the C–F2 signal at 291.75 eV, originating from the polymer backbone of PVDF, over the duration of DCMD operation (Fig. 7a)48. This reduction suggests the presence of PFOA foulants deposited on the membranes. Additionally, Fig. 7b illustrates an increase in the intensity of the oxygen atom peaks at 536 and 533. 2 eV, corresponding to the O–C=O and C–OH bonds of PFOA compounds, respectively, with the duration of DCMD operation49. This increase indicates a higher intensity of PFOA fouling on the PVDF membranes over time50. However, the peaks corresponding to the C–C and CH2 bonds of the PVDF membrane, observed at XPS peaks of 284.5 and 286.7 eV, respectively, remained consistent over the operation time (Fig. 7a)49,52. This observation suggests the stability of the PVDF membrane upon long PFOA exposure.
The materials assessment for PFOA removal through DCMD was compared and discussed through an insightful analysis in this section. For the morphological assessment, the SEM images revealed the PTFE membrane suffered fibril damage with a significant patchy PFOA fouling layer (Fig. 3f), whereas the PVDF membrane retained its defect-free polymeric structure with a continuous PFOA fouling layer deposited after the 104 h DCMD operation (Fig. 5f). The surface roughness of PTFE membrane experienced a significant reduction of up to 57% (Fig. 3f), while the PVDF membrane surface roughness remained consistent after 104 h of operation (Fig. 5). Similarly, the average pore size and the pore size distribution of the 104 h tested PTFE membranes experienced a larger reduction of up to 30% compared to those obtained with nearly negligible changes within the tested PVDF membranes (Fig. 4a, b). Likewise, the hydrophobicity of the PTFE membranes showed a greater decrease in the water contact angles, up to 11%, while there was no noticeable change in the hydrophobicity of the PVDF membranes (Fig. 4c, d). These results suggest that the accumulated surface PFOA fouling intensity on the PTFE membrane with a more porous structure was higher compared to the PVDF membrane. The porous structure of the PTFE membrane tends to have a high water evaporation rate in the feed-membrane boundary layer, resulting in concentration polarization on the boundary layer and consequently accelerating the PFOA foulant adsorption53,54,55. Furthermore, the PTFE membrane surface with a more hydrophobic nature may attract the hydrophobic tail of the fluorinated alkyl chains of PFOA, leading to the exposure of the hydrophilic head of the weak carboxylic acid group of PFOA on the surface and hydrophilizing the membrane56,57. In contrast to the PVDF membrane surface with less hydrophobic nature, favorably attracting the hydrophilic head of the weak carboxylic acid group of PFOA compounds, the exposure of the hydrophobic tail of fluorinated alkyl chains of PFOA on the surface maintained the PVDF membrane hydrophobicity58,59. Overall, compared to the PVDF membrane, the morphological change of the PTFE membrane was more significant, indicating that the stronger interaction between the PTFE membrane surface with PFOA compounds contributed to a higher PFOA fouling intensity on the membrane.
For the chemical composition assessment, FTIR analysis revealed that the PFOA fouling intensity across the PTFE membrane was found to be higher than the PVDF membrane over the test period. Higher fouling intensity of PTFE membranes can be evidenced by the increased peaks of C–O and C–F bands attributing to the PFOA foulants at 1025, 875, and 804 cm−1 over the time, while the tested PVDF membranes did not exhibit these peaks on FTIR spectra (Fig. 6). According to the XPS elemental composition shown in Fig. 7c, the percentage of O elements on the surface of both PTFE and PVDF membranes increased up to 3.4 and 3.7%, respectively due to the presence of PFOA foulants deposition60. Over the 104 h DCMD test, the O/C of the PTFE membrane was higher than that of the PVDF membrane (0.12 vs 0.08). In addition, the PTFE membrane showed a sharp decrease in F/C from the pristine membrane of 107.5 to 2.5 after 104 h operation, while the F/C of the tested PVDF membrane remained almost the same with the pristine membrane (1.11 vs 1.18). The sharp decrease in F/C of the PTFE membrane could be attributed to the high deposition of carbon atoms of C=O and O–C=O bonds of PFOA foulants. In addition, the intensity of the C–C bond of the PTFE membrane at 284.5 eV diminished after 104 h operation, while the bond intensity remained consistent on the PVDF membrane (Fig. 7a)51, suggesting that the structural integrity of the PTFE membrane was significantly less stable than that of the PVDF membrane when exposed to prolonged PFOA exposure. In summary, the FTIR and XPS analysis showed that the PFOA fouling intensity on the PVDF membrane was lower, and the structural integrity remained much more stable upon PFOA treatment.
Mechanisms of PFAS fouling and wetting across PTFE and PVDF membranes
Based on the DCMD performance and the autopsy of the tested membranes, a mechanism to elucidate the PFOA fouling on the PTFE and PVDF membranes was developed. As depicted in Fig. 8a, when the PTFE membrane was exposed to PFOA-contaminated feed water, the surfactant-like PFOA molecules tend to adsorb onto the surface of the PTFE membrane. The PFOA molecules would nucleate into globular structures around the PTFE fibrils (Fig. 3b) and hydrophobize the membrane surface, leading to an increase in the initial permeate flux, as evidenced in Figs. 1b and 2a. The membrane surface fouling was then initiated by the increased PFOA adsorption layer (Fig. 3c), causing the permeate flux decline (Figs. 1b and 2a). The evaporation of PFOA on the feed-membrane boundary layer is unlikely happened as PFOA are non-volatile molecules. The partial vapor pressure of PFOA is 403 Pa at 60 oC with a low mole fraction of 2.42 × 10⁻⁵, which is much lower than the partial water vapor pressure of 19,870 Pa in the feed solution61. However, arising from the rapid water evaporation across the PTFE membrane, the PFOA molecules tend to progressively adsorb and build up a concentration polarization layer on the membrane surface, thus accelerating the fouling on the membrane surface and within the pores. The reduction of average pore size and the large shift of pore size distribution to a smaller pore size range after 104 h of DCMD operation confirmed PFOA fouling on the PTFE membrane (Fig. 4c). The PFOA accumulation on the vicinity of the membrane surface would further increase the concentration gradient across the membrane beyond saturation point, and consequently facilitating the surface diffusion of PFOA attributed to the physical wicking across the inner surface of membrane pores62. This supports the fact that the severe permeate contamination and low PFOA rejection, as revealed in Figs. 1c, d and 2b, were induced by the rapid PFOA diffusion across the PTFE membrane.
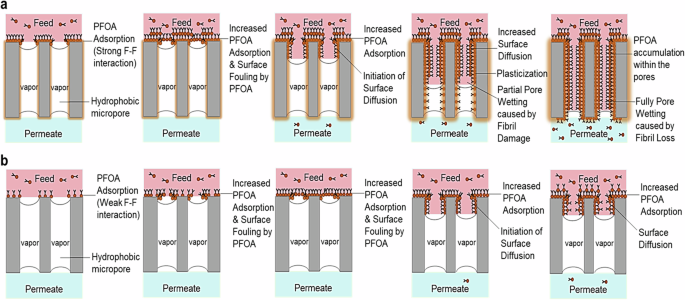
a PTFE membrane fouling was initiated by rapid PFOA adsorption and surface hydrophobization, attributed to the strong F–F interactions between the four fluorinated polymeric membranes and the fluorinated alkyl chain of PFOA molecules. This was followed by surface fouling and PFOA diffusion across the membrane, resulting from the increased PFOA adsorption layer. Subsequently, PFOA plasticization occurred within the pores of the membrane, leading to loss of structural integrity and pore wetting of the membrane material, as well as permeate contamination. b PVDF membrane fouling was initiated by slower PFOA adsorption, resulting from the fewer F–F interactions between the two fluorinated polymeric membranes and the fluorinated alkyl chain of PFOA molecules. This was followed by surface fouling and mild PFOA diffusion across the membrane over time.
PFAS is commonly used as a plasticizer in industry to enhance the thermal stability of polymeric materials. Arising from the strong F–F interactions between the four fluorinated polymeric membranes with the fluorinated long alkyl chain of PFOA molecules63,64, the PFOA molecules, acting as plasticizers, diffuse across the pores of the PTFE membrane and induce a localized partial dissolution of the PTFE polymeric matrix37,65, resulting in the degradation of the PTFE fibrils and the structural integrity of the PTFE membrane. This can be evidenced by the fibril damage and loss as revealed in Figs. 2c and 3d–f, and the diminished C–C bond of the PTFE structure as illustrated in XPS spectra (Fig. 7a). Further, the broken fibrils lead to the liquid feed entering the pores across the membrane as well as the ingress of inorganic ions and increased diffusion of PFOA across the pores. The sudden increase in permeate flux and permeate conductivity after 95 h of operation, as shown in Figs. 1b–d and 2a, b, confirms the occurrence of pore wetting due to the broken fibrils induced by PFOA plasticizing molecules. In addition, the hydrophilization of the surfactant-like amphiphilic PFOA foulants on the PTFE membrane surface, as revealed in Fig. 4a, b, resulting from the accumulation from the hydrophobic fluorinated tail of PFOA attaching onto the membrane while exposing the hydrophilic carboxyl head of PFOA on the surface, may facilitate the intrusion of liquid across the pores of the membrane.
The fouling of the PVDF membrane is governed by PFOA adsorption and PFOA surface diffusion, as illustrated in Fig. 8b. Compared to the PTFE membrane, PFOA adsorption onto the PVDF membrane was slower due to the fewer F–F interactions between the two fluorinated polymeric membrane with the fluorinated long alkyl chain of PFOA molecules. As revealed in the SEM images (Fig. 3d), the surface fouling by PFOA adsorption layer occurred after 24 h of testing, which was later than the PTFE fouling that occurred after 16 h (Fig. 3c). Upon reaching a certain saturation point of PFOA foulants accumulating on the PVDF membrane surface, the surface diffusion of PFOA was initiated on the inner surface pore of the membrane. However, the surface diffusion of PFOA across the PVDF membrane was less significant compared to the PTFE membrane. This is because of the lower porosity nature of the PVDF membrane, leading to a lower speed of water vapor diffusion across the membrane, as evidenced by the 50% lower water flux obtained by the PVDF membrane (Fig. 1a). The lower water evaporation would reduce the concentration polarization layer on the membrane surface, hence retarding the PFOA diffusion across the membrane. Furthermore, the lower water evaporation on the PVDF membrane led to a lower increase in PFOA concentration on the feed side of DCMD compared to the PTFE membrane (1.4-fold vs 2.2-fold) (Fig. 1d). Although the concentrating level of PFAS solution was deemed to be less effective, the lower water evaporation on the PVDF membrane would reduce PFOA diffusion across the membrane and obtain better permeate quality. In addition, the PVDF membrane retained its structural integrity after long duration testing, attributing to the fewer F–F interactions with PFOA molecules. Apart from that, the fouling intensity across the PVDF membranes is deemed to be less significant, as proved by the AFM, PSD, FTIR, and XPS analysis (Figs. 5, 4b, 6d–f, 7a), leading to a more stable permeation as well as higher PFOA and salt rejection performance, as depicted in Figs. 1b, c and 2a, b.
Discussion
This work marks the first exploration of DCMD as a potential method for removing PFAS from contaminated groundwater and pre-concentrating the PFAS solution for downstream management. Through in-depth analysis, insights into PFAS fouling on the DCMD membranes over time were gained, revealing an established fouling mechanism during operation. Among the membranes tested, it was observed that PVDF membranes exhibited stability in permeation performance over long-term operation, achieving higher rejections of PFOA and salt. This performance was attributed to the less pronounced diffusion of PFOA across the membrane pores, owing to weaker F–F interactions between the PVDF membrane and PFOA foulants. Analytical techniques, including AFM, FTIR, XPS, and pore size measurements, along with short-term wettability tests, confirmed lower fouling intensity and greater structural integrity of the PVDF membrane.
Several practical strategies are proposed for future studies to mitigate PFAS fouling and diffusion across the DCMD membranes. Surface modification of membranes to impart oleophobic properties could prevent adsorption, fouling, diffusion, and penetration of PFAS compounds. Incorporating anti-inorganic and anti-organic fouling properties into membrane modification could enhance the sustainability of PFAS removal through DCMD, potentially eliminating the need for feed pretreatment, and rendering PFAS remediation more versatile to a wider range of contaminated water sources, including surface water, municipal water, seawater, brine, and landfill leachates. Alternative fluorine-free polymeric membranes, such as poly(propylene) membranes, could also be explored to mitigate PFAS surface diffusion. Optimization of operating conditions, such as feed temperature and velocity, is essential for controlling the molecular kinetics of PFAS diffusion, considering its correlation with water vapor diffusion across the membrane. In addition, post-treatment on the permeate side of DCMD though integration with adsorption processes is deemed necessary to ensure the permeate quality meets environmental and safety regulations. Moreover, pretreatment methods such as adsorption or ion exchange are considered essential for removing organic matter and ions, ensuring the production of a purified pre-concentrated PFAS solution via DCMD, which is crucial for efficient downstream degradation or destruction processes. Furthermore, future studies should assess the fouling propensity of the DCMD membranes operating in diverse water matrix containing various PFAS chain lengths and other organic compounds to evaluate the feasibility of long-term DCMD for efficient PFAS remediation.


Responses