Performance of machine learning-based models to screen obstructive sleep apnea in pregnancy

Introduction
Obstructive sleep apnea (OSA) is a sleep-disordered breathing pattern with increasing prevalence among the pregnant population. It is caused by repetitive upper airway collapse during sleep, resulting in intermittent hypoxia, sleep fragmentation, and sympathetic activation1. These physiological disturbances often lead to blood pressure and heart rate elevations, insulin resistance, and endothelial dysfunction, which are related to the occurrence of preeclampsia, pregnancy-induced hypertension, and gestational diabetes2,3,4,5. Without timely intervention, OSA will be associated with increasing risks for preterm birth, fetal growth restriction, cesarean delivery, perinatal depression, and reduced life quality6,7,8,9. Moreover, OSA may also have long-term impacts on the health of both mothers and fetuses after delivery10,11,12,13.
Given these associations, OSA has been proposed as a potential intervention target to reduce adverse perinatal outcomes and improve the fetus’s development14,15,16,17,18. Early diagnosis of OSA during pregnancy is a crucial first step. It is estimated that OSA has negative impacts on 9% or more of the over 200 million pregnant women globally5. However, the gold standard of the OSA diagnosis, in-laboratory overnight polysomnography (PSG), has limited test capacity compared to a large number of affected pregnant women19. Additionally, the absence of screening tools specific to the pregnant population has resulted in low screening and diagnosis rates of OSA in this group20. Therefore, there is a critical need for effective OSA screening tools tailored for pregnant women.
Screening questionnaires that can be quickly and easily administered in clinical settings were developed for the general population21,22,23,24. However, these conventional OSA screening questionnaires perform poorly in pregnant women with low specificity25,26. Facco et al. 27 screened OSA among 122 pregnant women using the Epworth Sleepiness Scale (ESS) and Berlin Questionnaire validated by type 3 portable monitoring device (PM) Watch PAT 100. The results showed a sensitivity of 36 and 39%, and specificity of 77 and 68% for ESS and BQ, respectively. Antony et al. 28 conducted a 2-year prospective observational study involving 1617 pregnant women at 26–28 weeks of gestation. The results showed that ESS and Berlin Questionnaire identified 31.9% of positive patients while PSG and PM verification revealed only 15.5% as true positives. In addition, these screening tools are related to a high false referral rate for PSG28. To address this problem, an accurate and specific screening tool is urgently needed to identify OSA among pregnant women.
Machine learning models have rapidly developed for classification tasks. Studies have demonstrated that tools developed using machine learning algorithms provide superior predictive performance29,30,31. However, it has not been verified whether machine learning techniques were able to improve the performance of the models predicting OSA during pregnancy.
Therefore, the purposes of this study were (1) to assess the performances of traditional questionnaires combined with medical information and (2) to propose an improving screening tool for OSA in the pregnant population.
Results
Clinical characteristics
A total of 296 eligible pregnant women who completed the study protocol were recruited. Among these participants, 46 women repeated the procedure in two different trimesters, and 30 women repeated the protocol in all three trimesters. This results in a total of 402 records, with 75, 124, and 203 records in the early, middle, and late trimesters, respectively. Of these records, 202 (50.2%) were diagnosed with OSA. The prevalence of OSA in the three trimesters was 44, 47.6, and 54.2%, respectively. The dataset is divided into training and test sets with a 7:3 ratio. Consequently, 70% (n = 207) of the entire patients with a total of 279 records were allocated to the training set, while the remaining 30% (n = 89) with 123 records were designated as the test set. Detailed information is shown in Table 1.
Improved models and integrated model
The improved models demonstrated better screening performances compared to using only the corresponding questionnaires. As shown in Table 2, there were considerable AUC increasing for the four improved models in the test set. The sensitivity for the four improved models has also been promoted, especially for improved ESS (0.804 vs. 0.321) and improved SBQ (0.821 vs. 0.304). Although the integrated model achieves higher accuracy and specificity than the improved models did, its AUC and sensitivity are not optimal. And the validation set was presented in Supplemental Table 1.
As shown in Fig. 1, the AUCs of the improved models and the integrated model were above the recommended threshold of 0.7032.

A Improved model for Berlin questionnaire. B Improved model for Epworth sleepiness scale. C Improved model for STOP questionnaire. D Improved model for STOP-Bang questionnaire. E Integrated model taking all questions as input variables. F MoMOSA takes selected questions as input variables. Improved models were constructed by logistic regression for each questionnaire separately, incorporating both the questionnaire responses and medical information.
MoMOSA
MoMOSA based on selected questions from existing OSA questionnaires was developed, and the equation was as follows:
where, Y = −0.0039*Gestational age + 0.1542*BMI-0.0385 * Neck circumference −0.0817 * Age −0.0342 * BMI before pregnancy + 0.7569 * History of snoring + 0.6977*HDP + 0.8638 * HIP + 0.4317*Enlarge tongue + 1.4366 * Mandibular deficiency-0.0693 * Berlin_Q11 + 0.9291 * Stop_Q1–0.0693 * Berlin_Q1–1.1491.
The history of snoring, HDP, HIP, enlarged tongue, and mandibular deficiency were coded as absent (value = 0) or present (value = 1). SQ question No.1 denoted snoring loudly (louder than talking or loud enough to be heard through closed doors) by value 1 and otherwise value 0. BQ question No.1 indicated snoring as value 1 and not snoring as value 0. BQ question No. 11 indicated BMIå 30 kg/m2 as value 1 and BMI ≤30 kg/m2 as value 0. Age (years), gestational age (weeks), pre-pregnant current BMI (kg/m2), and neck circumference (cm) used actual numerical values. The threshold of probability was 0.506. The organized questionnaire and corresponding nomogram were shown in Fig. 2. Patients were split into non-OSA and OSA by the threshold.
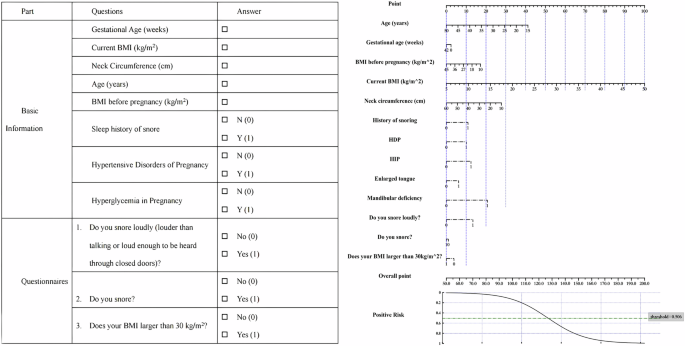
BMI body mass index, HDP hypertensive disorders of pregnancy, HIP hyperglycemia in pregnancy, BQ Berlin questionnaire, ESS Epworth sleepiness scale. STOP Question No.1: Do you snore loudly (louder than talking or loud enough to be heard through closed doors)? BQ Question No.1: Do you snore? BQ Question No.11: Does your BMI larger than 30 kg/m2?
Predictive accuracy of the MoMOSA
In the test set, MoMOSA achieves the highest accuracy, AUC, sensitivity, and F1 score compared to. the conventional questionnaires, the improved models, the integrated model, and the XG-Boost model. Although the random forest model demonstrates higher accuracy and AUC than MoMOSA, it lacks certain degree of interpretability and visualization capability. Considering the trade-off between interpretability and performance, we select MoMOSA as our final model rather than the random forest model.
MoMOSA also showed a satisfactory predictive performance for OSA diagnosis across the three trimesters among the questionnaires and the models. As shown in Table 3, MoMOSA performs well in both middle and late trimesters with AUC larger than 0.85.
Odds ratio
The OR for each variable is illustrated in Table 4. Mandibular deficiency has the highest OR of 4.206. OR for SQ No. 1 is 2.532. HIP and sleep history of snoring also have high OR of 2.372 and 2.132, respectively. HDP gains a relatively large OR of 2.009. ORs for the enlarged tongue is 1.540.
Nomogram
The nomogram for the MoMOSA model, illustrated in Fig. 2, offers a simplified method for calculating an individual’s risk of OSA. To determine OSA risk, initially align each feature value with the corresponding points on the “Point” axis. Sum these points to derive the total score. Subsequently, translate this total score into a risk estimate using the mapping curve located at the bottom of the nomogram. If the calculated risk exceeds the threshold of 0.506, the individual is classified as having a high risk of OSA.
Discussion
The current study evaluated the performances of traditional questionnaires (BQ, SBQ, SQ, and ESS) in identifying pregnant women at risk for OSA. Our findings demonstrated that these screening tools performed low sensitivity and specificity among pregnant women. An easy-to-use and specific tool for discriminating OSA status is required for the pregnant population. Consequently, our findings indicated that models combining medical information performed better in detecting OSA compared to each questionnaire alone. Most importantly, our study proposed a machine learning-based model (MoMOSA) consisting of medical information and three questions selected from traditional questionnaires. This model showed better diagnostic ability for OSA.
Similar to previous studies, our study revealed strong associations between loud snoring, enlarged tongue and presence of OSA among pregnant women based on the result of ORå 1. Previous evidence suggests that older age, higher BMI, and larger neck circumference are risk factors for OSA in pregnant populations30,33,34,35. The enlarged tongue was also found to be significantly associated with OSA33, which was a possible consequence of fluid retention during pregnancy36. Our finding is consistent with the known link between tongue enlargement and fat deposition, and a higher prevalence of obesity during pregnancy, which increases the risk of tongue enlargement.
Recent studies have found that alterations in the craniofacial skeleton are risk and predictive factors for OSA in non-pregnant population37,38. Although Chinese patients are less obese than Caucasians, the prevalence of OSA is similar in the two populations. A study using three-dimensional magnetic resonance imaging concluded that Chinese patients had more craniofacial bony restrictions and Caucasians were more obese when matched on AHI ≥5 events/h38. Compared to the previous study, which focused on pregnant women at high risk of OSA (Caucasians (40%), Hispanic (17%), and African Americans (28%)) with high BMI, the mean AHI in our study is higher and a greater percentage of women were diagnosed as OSA at the criteria of AHI ≥5 events/h27. According to our model, the presence of mandibular deficiency (OR: 4.206 (3.190, and 5.546)) is the most influencing factor of OSA in this model, which supports craniofacial value in predicting OSA in a pregnant population. These will increase the risk of OSA by narrowing the upper airway of the pregnant women.
In the United States, the rate of OSA among pregnancy-related discharges increased significantly from 1998–2009 and coincided with the rise of obesity rates39. OSA is associated with an increasing likelihood of maternal morbidities and mortality, and may lead to unfavorable outcomes to the developing fetus. Considering the high incidence and the negative maternal and fetal outcomes of OSA, clinicians are recommended to administer a screening tool as early as possible40. In that case, those with a high risk of OSA can be timely identified and referred to the sleep specialist. For those who are screened negative, follow-up screening should be administered. In addition, even mild OSA might have implications for adverse outcomes in pregnancy9,41. However, efficient identification of OSA remains problematic. New screening tools and strategies specific to pregnancy should be developed. The trait of dynamic change in symptoms of OSA and pregnancy should also be taken into account in the new screening tools.
Conventional questionnaires may not be effective in discriminating OSA in pregnancy due to several reasons. Firstly, pregnancy-related factors such as the somnogenic effect of progesterone and sleep disturbances41,42,43 can cause insufficient nocturnal sleep and excessive daytime sleepiness (EDS), which can mimic symptoms of OSA in the non-pregnant population. Therefore, the most frequently used screening tools in pregnant women that explore EDS and tiredness, such as ESS and BQ, are not specific during pregnancy25. Secondly, screening for OSA during pregnancy is complicated due to changes in symptomatology and disease severity. Thirdly, common OSA screening questionnaires were mostly validated in adults with moderate to severe OSA (AHI ≥15 events/hour)44, whereas the majority of pregnant women were diagnosed with mild OSA, even this specific population prone to obesity5,36,45
Physicians commonly use traditional screening questionnaires (STOP and STOP-Bang) to detect OSA in pregnant populations46. However, our previous research indicates that the overall predictive values of those tools are suboptimal. Specifically, the AUC for ESS, Berlin questionnaire STOP and STOP-Bang were 0.54, 0.59, 0.62, and 0.61, respectively47. In contrast, MoMOSA has achieved an AUC of 0.823, suggesting great predictive performance. Besides, questionnaire screening is the primary step, patients who screen positive will undergo further PSG to confirm the diagnosis of OSA. Therefore, false positive patients will be filtered out at the diagnostic gold standard stage. The prevalence and severity of sleep apnea decrease after delivery due to physiological and hormonal adjustments48,49. Given the significant improvement in postpartum, continuous positive airway pressure (CPAP) therapy or other interventions may only be necessary for a minority of women who continue to exhibit symptoms. It is essential to re-evaluate OSA patients postpartum to determine the need for ongoing treatment.
In this study, there were several individual items of the questionnaires showing significant associations with the presence of OSA. A feature selection method can play an important role in improving model performance. In this study, we utilized the backward feature selection technique to construct the final model. As a result, the MoMOSA improved the performance of accuracy, AUC, sensitivity, and specificity of the integrated model and largely reduced the computational complexity of the integrated model. Further, we also constructed a nomogram for facilitating the calculation of the model (Fig. 2). The Nomogram transferred complex computations into simple summation, which highly reduced the difficulty of utilizing the machine learning model. In this case, our screening tool can be easily and quickly administered during short clinical visits.
There were several limitations in our study. Firstly, results from the portable monitor were used as a reference instead of PSG, which is the gold standard for diagnosing OSA. However, high correlations between AHI obtained from PSG and the PM device used in this study were validated in our previous study in pregnant women50. Secondly, this study only recruited pregnant women with a high risk of OSA and was probably unable to represent all populations of pregnant women. Stratification for the risk of OSA in pregnancy will assist in prioritizing the need for limited medical resources. Specifically, pregnant women with a high risk of OSA should be prioritized for further diagnostic sleep testing and treatment, given the potential benefit on pregnancy outcomes. Thirdly, the number of records across the trimesters was not equivalent. This is because the prevalence of OSA increases across gestation49. Besides, the sample size is relatively small. This study focused on a specific patient population (Chinese), making it challenging to generalize the results to diverse patient populations and racial groups. Finally, the MoMOSA included 13 variables that several ones are not routinely collected in clinical care, potentially posing challenges for implementation and practical use in real-world clinical settings.
In conclusion, this study proposes a reasonably reliable and valid tool for predicting OSA in the Chinese pregnant population. Using physiological characteristics and clinical manifestations with relatively easier access, the machine learning model has considerably improved the accuracy of predicting OSA in pregnancy compared with traditional prediction tools.
Methods
Participants
Pregnant women who complained of snoring for OSA were recruited from the obstetric clinic of Peking University People’s Hospital between January 8, 2021 and December 31 2022. Individuals with complicated pregnancies (fetal anomalies), previous testing and/or treatment for OSA, and clinically unstable medical conditions were excluded from enrollment. This study has been approved by the Institutional Review Board at the Peking University People’s Hospital (2021PHB416–001). Written informed consents were obtained from all participants prior to enrollment. Research involving human research participants have been performed in accordance with the Declaration of Helsinki.
Study procedure
All participants received standard care during routine antenatal visits. Subjects were recruited from early (weeks 9–15), middle (weeks 16–27), and late (weeks 28–40) trimesters of pregnancy. At enrollment, they were asked to complete a series of questionnaires, including ESS, Berlin, STOP, and STOP-Bang questionnaires (SBQ).
Medical information, including maternal and gestational age, obstetric and sleep histories, medical comorbidities (hypertensive disorders of pregnancy (HDP)51, and hyperglycemia in pregnancy (HIP))52 were extracted from medical records. Pre-pregnancy and current weight, height, neck circumference, tongue size, and mandible position were measured by research assistants according to the protocol.
The subjects were scheduled to take an overnight home sleep apnea test (HSAT) using a type III portable monitor, Nox-T3 (Nox Medical, Inc., Reykjavik, Iceland), within 1 week from the enrollment and returned the device on the next day. The validation of this device in pregnancy has been conducted in a previous study, which demonstrated a low failure rate and high diagnostic performance50. Study data were collected using standardized forms for medical information and questionnaires and electronically retrieved for HSAT results. Data entry was performed by two trained research assistants. The datasets were cross-checked for quality. In addition, HSAT scorers were blind to all other clinical data.
Physical examination
Subjects underwent physical examinations by trained research assistants to measure neck circumference53, tongue size33,54, and mandible position55. Neck circumference was measured at the level of the superior border of the cricothyroid cartilage while the subject was in a seated position. The tongue size was examined during a maximal mouth opening. The tongue was directly visualized when the tongue remained in the mouth in a relaxed position. Tongue size was graded as enlarged if the tongue protrudes beyond the teeth or the alveolar ridge in the resting position, otherwise normal54.
The mandible position was assessed with the patient’s profile picture, taken in the physiologic natural head position (looking at a distant object). The mandibular deficiency was defined as a >5 mm retro-position of the soft tissue gnathion (the most inferior point of the mandible) from the vertical plane of the soft tissue nasion (the most posterior point on the curvature between frontal and nasal bones), or normal55.
HSAT
During the home-based sleep monitoring using Nox-T3, respiratory inductance plethysmography (RIP) was used to collect signals of nasal pressure, rib cage, and abdominal movement, while pulse oximetry was used to record oxygen saturation and heart rate. Snoring and body movement were also recorded. For HSAT, an experienced technician first instructed the participants how to use the device, including applying sensors and initiating monitoring. After repeating the above procedures by themselves, the participants could leave the hospital with the device. A valid HSAT recording must encompass a minimum of three hours of total analysis time and oxygen saturation records, and must feature with at least one of the respiratory signals: nasal pressure, rib cage movement, or abdominal movement. Details regarding operating procedures and the definition of success has been described in our previous article56. HSATs were scored using American Academy of Sleep Medicine criteria by experienced technologists from the sleep center44 Pregnant women with apnea-hypopnea index (AHI ≥5 events/hour) were diagnosed with OSA.
Screening questionnaires
The Berlin questionnaire (BQ) contains ten questions classified into three categories: snoring (category 1); daytime sleepiness (category 2); obesity (BMIå 30 kg/m2); and chronic hypertension (category 3). Subjects with at least two of the three categories positive were considered at high risk of OSA57.
The ESS is a standardized questionnaire that estimates the possibility of falling asleep in 8 situations. Each situation is ranked on a scale of 0–3 (0 = never, 3 = high). Individuals with ESS scores above 10 are considered at high risk of OSA24.
The STOP questionnaire (SQ) contains four questions including snoring, tiredness during the daytime, stopped breathing during sleep, and hypertension. Subjects with a total mark equal to or greater than 2 were considered at high risk of OSA23.
The SBQ consists of eight questions, and each question contributes one point to the total score when the answer is YES. In this study, the highest total possible score is 6 (as male sex and age greater than 50 years do not apply to any of the subjects). Subjects with a total score ≥3 were considered at high risk of OSA21.
Building machine learning models
We utilized logistic regression to develop a screening tool, Mixture of Models for OSA screening (MoMOSA). It leverages medical information and a curated selection of questions from the four questionnaires to screen OSA among pregnant women. To build MoMOSA, we first developed logistic regression models based on each questionnaire respectively, incorporating both the questionnaire responses and medical information (improved models). Then we developed an integrated model that utilized responses from all four questionnaires and medical information. For better screening performance and convenience, we selected three questions from the four questionnaires and developed the MoMOSA accordingly. In addition, we visualized the MoMOSA through nomogram for a convenient usage in clinical situations. As random forest and XG-Boost are shown to perform great for the tabular data classification task, we also trained them in each step as a baseline comparison (Fig. 3).
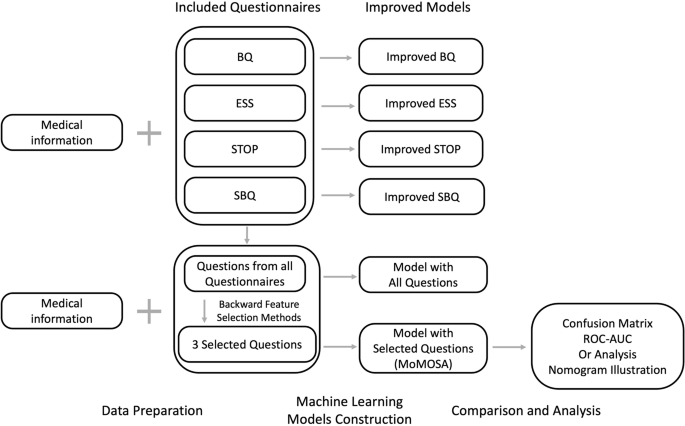
BQ Berlin questionnaire, ESS Epworth sleepiness scale, SQ STOP questionnaire, SBQ STOP-Bang questionnaire, AUC area under curve, OR odds ratio. Medical information mentioned above consists of maternal and gestational age, pre-pregnancy and current BMI, snoring before pregnancy, hypertensive disorders of pregnancy (HDP), hyperglycemia in pregnancy (HIP), and enlarged tongue.
To select the questions for MoMOSA, we applied the backward feature selection method. We began with medical information variables as compulsory features and all questions as potential features. At each iteration, we trained a multinomial logistic regression model with the current set of features and eliminated the least significant feature (i.e., the feature with the highest p value) until the remaining features had P values smaller than 0.01. This process helped to simplify the machine learning model and improve its generalizability. We used the stats models v0.13.0 statistical module with Python 3.9 based on the Anaconda3 development platform to perform the feature selection.
For the training of the machine learning models, we divided the enrolled subjects using a 7:3 ratio. For the primary outcome (presence or absence of OSA), the model building steps were performed in the training set with fivefold cross validation and tested in the test set. Accuracy, sensitivity, specificity and AUC were identified in the test set.
We applied a logistic regression model with L2 regularization for the prediction. To further specify the prediction results, determining the threshold for negative or positive outcomes became significant. We chose the threshold as the one with the largest g-mean. G-mean was calculated as (sqrt{{tpr}times left(1-{fpr}right)}), where tpr represents true positive rate and fpr represents false positive rate.
Statistical analysis
All statistical analyses were performed with Python version 3.9. Data were presented in means with standard deviations [mean ± standard deviation (SD)] for continuous variables and counts with percentages [n (%)] for categorical variables. Between-group comparisons were conducted utilizing a one-way analysis of variance (ANOVA) for continuous variables and a chi-square test for categorical variables. Comparisons with two-sided P value less than 0.01 was considered statistically significant. The predictive performances of the models were evaluated by accuracy, AUC, sensitivity, and specificity. Odds ratios (OR) and 95% confidence interval (CI) for the factors included in the final model were calculated by constructing logistic regression to assess the contribution of each factor to the outcomes. The logistic regression was visualized by nomogram58.

Responses