Peristaltic pump-triggered amyloid formation suggests shear stresses are in vivo risks for amyloid nucleation
Introduction
Amyloid fibrils, crystal-like fibrillar aggregates of denatured proteins1,2,3,4,5,6 associated with a series of amyloidosis including Alzheimer’s and Parkinson’s diseases7,8, are formed linked with the breakdown of supersaturation9,10,11,12. Amyloid fibrils have been reproduced in vitro even in the absence of seeds under a variety of conditions by distinct mechanisms9,10. Common to these mechanisms is the establishment of a supersaturated state of responsible proteins and subsequent breakdown10,13,14,15,16,17.
Fluid flow stresses have been increasingly focused on as mechanical triggers initiating amyloid nucleation in vivo18,19,20,21,22,23,24,25,26,27. Fluid flows in blood, cerebrospinal fluid, intramural periarterial drainage or interstitial systems are torrents at the microscopic scale, exerting various types of flow stresses including laminar-flow-dependent shear stress and extensional flow stress20,27,28,29. Both laminar flow and extensional flow cause mechanical stresses in liquid, which are believed to trigger protein aggregation. However, previous studies did not consider the role of supersaturation in fluid flow stresses. It is likely that the direct role of flow stresses is to break otherwise persistent supersaturation.
Here, during our challenge combining ultrasonication and microchannels, we found that peristaltic pump flow of hen egg white lysozyme (HEWL) resulted in amyloid formation. Peristaltic pump-dependent amyloid formation is common to varying disease-associated amyloidogenic proteins: α-synuclein (αSN), amyloid β 1–40 (Aβ40), and β2-microglobulin (β2m), suggesting that shear stress in vivo triggers amyloid nucleation. We performed a numerical simulation to evaluate the stress in the liquid during the operation of the peristaltic pump and found that significantly large shear stress can be created in the liquid by the peristaltic motion of rotors in contact with the tubes, suggesting that shear stress is the key mechanical factor of amyloid nucleation in vivo. We designed a peristaltic pump-dependent amyloid inducer with fluorescence detection and imaging, which will be useful for assessing amyloidogenic risks10,30 and analyzing the kinetics of shear stress-dependent amyloid formation.
Results
Peristaltic pump-dependent amyloid formation of HEWL
We previously reported the ultrasonication- or stirring-dependent amyloid formation of HEWL at pH 2 and 2.0 M guanidine hydrochloride (GuHCl), where HEWL assumes a native fold although the stability decreased: the denaturation-midpoint was 3.0 M GuHCl31,32,33. We found that flowing of HEWL solution with the peristaltic pump under the same conditions at air-conditioned room temperature (20–25 °C) resulted in a marked increase in amyloid-specific thioflavin T (ThT) fluorescence when the recovered solution was examined. The increase in ThT fluorescence suggested the formation of amyloid fibrils.
To monitor the ThT fluorescence increase in detail, we constructed a looped system (Supplementary Fig. 1), in which a peristaltic pump was used to flow the HEWL solution and a fluorometer with a flow cell was used to monitor ThT fluorescence. The ThT fluorescence increased when the applied HEWL came to the fluorometer for the first time (Fig. 1b). Then, the ThT peak appeared every 20 min, accompanied by increases in peak and baseline intensities. After several cycles, the ThT intensity saturated at a high level, suggesting a concomitant progression of amyloid formation and dilution within the loop. The ThT fluorescence monitored by the fluorometer showed a basal-level increase accompanied by sharp spikes. Excluding those evidently produced by air bubbles, spikes were likely to be caused by large ThT-positive aggregates.
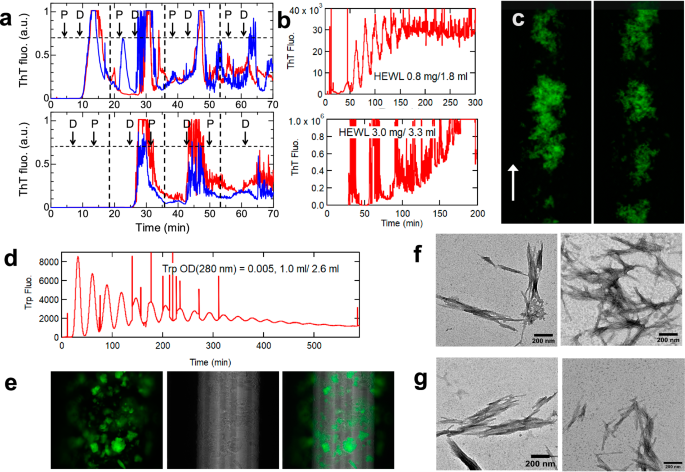
a The role of the peristaltic pump confirmed by exchanging the order of the peristaltic pump (P) and fluorescence detector (D). ThT fluorescence time-courses for alternative set-ups are shown. The HEWL amount applied was 0.375 mg, the total loop volume was 2.2 ml, and each loop cycle took 18 min. Red and blue curves show different experiments. b Representative ThT profiles at different HEWL amounts indicated. c ThT-fluorescence imaging of peristaltic pump-induced amyloid fibrils under flow. d The flow profile of tryptophan monitored at 350 nm. e Phase-contrast image of ThT-positive aggregates and its overlay on the ThT-fluorescence image. TEM images of peristaltic pump- (f) or ultrasonication-induced amyloid fibrils (g). All the scale bars for the TEM images in this paper are 200 nm.
In the present system, neither ultrasonication nor stirring was required. Among several possibilities by which HEWL formed ThT-positive aggregates (e.g., interactions with tube surfaces), the reaction trigger was attributed to the peristaltic pump. Because the peristaltic pump was located between the drawing inlet and fluorometer, the first passage of HEWL through the peristaltic pump was likely to trigger the reaction. To confirm the role of the peristaltic pump, we exchanged the positions of the peristaltic pump and fluorescence detector. With the exchanged setup, there was no ThT fluorescence increase during the first passage of HEWL to the detector, demonstrating the role of the peristaltic pump (Fig. 1a).
As a control, we flowed a tryptophan (i.e., N-acetyl L-tryptophan-amide) solution and monitored its fluorescence at 350 nm (Fig. 1d). The tryptophan fluorescence showed repeated peaks with decreasing maximal and increasing minimal intensities, showing flow-dependent monotonous dilution within the loop.
We then installed a fluorescence microscope to simultaneously monitor the morphology of ThT-positive products (Fig. 1c, Supplementary Fig. 1, Supplementary Movie 1). Various sizes of ThT-positive aggregates up to tens of micrometers with clustered fluff-like morphology flowed one after another, followed by a period of darkness, consistent with repeated peaks monitored by ThT fluorescence. We observed the flow-dependent tumbling and change in morphology: bending and extension of fibrous clumps. These images revealed a laminar flow with varying shear rates: faster at the center than at the near-wall position of the tube. The peristaltic flow stopped for 0.1 s every 4.6 s at a flow rate of 0.1 ml/min, leading to the flow-and-stop motion of aggregates.
We also measured phase-contrast bright mode images of these aggregates, showing that the regions with strong ThT-fluorescence overlapped with entire aggregates detected in the phase-contrast mode (Fig. 1e). This indicated that most of the aggregates formed under these conditions were ThT-fluorescence-positive.
To confirm that ThT-positive aggregates are amyloid fibrils, the solutions were recovered from the loop, and transmission electron microscopy (TEM) (Fig. 1f) and circular dichroism (CD) measurements (Supplementary Fig. 2a) were performed. TEM revealed a typical needle-like amyloid morphology with a diameter of approximately 10 nm and length up to several μm, similar to that of ultrasonication-induced amyloid fibrils (Fig. 1g). The CD spectra showed a β-sheet-dominated structure but with a small intensity. We later found that, because of notable adsorption to tube surfaces, the CD spectra of recovered solutions do not represent the secondary structures of reaction products.
Because the extensional flow apparatus with two syringes connected by a single capillary was reported to induce amyloid fibrils of β2m20, we flowed the HEWL solution with a syringe pump repeatedly (Supplementary Fig. 3), where the flow rate was set to be comparable with the standard flow rate (0.1 ml/min) used for peristaltic pump experiments. After passage through the fluorescence detector, the recovered eluent (2.2 ml) was used to fill the syringe with a 4-way cock and flowed again. Although the repeated rounds of syringe-pumping slightly increased the ThT fluorescence, it was at most 5% of the peristaltic pump-dependent ThT burst, indicating that the peristaltic pump is highly effective in inducing amyloid fibrils.
However, during the peristaltic pump experiments, we noticed that the recovered solutions did not show the yellow opal color typical of ultrasonication-induced amyloid fibrils. We compared the peristaltic pump-induced amyloid fibrils with those created by ultrasonication31,32,34. When the monomer HEWL solution in a cell of the fluorometer was irradiated with the attached ultrasonicator34, ThT fluorescence increased cooperatively, consistent with previous reports31,32 (Supplementary Fig. 4a). Under quiescent conditions, no increase in ThT fluorescence occurred within 24 h. Stirring of the solution by a stirrer increased the ThT fluorescence intensity slightly.
Even considering the dilution that occurred during peristaltic pump experiments, the specific ThT fluorescence intensities at a constant protein concentration were much lower (approximately 10%) than those of the ultrasonication-induced HEWL amyloid fibrils (Supplementary Table 1). It was likely that the adsorption of amyloid fibrils to loop inner surfaces including the flow cell reduced the recovery yield, making the quantification of amyloid fibrils difficult. In fact, when the preformed HEWL amyloid fibrils were flowed, we observed a marked decrease in ThT fluorescence during flow cycles (Supplementary Fig. 5), indicating the adsorption of preformed amyloid fibrils to the loop surfaces.
We then examined the dependence of the ThT fluorescence kinetics on the amount of HEWM monomers applied (Supplementary Fig. 6a, c, Supplementary Table 2), showing the complicated dependence, which is likely to be caused by a combined effect of the intense triggering of amyloid nucleation and adsorption of amyloid fibrils to loop surfaces.
We used different types of peristaltic pumps (ATTO and AS-One peristaltic pumps) to examine whether amyloid formation is common to peristaltic pumps. When examined with the same HEWL solution, other peristaltic pumps also showed amyloid formation (Supplementary Fig. 7, Supplementary Movie 2). On the other hand, the ThT-fluorescence kinetics differed depending on pumps. ISMATEC and ATTO peristaltic pumps have 12 and 6 rotors, respectively, and AS-One pump has one rotor whose position can be changed. The flow cycles visualized by the preformed HEWL amyloid fibrils were distinct: The ISMATEC pump showed cycles of 4.5 s flow and 0.1 s stop, ATTO pump showed the cycles of 26 s flow and 4 s stop, and AS-One pump showed the cycles of 27 s flow with gradual slow down and 3 s stop. In addition, the tube sizes in the pump were different, although we used the same tube out of the pump (inner diameter: 1.0 mm; length: ∼2.0 m). Inside peristaltic pumps, ATTO and As-One pumps have wider tubes (inner diameter: 2.0 mm) and the ISMATEC pump used the tube with the same inner diameter (1.0 mm) as the main loop. These differences were responsible for the variation in the ThT fluorescence pattern. Intriguingly, the AS-One pump exhibited a cycle of a gradual increase and sudden decrease in ThT fluorescence (Supplementary Fig. 7, Supplementary Movie 2). It was likely that the gradual slow down and 3 s stop allowed deposition of amyloid fibrils on the surface of the flow cell, which was peeled off after a certain period of accumulation time.
α-Synuclein
To examine the generality of peristaltic pump-dependent amyloid formation, we first used αSN, an intrinsically disordered protein of 140 amino acid residues associated with synucleinopathies6. αSN forms amyloid fibrils at high concentrations of salts at a neutral pH35. Ultrasonication-dependent amyloid formation of αSN occurred at pH 7.0 in the presence of 0.5 M Na2SO4 (Supplementary Fig. 4b). With the peristaltic pump system, we typically applied 1.0 mg of αSN (0.5 mg/ml αSN at a flow rate of 0.1 ml/min for 20 min). With the fluorometer, a marked increase in ThT fluorescence was observed upon the first passage of the applied solution (Fig. 2a). As was the case with HEWL, fluorescence microscopy revealed clustering fluff-like aggregates with shear flow-dependent dynamic motions, including tumbling and deformation (Fig. 2b, Supplementary Movie 1).
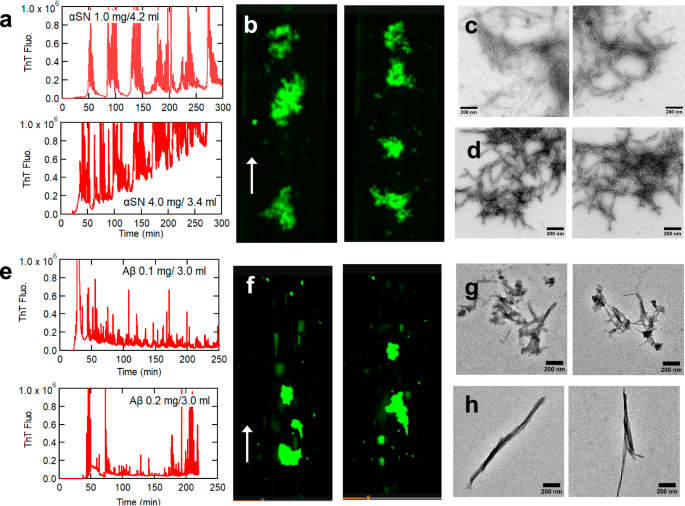
a–d αSN. (e–h) Aβ40. Typical profiles of amyloid formation observed at 485 nm (a, e), fluorescence microscopy images (b, f), and TEM images (c, g) are shown. TEM images of amyloid fibrils prepared by ultrasonication (d, h) are also shown.
TEM of recovered solutions showed clear amyloid fibril images (10 nm in width and several μm in length) (Fig. 2c), similar to that of ultrasonication-induced amyloid fibrils (Fig. 2d). In contrast, the CD spectra often did not exhibit a typical β spectrum (Supplementary Fig. 2b). A comparison of ThT fluorescence values for those produced by ultrasonication and the peristaltic pump indicated that the apparent amount of amyloid formed by the latter was less than that by the former (Supplementary Table 1) because of the adsorption of amyloid fibrils.
We studied the dependence of ThT fluorescence kinetics on the amount of αSN applied (Supplementary Fig. 6b, d). The results were similar to those of HEWL, indicating that the peristaltic pump triggered amyloid nucleation in the first round even when the total amount applied was low and subsequent kinetics were complicated by a combination of amyloid growth and adsorption.
Amyloid β40
The peristaltic pump also triggered amyloid formation of Aβ40, associated with Alzheimer’s disease, upon the first passage when monitored by ThT fluorescence (Fig. 2e). Subsequent cycles decreased the peak intensity because of adsorption to tube surfaces, which was more serious than the cases of HEWL or αSN. Fluorescence microscopy showed the flowing of large amyloid clumps under laminar flow (Fig. 2f, Supplementary Movies 1, 3). Self-association of preformed amyloid clumps and their adsorption to the flow-cell surface with subsequent peeling off was observed more often than with other proteins, indicating the sticky nature of Aβ40 fibrils. Amyloid clumps were often too large to tumble and were about to occlude the channels; this happened for some experiments and is likely to occur in vivo. Upon “unintentional” flicking of the tube after the apparent calming down of amyloid “river”, many amyloid clumps suddenly surged, showing the detaching of adsorbed amyloids (Supplementary Movie 3). Subsequent “intentional” flicking indeed caused the expected surge in amyloid fluffs. These debris flow, if happens in vivo, will be irreversible, producing serious damages including occlusion of in vivo channels. We name the video “Amyloid River of No Return” after the 1954 motion picture “River of No Return”.
Cerebral amyloid angiopathy is characterized by cerebrovascular Aβ deposition with a high Aβ40/42 ratio: mainly Aβ40 forms amyloid deposits on vascular wall leading to acute disruption in the intramural perivascular drainage (or intramural periarterial drainage) flow and cerebral blood flow36,37,38. The fluorescence microscopy videos imply early stages of cerebral amyloid angiopathy. It is noted that, in our experiments, Aβ40 deposited on the inner surface of tube, while, in cerebral amyloid angiopathy, Aβ40 deposits on the external surface of vascular walls.
TEM showed rigid amyloid morphology with a diameter of 10 nm and length of 1–2 μm (Fig. 2g), similar to that of ultrasonication-induced amyloid fibrils (Fig. 2h). CD spectra showed conversion from disordered monomers to a β-sheet structure typical of amyloid fibrils (Supplementary Fig. 2c), although the precise evaluation was difficult because of amyloid adsorption to loop surfaces.
We also examined the ultrasonication induced amyloid formation of Aβ40 monitored by a fluorescence spectrophotometer (Supplementary Fig. 4c). The ultrasonication-induced amyloid fibrils effectively and the specific ThT fluorescence value was higher than that induced by the peristaltic pump (Supplementary Table 1). All these results showed the peristaltic pump-triggered efficient formation of Aβ40 amyloid fibrils and their marked propensity for self-association and adsorption.
β2m
Finally, we used β2m, responsible for dialysis-related amyloidosis39,40. β2m has been reported to form amyloid fibrils at pH 2 with a moderate concentration of salt (e.g., 0.2 M NaCl) under stirring or ultrasonication33,41,42. Although amyloid formation at a neutral pH, where patients develop amyloid deposits, was previously difficult, several conditions have been explored to induce amyloid fibrils40,42,43 including the presence of low concentrations of SDS44. However, amyloid formation at a physiological pH and temperature without additives remains challenging.
At pH 1.8 in 0.4 M NaCl, the peristaltic pump triggered amyloid formation of β2m (Fig. 3a, d, h, Supplementary Movie 1) as observed for HEWL, αSN, and Aβ40. At pH 7.0 in the presence of 0.5 mM SDS, the peristaltic pump revealed intriguing two-step amyloid formation monitored by ThT fluorescence (Fig. 3b). The first passage of β2m through the peristaltic pump markedly increased the ThT fluorescence. Subsequent cycles resulted in oscillating peaks with a decreasing intensity because of dilution. The fluorescence microscopy movie at a high playback speed (x256) looks like a firefly flashing (Fig. 3e, Supplementary Movie 4). We observed no obvious aggregate or fluff at the fluorescence microscopy resolution. Several hours later, ThT fluorescence started to increase again but gradually, producing fluff-like aggregates. The fluff-like aggregates were confirmed to be amyloid fibrils by TEM (Fig. 3i). The ThT fluorescence value after the end of flashing (0.15 × 10⁸) was approximately 25% of that of amyloid fibrils (0.6 × 10⁸), suggesting that the intermediates are partly amyloid-like (Fig. 3b, Supplementary Movie 4). TEM images of the peristaltic pump-induced amyloid fibrils at pH 1.8 in 0.4 M NaCl (Fig. 3h) or at pH 7.0 in 0.5 mM SDS (Fig. 3i) were similar, within our resolution, to those of ultrasonication-induced amyloid fibrils (Fig. 3k, l).
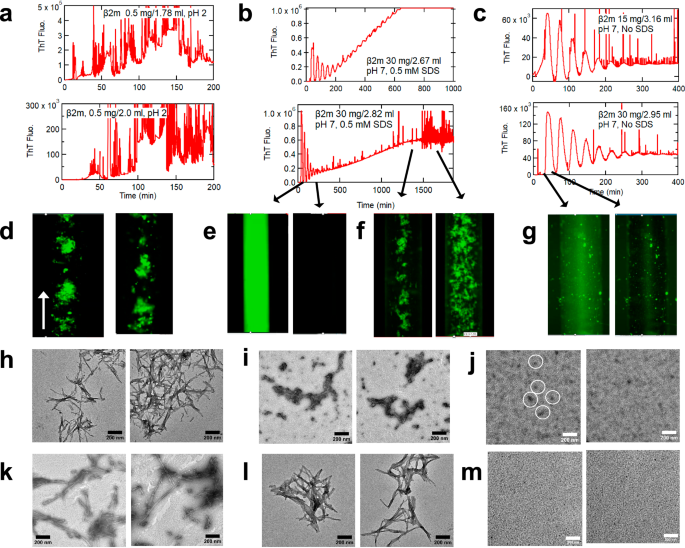
Conditions are at 20 mM HCl and 0.4 M NaCl (a, d, h, k), at pH 7.0 in the presence (b, e, f, i, l) or absence (c, g, j, m) of 0.5 mM SDS. Typical profiles of amyloid formation observed at 485 nm (a–c), fluorescence microscopy images (d–g), and TEM images (h–j) are shown. In the left panel of (j), oligomers are indicated by circles. TEM images of amyloid fibrils prepared by ultrasonication are also shown (k–m).
When the peristaltic pump effects were examined in the absence of SDS at pH 7.0, only the first step (firefly flashing) occurred (Fig. 3c, g, Supplementary Movie 5), suggesting that, even in the absence of SDS, the intermediate state with notable ThT fluorescence accumulated. In the absence of SDS, nothing happened even under ultrasonication (Supplementary Fig. 8d). TEM images of the recovered β2m solution showed no fibrillar images. Instead, small aggregates, resembling so-far reported oligomers45,46,47,48,49, were observed (Fig. 3j). Importantly, we previously analyzed the SDS-dependent first-step product by analytical centrifugation, reporting that about half of the molecules were converted to oligomers with an average size of five monomers50. The SDS-induced monomer/oligomer mixture showed a CD spectrum of partly disordered conformation, consistent with the present results (Supplementary Fig. 2e). The SDS-induced β2m oligomers were useful to promote seed-dependent amyloid growth under neutral pH conditions44.
We separated the effects of SDS and ultrasonication with the fluorescence spectrophotometer (Supplementary Fig. 8). In the presence of 0.5 mM SDS at pH 7.0, the SDS-dependent first step occurred under stirring with a time constant of approximately 30 min at 0.5 mg/ml β2m and depended on the β2m concentration: faster and slower at higher and lower β2m concentrations, respectively (Supplementary Fig. 8b). The second step leading to amyloid fibrils required ultrasonication. In contrast to SDS-dependent oligomer formation, peristaltic pump-dependent oligomer formation was independent of the β2m concentration (Supplementary Fig. 8c), indicating the strong power of the peristaltic pump.
Here, the ThT-positive oligomers detected by the peristaltic pump may be an off-pathway trapped intermediate of amyloid formation (Supplementary Fig. 8a). Although the differentiation of on- and off-pathway intermediates is usually not straightforward51, the ultrasonication-dependent full conversion of oligomers to amyloid fibrils supported that they are off-pathway trapped intermediates. The accumulation of off-pathway intermediates can be explained by Ostwald’s ripening rule of crystallization, according to which the morphologies of crystals change over time, guided by their kinetic accessibilities and thermodynamic stabilities52. Following this rule, the ThT-positive oligomers are rapidly formed as trapped intermediates, which can be converted to more stable and structured amyloid fibrils. Taken together, even in the absence of SDS at pH 7.0, prolonged exposure of β2m to shear stresses increases the risk of amyloid formation.
Discussion
Finite-element-method (FEM) simulation
To evaluate the mechanical stimuli induced in the flowing solution by the peristaltic pump, we performed two-dimensional FEM simulation (Methods, Fig. 4). Supplementary Movie 6 shows the change in the shear-stress distribution in the liquid layer during the rotor movement when 1, 2, and 4 rotors were used. Significantly large shear stresses higher than 100 Pa were locally produced, which must be the cause of the peristaltic pump-dependent amyloid nucleation. The laminar flow-dependent maximum shear stress in flowing liquid can be evaluated by 4μUave/R for a flow channel with circular cross-section, where μ, Uave, and R denote the solution viscosity, average flow velocity, and inner radius of the flow channel, respectively. The average flow velocity in our experiments was typically 0.002 m/s, yielding a maximum shear stress of 0.02 Pa or less for the 1 mm inner diameter tube at viscosity μ = 1 × 10⁻³ Pa ・s. Therefore, the rotor movement can cause a much larger shear stress than the laminar flow.
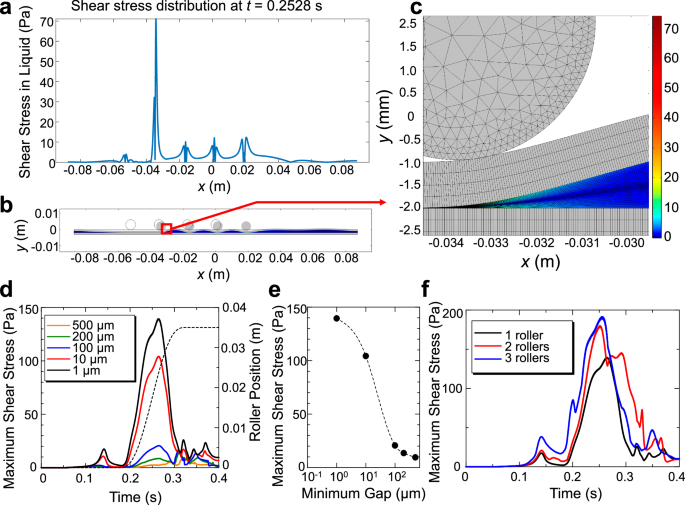
a A snapshot of shear-stress distribution during the movements of four rotors, (b) corresponding rotor positions, and (c) an enlarged view near the rotor located most downstream. These are results for the case with a remaining gap of 50 μm. d Change in the maximum shear stress with single-rotor movement in an axial direction for various minimum gaps at the first roller-pushing action. The broken line denotes the rotor position, indicating that the shear stress is maximal near the maximum rotor speed. e Dependence of the maximum shear stress on the minimum gap for the single-rotor case. f Dependence of the maximum shear stress on the number of rotors. The behavior of the tube filled with solution was simulated by a two-dimensional model where the two rubber sheets accommodate water in the gap between them. The thickness and length of the rubber sheets were 1 and 175 mm, respectively, and the initial gap was 1 mm. The 3 mm-diameter steel rotor was first pressed vertically against the rubber sheet, moved horizontally along the flow direction, and stopped, while the shear rate and shear stress were calculated by FEM analysis. The maximum and minimum mesh sizes were 2.5 and 0.2 μm, respectively, and the time step was 0.1 ms. The rubber sheets were fixed at both ends, and the open boundary condition was adopted for liquid. To allow for large deformations, moving mesh was used.
Figure 4d, e indicates that the shear stress in solution can be increased by decreasing the thickness of the remaining solution layer in the first rotor push action. Because the FEM calculation failed when the remaining solution layer was too thin, we made the calculation with a remaining layer thickness greater than 1 μm. In the actual peristaltic-pump operation, the solution layer can be nearly zero, and shear stress is estimated to be larger. In addition, the shear stress can be further increased by increasing the number of rotors (Fig. 4F), reaching nearly 200 Pa, a 10,000-fold increase compared with simple laminar flow.
To induce a large shear stress with laminar flow, we need to use a flow channel with very small cross-section. For example, a shear stress of ~100 Pa can be locally achieved using a microchannel with a cross-section of 80 μm × 62 μm53. However, aggregates containing rigid amyloid fibrils will quickly occlude such a narrow channel, making the flow assay impractical. Therefore, the moving motion of the rotor in contact with the tube in the peristaltic pump is a rare phenomenon that can generate very large shear stresses, even in channels with large inner diameters.
Here, in the fluid flow, Reynolds number (Re) is a useful parameter defined by Re = UaveD/ν, where ν denotes the dynamic viscosity (1 x 10⁻⁶ m2/s). The Re value gives a measure of the transition from laminar flow (Re < 1000) to turbulent flow (Re > 4000)23,54. In our experimental conditions, the flow rate, diameter of the tube, and the viscosity of the solvent are 0.1 ml/min (=0.002 m/s), 1.0 mm (=0.001 m), and 1 × 10⁻⁶ m2/s, respectively. Then, the Re value was approximately 2, indicating that laminar flow holds. All fluorescence microscopy images of amyloid flow were consistent with laminar flow. Although we did not observe inside peristaltic pumps, we consider that laminar flow persists even where the tubes contact peristaltic rotors. In the context of amyloid formation, the local site of amyloid nucleation, whether in a bulk solution, or water-air interface, is an important issue55,56,57, although our system did not include air-water interface. Direct observation inside peristaltic pumps focusing on interacting tubes and rotors will be useful for clarifying the details of amyloid nucleation.
Kinetic analysis
We propose a theoretical model for understanding the amyloid-formation behavior in the flow assay composed of the peristaltic pump and fluorescence detector (Methods), in which the concentrations of the applied monomer (CM) and product (fibrils) (CF) vary not only with the progression of the chemical reaction (amyloid formation), but also with their self-diffusion and with the axial flow. Concerning the chemical reaction, we consider the two-step fibril-formation model, which is characterized by the reaction-velocity constant for the primary nucleation, kn, and that for the fibril elongation, kg58,59.
Figure 5 compares simulation calculations with some experiments. Although there are some ambiguous parameters, such as diffusion coefficients of monomers and fibrils, the analytical model reproduces the experimental results and is able to explain fibril formation under axial flow. However, it failed to simulate some experiments when the initial monomer amount was small, as shown in Fig. 5e. In the experimental results, certain amounts of fibrils were produced from the beginning because of the strong amyloid-inducing capacity, but in the simulation, the amount of fibrils increased gradually. In the experiments, adsorption of preformed fibrils reduced the flowing fibrils. Moreover, this discrepancy may be attributed to its spatiotemporal localization. Even if fibrils are generated, their localization prevents further immediate propagation, as occurs in the test tube.
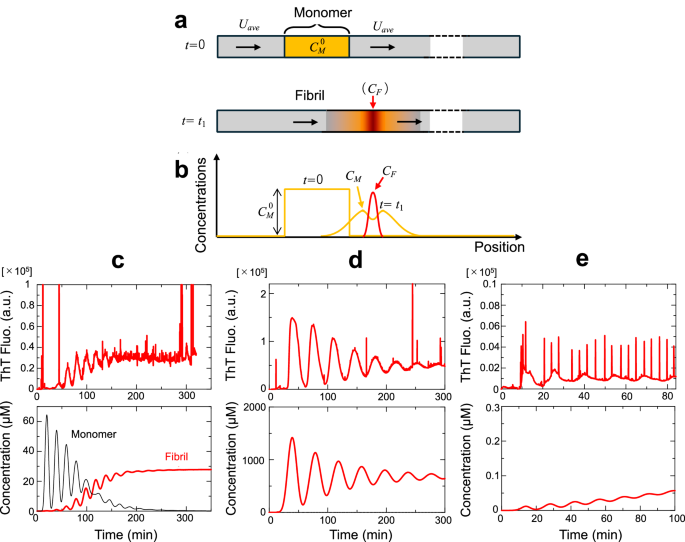
a One-dimensional model for calculating monomer and fibril concentrations under axial flow. b Schematic of time variation of the concentration distributions. c–e Comparison between experiments (upper) and numerical simulations (lower) for (c) 1.0 mg/ml HEWL, (d) 20 mg/ml β2m, and (e) 0.5 mg/ml HEWL. The protein concentrations are those of applied solution and the total amounts applied were (c) 0.8 mg, (d) 30 mg, and (e) 0.25 mg. The parameters used are as follows. Length of tube: 2.5 m; diffusion coefficients of monomer (DM) and fibril (DF): 7 × 10⁻¹⁰ and 2 × 10⁻¹⁰ m2/s, respectively; reaction-velocity constants for nucleation (kn) and fibril growth (kg): 1 × 10⁻⁶ s−1 and 3 × 10⁻⁵ s−1μM−1, respectively; flow velocity: (c) 100, (d) 50, and (e) 140 μl/min.
Perspectives
We showed that peristaltic pumps are unexpectedly powerful for triggering amyloid formation of proteins in general. Although we consider shear forces to be an important factor, it remains unclear how shear forces break supersaturation. Moreover, we do not know in detail where amyloid nucleation occurs inside peristaltic pumps (in bulk or on surface). Direct observation inside peristaltic pumps focusing on interacting tubes and rotors will be useful for clarifying the details of amyloid nucleation.
In the current loop system, the adsorption of preformed amyloid fibrils to loop inner surfaces including the flow cell complicates the observed kinetics. However, this complexity mimics amyloid deposition in vivo, where various tissues and organs are connected by fluid flows including blood, cerebrospinal fluid, interstitial fluid and intramural perivascular drainage systems. Markedly sticky Aβ images may mimic early stages of cerebral amyloid angiopathy (Supplementary Movie 3)36,37. The most serious concern from our ‘Amyloid River of No Return’ is the occulusion of in vivo channels, which will be hard to be returned. The firefly flashing β2 m oligomers might occur in patients under dialysis therapy where peristaltic pump-based hemodialysis machines are used.
Finally, the marked effectiveness in spite of a concise setup will make the peristaltic pump system useful for early-stage diagnosis by monitoring susceptibility risk biomarkers even without seeds30. From the viewpoint of supersaturation-limited amyloid formation, therapeutic strategies for reducing the degree of supersaturation, a measure of the risk of ‘amyloid ignition’, will be more effective than extinguishing the ‘amyloid fire’. Such an approach has been undertaken by the ultrasonication-dependent amyloid inducer, a HANABI system, seeking a high throughput analysis of the risk of amyloid ignition with a microplate reader10,40. The current peristaltic pump system might bring an alternative approach, enabling the imaging and kinetic analysis of the shear stress-forced amyloid ignition in real time and at a microliter scale. These will contribute to realizing the return of amyloid river like the ending of “River of No Return”.
Methods
Proteins and chemicals
Recombinant human αSN was expressed in Escherichia coli and purified as described previously60. Recombinant human β2m with an additional methionine residue at the N terminus was expressed using Escherichia coli and purified as described previously61. HEWL and Aβ40 were purchased from Nacalai Tesque (Kyoto, Japan) and Peptide Institute Inc. (Osaka, Japan), respectively. The fluorescence dye ThT was obtained from Wako Pure Chemical Industries (Osaka, Japan). N-Acetyl L-tryptophan amide and other reagents were purchased from Nacalai Tesque.
Peristaltic pump-dependent amyloid formation
HEWL, αSyn, and β2m were dissolved in deionized water. Aβ40 was dissolved in 0.2% (w/w) ammonia solution. Then, the following buffers were used to enable the solution to flow by the peristaltic pump: HEWL in 20 mM HCl (pH 1.8) and 2.0 M GuHCl; αSN in 50 mM sodium phosphate buffer (pH 7.0) and 0.5 M Na2SO4; Aβ40 in 20 mM sodium phosphate buffer (pH 7.0) and 0.05 M NaCl; β2m under acidic conditions in 20 mM HCl (pH 1.8) and 0.4 M NaCl; β2m under neutral pH conditions in 50 mM sodium phosphate buffer (pH 7.0) and 0.1 M NaCl in the presence or absence of 0.5 mM SDS. All protein solutions contained 5 μM ThT. Experiments were performed at an air-conditioned room temperature (i.e., 20–25 °C).
The assays with peristaltic pumps were carried out with the looped system (Supplementary Fig. 1). We used an ISMATEC peristaltic pump (REGLO Analog MS-2/12) and a JASCO FP920 fluorometer with a 16 μl flow cell volume. These apparatuses were connected by a silicone tube with an inner diameter of 1.0 mm. Typically, 0.8 ml of a 1.0 mg/ml HEWL solution (0.8 mg HEWL) was drawn at a flow rate of 0.1 ml/min and then the inlet and outlet were connected to form a loop. The total length of the loop was ~1.5 m with a total volume of 2–3 ml. To measure the precise volume, we recovered the solution after the experiments and weighed it. The recovered solutions were also used for CD, TEM, and ThT fluorescence measurements.
We also used different types of peristaltic pumps (i.e., Model AC-2120 (ATTO Co., Tokyo, Japan) and Model TP-10SA (AS-One Co., Osaka Japan) peristaltic pumps) to examine the generality of peristaltic pump-dependent amyloid formation (Supplementary Fig. 7, Supplementary Movie 2).
An intelligent fluorescence detector (Model FP-920, Jasco Co., Ltd., Tokyo, Japan) with a PC integrator ChromNAV Lite was used to monitor the ThT or Trp fluorescence in the looped system. The flow cell volume was 16 μl. The excitation and emission wavelength were 445 and 485 nm, respectively, for ThT fluorescence and were 280 and 350 nm, respectively, for Trp fluorescence.
A fluorescence microscope (Model BZ X810, Keyence Co., Ltd., Osaka, Japan) was installed to simultaneously monitor the morphology of ThT-positive products (Supplementary Fig. 1, Supplementary Movie 1). Flow in a glass tube with a diameter of 1.2 mm was visualized at a low magnification (x2). We used the BX filter GFP (excitation at 470 nm and emission at 495 nm) to monitor ThT fluorescence. We also measured the phase contrast images of aggregates to check the overlap with ThT fluorescence images.
We examined the dependence of amyloid formation on the amount of HEWL or αSN applied (Supplementary Fig. 6). For the current system employing the sample drawing, changing the applied volume of the same stock solution was more convenient than preparing solutions at different protein concentrations.
Ultrasonication-dependent amyloid formation
Ultrasonication-dependent amyloid formation was measured with the Hitachi fluorescence spectrophotometer F7000 (Tokyo, Japan), in which the sample solution in a glass cuvette was irradiated with ultrasonic pulses from an ultrasonic generator tightly attached to the sidewall of the cuvette (Elekon Science Co., Chiba, Japan), as reported previously34,43.
CD and TEM measurements
Far-UV CD spectra (approximately 200–250 nm) were obtained by the model J-820 spectropolarimeter (Jasco Co., Ltd., Tokyo, Japan) at 20 °C using a quartz cell with a 1 mm path length. CD data are expressed as the mean residue ellipticity. To calculate the mean residue ellipticity, the initial protein concentration of the sample solution was used. This obviously made it difficult to convert to molar ellipticity precisely because a significant portion of the protein might be adsorbed on the inner surfaces of flow loops.
TEM images were obtained with a transmission electron microscope (JEOL JEM-1400). A 3 μL aliquot of the sample solution was placed on a collodion-coated copper grid (Nisshin EM Co.) for 30 s, and the remaining solution was removed with filter paper. The sample was then stained with a 1% (w/v) uranyl acetate solution for 30 s. Finally, the surface of the grid was rinsed with deionized water. TEM observation was performed with an acceleration voltage of 80 kV.
Finite-element-method (FEM) simulation
FEM simulation was performed with COMSOL Multiphysics ver. 6.2 by combining the solid mechanics and fluid mechanics calculations. The model consists of two rubber sheets with a thickness of 1 mm and length of 175 mm, with a 1-mm thick water layer between them (corresponding to the rubber tube with outer and inner diameters of 3 and 1 mm, respectively), and 3-mm steel rotors located above the rubber sheets (Fig. 4). The rotors were first pressed vertically against the rubber sheet to decrease the solution-layer thickness, horizontally moved along the flow direction, and then stopped. During the rotor movement, the shear rate and then shear stress in the solution were calculated.
Theoretical analysis of amyloid formation in the looped flow system
We considered the two-step fibril-formation model, which is characterized by the reaction-velocity constant for primary nucleation, ({k}_{n}), and that for the fibril elongation, ({k}_{g})58,59. The governing equations are then given by:
Here, ({widetilde{D}}_{M}) and ({widetilde{D}}_{F}) are the effective diffusion coefficients of the monomer and fibril, respectively, and ({U}_{{ave}}) denotes the average flow velocity. The x shows the position measured along the axial direction of the tube. The third and fourth terms on the right-hand sides represent the effects of self-diffusion and axial flow (forced convection), respectively62. Aris modified the effective diffusion coefficient (widetilde{D}) proposed by Taylor63 and derived the following equation in a cylindrical channel with an inner diameter of (a)64:
where (D) denotes the original diffusion coefficient, and this relationship was used for ({widetilde{D}}_{M}) and ({widetilde{D}}_{F}).
We solved the simultaneous equation [1] and [2] numerically using the finite difference method with the model shown in Fig. 5. In the actual flow assay, the solution flows repeatedly in the looped 2.5 m tube, and the amount of the fibril is measured each time it passes through the fluorescence detector. In the numerical model, a sufficiently long (~50 m) tube was assumed, through which monomer molecules and fibrils flowed with a carrier flow of buffer solution, causing the fibril-formation reaction, and the actual circulation behavior can be simulated by superimposing the fibril distribution every 2.5 m. As an initial condition, the monomer solution to be applied was set so that its center was 5 m from the left end of the tube, and for the boundary conditions, we assumed no flux at the ends of the tube.
Responses