Personalized prediction of anticancer potential of non-oncology drugs through learning from genome derived molecular pathways

Introduction
Cancer genomic studies, such as The Cancer Genome Atlas (TCGA)1 and International Cancer Genome Consortium (ICGC)2, have systematically documented the mutational landscape of patients with cancer, paving the way for precision oncology. Concurrently, drug response studies based on cell lines3,4 and patient-derived tissues5 have provided crucial insights into individualized tumor treatment, sparking numerous clinical research efforts in targeted therapy across indications6,7,8. Consequently, several multi-omics-based computational methods have been developed to effectively forecast the potential efficacy of anticancer drugs9,10. However, the vast majority of patients with cancer do not benefit from the limited targeted therapies available11, highlighting the need for more precise treatment strategies.
Over 500 significantly mutated genes have been identified across existing cancer types12, with only TP53 mutated in >50% patients, implying that mutated cancer drivers usually differ among patients with cancer. This genetic heterogeneity necessitates agile drug development paths. Owing to the high cost of novel drug development13, the number of targeted drugs is far fewer than that of known cancer genes, not to mention that many drugs target the same gene. According to OncoKB14, only 87 targeted drugs have been approved by U.S. Food and Drug Administration (FDA) to modulate 53 cancer genes, which is very similar to a recent survey15. Thus, it is unlikely that the small pool of targeted drugs can treat most patients. To bridge the gap between the need for new effective cancer drugs and the slow pace of drug development, repurposing non-oncology drugs seems to be an attractive and lower-risk approach16,17,18,19.
Recent in vitro high-throughput experimental screenings have advanced non-oncology drug repurposing. For example, Corsello et al. applied the profiling relative inhibition simultaneously in mixtures (PRISM) approach to screen 4518 drugs on 578 human cell lines, identifying multiple non-oncology drugs that were able to efficiently kill cancer cells20. Similarly, Hirt et al. screened 1172 drugs on pancreatic cancer organoids to identify 26 potential drugs, including several for non-cancer indications21. Sun et al. performed high-throughput drug screens using 2068 drugs targeting cancer-related pathways on 139 pediatric cancer cell lines, identifying 59 drugs approved for non-oncology indications with cancer growth effects22. These data provide valuable resources to further exploring the anticancer potential of non-oncology drugs.
Many computational methods have been designed to repurpose drugs for cancer treatment. Early efforts used matched patterns of gene expression or other molecular signatures between cancer cells and drug treatment conditions to identify potential drugs23,24,25. With the accumulation of multi-omics and drug response data, more sophisticated machine learning and even deep learning approaches have been employed to integrate molecular features for cancer drug repurposing26,27. And molecular networks have proven useful for drug prediction28,29,30. Despite significant progress, there remains ample room for improvement, particularly in evaluating the potential of non-oncology drugs for cancer treatment. Firstly, while previous cancer drug sensitivity screenings have included some non-oncology drugs, few methods have been specifically developed for modeling of this particular drug group. In recent models based on PRISM screening results, the median correlation between non-oncology drug prediction models and actual drug responses is moderate20. Second, the majority of existing computational methods rely on various omics information for model construction, resulting in limited clinical applicability and highlighting the need for effective yet practical drug repositioning prediction methods. Finally, as cancer is predominantly a “disease of the genome”31, tumorigenesis in most cases results from multiple types of mutations at all genomic scales, including point mutations and chromosomal aberrations in both coding and non-coding regions. In contrast, existing computational methods based on mutation spectra or genotypes only consider protein-coding regions, neglecting the potential impact of non-coding DNA mutations on drug sensitivity. Therefore, overcoming these challenges to construct a unified and effective individualized non-oncology drug prediction method holds significant implications for precision cancer treatment.
To address these challenges, we developed CHANCE, a novel machine learning algorithm for repurposing non-oncology drugs for patients with cancer (Fig. 1A). Given a cancer patient’s genetic alterations derived from whole-genome sequencing, CHANCE virtually screens FDA approved non-oncology drugs and predicts the drugs with the highest anticancer potential for this patient. This is achieved by leveraging a large training dataset of >100,000 pairs of non-oncology drug-cell response data, employing a network-based flexible feature coding strategy to link genome-wide mutations and drug targets, and using an interpretable machine learning model to individually analyze pharmacological mechanisms. When it was compared with previous drug predicting models on the same dataset, CHANCE obtained better accuracy. On applying CHANCE to cancer genomes from TCGA/ICGC, we identified potential new therapeutic opportunities for >30% patients. Moreover, for experimental validation, we sequenced the genome of tumor cells derived from patients with two different cancer types and evaluated the anticancer efficacy of non-oncology drugs predicted by CHANCE. We found that CHANCE could predict effective non-oncology drugs based on the genome information of a patient. Thus, CHANCE appears to be a valuable tool for precision oncology.

A CHANCE represents the association between the genetic information of an individual sample and a specific drug through five different types of features. After training the machine learning model (gradient-boosted tree, GBT) using experimental drug sensitivity data from 318 cell lines to 647 drugs, we obtained our predictive model. We computationally screened FDA-approved non-oncology drugs that may be useful to cancer patients using whole-genome sequencing data and the CHANCE algorithm, and experimentally validated our predictions using patient-derived tumor cells. We also explained our prediction results through network visualization and SHAP analysis. B Correlation of predicted and experimental drug response data. Each dot (red) represents one drug-cell line pair from the training set. The contour lines show the density distribution of all points. We randomly sampled 100 data points for clarity. The solid blue line indicates the result of a linear fit to the points. The dashed line indicates the ideal situation when the predicted and experimental values are perfectly matched. The predictions in the figure were extracted from 10-fold cross-validation. PCC stands for Pearson correlation coefficient. C Performances of different machine learning algorithms. The predictive performances of XGBoost regression model (XGBRegressor) versus the other three alternative regression models (Random Forest, Bayesian ridge regression and linear regression) were shown. D Performances of tissue-specific models (bars) and CHANCE (dot line). For each mode, only data points from the corresponding tissue type were used to train an XGBoost regression model. Cross-validation was used to evaluated their performances. PDC means patient-derived tumor cells. AUC means area under the dose–response curve. The icons are modified from icon library provided by Microsoft Powerpoint plugin iSlide (https://www.islide.cc/) and have been authorized.
Results
Construction of an integrated machine learning model for non-oncology drug response prediction
In pursuit of a general drug repurposing model that leverages drug response data across various cancer types and drugs, we developed a supervised machine learning algorithm to model PRISM drug response data from 102,497 cell line–drug pairs (Supplementary Data 1). The model construction involved three main steps: (1) assembling a comprehensive annotated training dataset, (2) extracting pertinent features by leveraging molecular network information mediating cancer mutations and drug targets, and (3) training an interpretable gradient-boosted tree model (Fig. 1A).
We first compiled a comprehensive annotated training dataset based on the PRISM drug repurposing resource20 and mutation information from the Cancer Cell Line Encyclopedia (CCLE) project3. This dataset includes 647 drugs and 318 cancer cell lines. Drug targets were used to link the pharmacological mechanisms of drugs and patients’ genetic alterations. By combining cancer type-specific occurrence and genome-wide mutation pathogenesis scores, for each cancer type, we retained candidate coding and non-coding driver mutations from other passenger or background mutations. Using a mutation-gene mapping strategy, we inferred potential driver genes for each cancer cell line or tissue and defined the functional effects of these driver genes through public cancer gene databases (see Methods for details). On average, each CCLE cancer cell line carried approximately 4.38 potential driver genes, and each non-oncology drug was associated with 6.78 drug targets (Supplementary Fig. 1). Interestingly, only 3.25% (558/17,174) cases where non-oncology drugs effectively inhibited cancer cell growth [defined as half-maximal inhibitory concentration (IC50) < 10 μM] had at least one driver gene belonging to the drug target, suggesting that many non-oncology drugs suppress tumor cell proliferation by indirectly influencing cancer drivers.
In our previous study, we demonstrated that leveraging genetic evidence can substantially increase the success rate of drug development and effectively assess potential drug side-effects32,33. Considering the prevalent multitarget and low-toxicity characteristics of non-oncology drugs, we hypothesized that genome-scale mutations in cancer samples contain information capable of determining or predicting the efficacy of non-oncology drugs. Consequently, we designed a method based on molecular signaling pathways and protein–protein interaction networks, derived from the cancer genome, to associate potential driver genes in cancer samples with drug targets. Utilizing this approach, we extracted five major classes of features for subsequent model training (Supplementary Data 2, see Methods for details): (1) Pathogenic scores of driver mutations: four features representing mutation occurrence, pathogenesis, and association type with potential driver genes; (2) Mutation status of cancer genes: 708 cancer gene-level features summarizing the mutational states of canonical cancer genes; (3) Network proximity: five network-level features characterizing the network attributes between driver genes and drug targets; (4) Drug targets: two drug target-associated features reporting the specificity and reliability between a drug and each of its targets; and (5) Tissue of origin: 17 tissue-type features encoding 17 tissues of cancer origin. In total, 736 features were retrieved for each cancer drug–sample pair. Finally, we trained a regression-based gradient-boosted tree model34, i.e., CHANCE, to predict the area under the dose–response curve (AUC) using these features as input. A gradient-boosted tree model learns nonlinear combinations of input features using decision trees, each iteratively derived to minimize the error associated with the previous tree. The final prediction is obtained by combining the output of all decision trees.
Performance evaluation of CHANCE
To evaluate the accuracy of CHANCE, we employed Pearson’s correlation coefficient (PCC) to measure the correlation between predicted and actual AUC values in the training data. To prevent overestimation of performance, we conducted a 10-fold cross-validation test. The training dataset was randomly divided into 10 non-overlapping subsets, with each subset serving as a validation set while the remaining nine subsets were used for training. The cross-validation performance is illustrated in Fig. 1B, showing a significant correlation between actual and predicted AUC values, with a PCC of 0.49 (P < 2.2 × 10¹⁶). Moreover, we explored other machine learning algorithms (including linear regression, Bayesian ridge regression, and random forest) and found that the gradient-boosted tree-based regression algorithm implemented by XGBoost (XGBRegressor) yielded the best results (Fig. 1C). Compared to the predictive performance of models for non-oncology drugs in the original PRISM work (median PCC of approximately 0.2), the novel CHANCE framework demonstrated a marked improvement in overall performance.
Considering potential tissue type bias in CHANCE due to cell line composition, we trained individual models for each tissue type and benchmarked their performance (Fig. 1D and Supplementary Fig. 2A). PCC significantly varied across tissue types; the pancreas model exhibited the highest PCC (0.54), while the bone and prostate models exhibited the lowest values (PCC ≤ 0). When comparing the accuracy of CHANCE to tissue-specific models, CHANCE consistently showed better performance. For example, CHANCE achieved a PCC of 0.58 in peripheral nervous system cell lines, which was twice that of the tissue-specific model (PCC = 0.21). Further, compared to the tissue-specific model, CHANCE improved the correlation between prediction and experimental results by at least 0.1 for >50% (10/17) tissue types. The performance of machine learning algorithms generally improves with the size of the training dataset. Thus, we analyzed the correlation between tissue-specific model performance and the amount of training data, realizing that the performances of these models improved with an increase in the size of the training dataset (Supplementary Fig. 2B). This indicated that more training data yields better performance. Consequently, we concluded that a combined model using data from all tissue types can benefit those with limited data. Some drug action patterns associated with certain tissue types might be transferable to others.
Explaining the predictions made by CHANCE
We first investigated the usefulness of different classes of predictive features. Predictive models employing only one of the five feature classes were constructed and evaluated using cross-validation tests, and the results were compared to those of a model incorporating all features. Network proximity emerged as the most predictive feature type, outranking drug targets and cancer driver mutation-related features (Fig. 2A). This finding aligned with our observation that most anticancer effects of non-oncology drugs are indirect, highlighting the importance of exploring the potential of non-oncology drugs in a model considering their global network effects. Nevertheless, the best model fully utilized all five feature classes, suggesting their complementary nature.
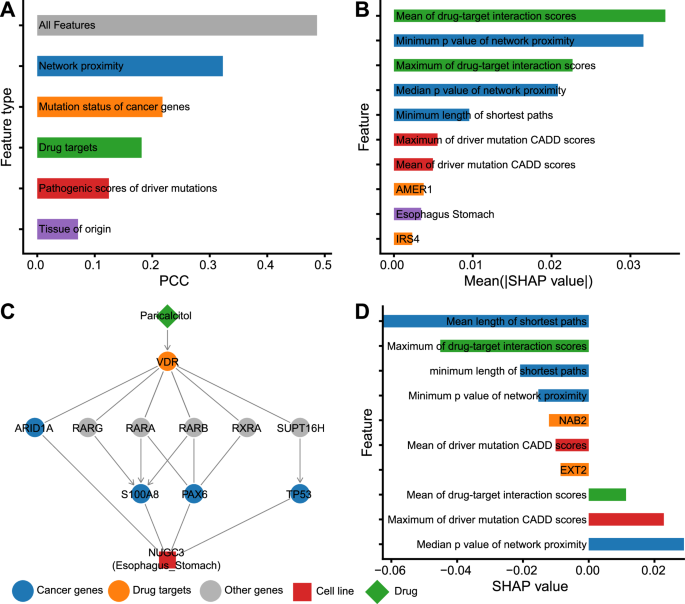
A The predictive performances of each of the five classes of features. We trained five predictive models and evaluated their performances with cross-validation. For each model, only corresponding features were used. The machine learning algorithm adopted here was the same as CHANCE did (i.e., gradient-boosted tree). For comparison, the performance of CHANCE (the model with All features) was also shown. B The 10 most impactful features for CHANCE predictions were calculated using global SHAP analysis. Bars are colorized according to feature classes corresponding to A. C Network visualization and feature importance analysis (D) of one representative example. The network plot shows the linking between driver genes and non-oncology drug targets, and the proteins mediating their interactions. The barplot shows the 10 most impactful features for predicting this case through local SHAP analysis. Bars are colorized according to feature classes corresponding to A. In the network, we use “->” to represent activation (for drug-target and protein-protein links) or GOF (for mutated gene-patient links). And we use “-|”to represent inhibition (for drug-target and protein-protein links) or LOF (for mutated gene-patient links). If there is no clear activation or inhibition relationship, “-” is used.
To further analyze the contribution of each feature to prediction, we employed the SHapley Additive exPlanations (SHAP) approach35, a popular game theory-based technique, to calculate the global impact of all 736 features on prediction results. Higher absolute SHAP values indicated a stronger impact on most prediction results. Figure 2B lists the top 10 most important features, including three features of network proximity, two of drug targets, two of pathogenic scores of driver mutations, one describing mutation status of cancer genes, and one of tissue of origin. This result validated the importance of all five feature classes, with network proximity and drug targets appearing to be the most informative categories.
SHAP analysis also provides a local explanation mode, which facilitates calculating the impact of each feature on individual prediction results. For a given prediction, a positive SHAP value indicates an increase in the expected AUC (increasing drug resistance) when the corresponding feature is added to CHANCE. On the contrary, a negative SHAP value indicates that the feature decreases the expected AUC (improving drug sensitivity).
To illustrate how CHANCE makes predictions using specific features, we examined the response of an esophagogastric adenocarcinoma cell line (NUGC3) to a vitamin D analog (paricalcitol). We selected this example owing to the positive drug response observed in PRISM experimental screening (experimental AUC = 0.6, IC50 = 0.2 μM) and the relatively accurate prediction (predicted AUC = 0.8) provided by CHANCE. When combined with other chemotherapy drugs, paricalcitol demonstrated a significant reduction in the number of tumor cells in animal models36. Low vitamin D levels are associated with poor prognosis in multiple cancer types37. Previous studies have reported multiple pathways involved in its role in cancer, such as the NF-κB, p38 MAPK, and VDR–RXRα pathways38. However, the biomarkers linking its effects to specific patients remain unclear. In Fig. 2C, D, we present the subnetwork connecting the targets of paricalcitol and driver genes of NUGC3 cells, as well as the SHAP values obtained through local explanation mode. It appears that paricalcitol can influence multiple cancer driver genes in NUGC3 cells by directly activating the VDR–RXRα pathway. Correspondingly, SHAP analysis ranked network proximity (i.e., the length of the shortest paths between driver genes and drug targets) as the most important feature. The specificity of this drug on vitamin D receptor and the significance of network proximity were captured as the relatively large absolute SHAP values of the drug target interaction scores and network proximity p-values (see Methods for details about the calculation of network proximity p-values). However, the varying effects (negative and positive) of the same types of features on the predicted AUC also suggest complex regulatory relationships within cancer genome-derived molecular pathways. By leveraging the informative paths and feature importance learned by CHANCE prediction, we propose that the VDR/RXRα pathway mediates the anticancer effects of vitamin D analogs in patients with specific mutations. This approach can also be applied to intuitively explain the anticancer effects of other non-oncology drugs.
Successful prediction of drug responses by CHANCE for patients with cancer in literature-reported drug repurposing cases
Previous findings on the anticancer activities of non-oncology drugs have motivated this work and can serve as a valuable resource for benchmarking CHANCE. Unfortunately, these findings are usually based on biochemical experiments or incidental observations in clinical trials and rarely provide relevant genetic data, which makes them unsuitable for directly evaluating CHANCE. To address this, we designed a computational scheme to assess whether CHANCE can predict the anticancer potential of reported drugs. This was achieved by comparing the predicted AUC values of these drugs in patients with a specific type of cancer to the AUC values of effective (positive control) or ineffective (negative control) drugs from the PRISM screening experiment (see Methods for details).
Twenty-four non-oncology drug and cancer type pairs were collected from the literature, encompassing 13 drugs across cancers with seven different tissues of origin (Supplementary Data 3). These pairs have experimental or clinical evidence demonstrating the anticancer activity of these drugs in corresponding cancer types17. For these reported drug repurposing cases, CHANCE successfully identified seven as Matched cases (supported by both positive and negative controls), six as Partially Matched cases (only supported by negative controls), and 11 as Mismatched cases (not supported by positive or negative controls) (Supplementary Fig. 3). Figure 3A–E lists all Matched cases. For example, the nonsteroidal anti-inflammatory drug aspirin, which has shown anticancer activity in clinical trials for esophagus/stomach cancer, was identified as a Matched case by CHANCE. Similarly, CHANCE successfully predicted the efficacy of the type-2 diabetes drug metformin in prostate and breast cancers and that of the bacterial diarrhea drug berberine in esophagus/stomach and lung cancers. Overall, among the 24 tested drug–cancer type pairs, 13 were predicted to have better anticancer activity than the negative control (success rate = 54%, Fig. 3F). However, CHANCE did not perform well on some well-documented drug repurposing cases. For example, it incorrectly predicted the effects of rapamycin in breast and prostate cancers, where the predicted AUC value was higher than that of the positive control group and similar to that of the negative control group. It is important to note that due to data constraints, this evaluation is limited to the overall performance of the drug in a particular type of cancer. However, patients with cancer do not uniformly respond to the same drug due to differences in their genetic background and driver mutations, so these results may underestimate the actual performance of CHANCE in individual patients. In summary, our results, based on clearly reported examples, suggest that CHANCE has the potential to identify new therapeutic opportunities in patients with cancer.
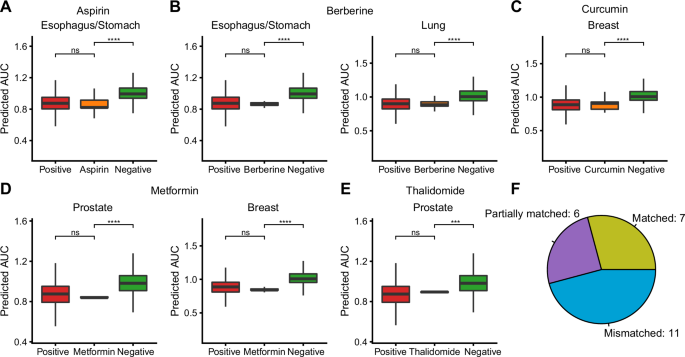
A–E Seven drug-cancer type pairs in which CHANCE correctly predicted the overall response distribution (Matched cases) in TCGA/ICGC patients. The positive control drugs were defined as those drugs that can effectively kill tissue type-matched tumors cells in PRISM drug sensitivity experiments. The other drugs were defined as negative control drugs. We compared the predicted AUC values of positive (red), negative (green) and literature reported anticancer non-oncology drugs (orange) in TCGA/ICGC cancer samples (one-sided Wilcoxon test). F Summary of the distribution of Matched, Partially matched and Mismatched cases for 24 literature reported non-oncology drug repurposing cases. The detailed definition of how to classify these cases can be found in Methods.
Potential opportunities revealed by CHANCE for non-oncology drugs in cancer treatment
Although drug repurposing is often seen as a solution to cancer drug shortages, the extent to which patients might benefit from this approach remains unclear. To comprehensively understand the potential of drug repurposing in cancer therapy, we systematically analyzed the responses of 5,197 patients with cancer across 15 tissue types to 923 FDA-approved non-oncology drugs using CHANCE and genomic data from TCGA/ICGC (Supplementary Data 4). As evident from Fig. 4A, 37.5% (1,953) patients could be successfully assigned at least one non-oncology drug, defined as those with AUC values among the top 10% of the entire training set. However, the proportion of patients likely to benefit from drug repurposing markedly varied across different cancers (Fig. 4A). For instance, as high as 79% patients with pancreatic cancer were considered “druggable,” meaning they showed the potential to favorably respond to repurposed drugs. In contrast, fewer than 10% patients with prostate and kidney cancers exhibited the potential for effective treatment with a non-oncology drug. In addition, we observed that a significant portion (41%) of these “druggable” patients could be assigned only one potential drug (Fig. 4B). Expanding the scanned drug database seems necessary to provide more options for these patients.
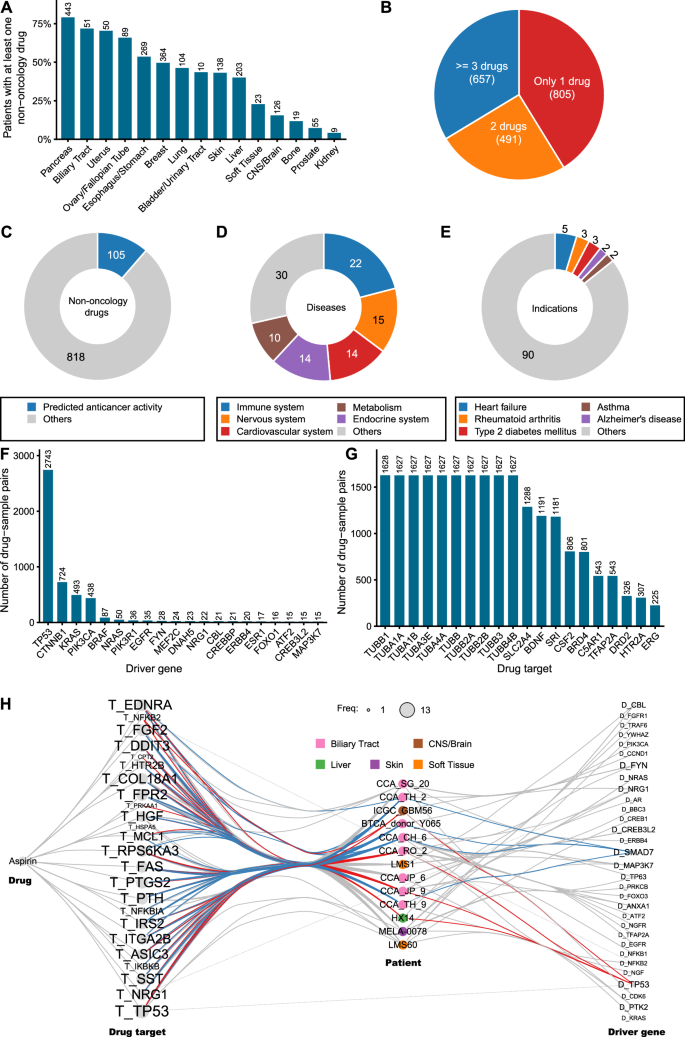
A Proportion of patients who may be treated with non-oncology drugs in cancers of different tissue origins. The actual number of patients for each cancer type is shown at the top of the corresponding bar. B Pie plot shows the proportion of druggable patients who have a different number of drugs. The numbers in parentheses are the number of patients. C The ratio of non-oncology drugs with predicted anticancer activity. The number of drugs is shown in the donut plot. D Distribution of the applicable disease areas of non-oncology drugs with predicted anticancer activity. Only the top five indications are shown. E Distribution of the original indications of non-oncology drugs with predicted anticancer activity. Only the top five indications are shown. F Barplot shows frequently used driver genes in CHANCE prediction. Only the top 20 genes are shown. G Barplot shows frequently used drug targets in CHANCE prediction. Only the top 20 targets are shown. H Network diagram shows driver genes and drug targets in 13 patients who may be treated by aspirin. Only driver genes and targets that are used in the prediction of CHANE are shown. Nodes with names starting with “T_” is a drug target. Nodes with names starting with “D_” is a driver gene. The size of the drug target or driver gene node is proportional to the number of times it appears in the 13 patients. Patient nodes are colorized according to the tissue of origin of tumor cells. The edges are colorized blue if they connected with patients harboring driver gene SMAD7. Edges are colorized red if they connected with patients harboring driver gene TP53.
As predicted by CHANCE, 106 (11%) of the 923 non-oncology drugs analyzed by us exhibited potential anticancer activity (Fig. 4C). Many of them are used to treat diseases of the immune, nervous, and cardiovascular systems (Fig. 4D). The most common indications for these drugs are asthma, hypertension, and schizophrenia (Fig. 4E). It is not entirely surprising to find many repurposed drugs being used for immune-related diseases, given the extensive influence of the immune system and its associated signaling pathways on various aspects of cancer. Moreover, using drugs traditionally prescribed for nervous and cardiovascular system disorders offers an intriguing avenue. These drugs, often targeting ion channels or neurotransmitter receptors, represent a largely unexplored area in cancer drug development. Emerging evidence suggests related pathways could play pivotal roles in cancer progression, including processes such as metastasis39 and cancer stem cell self-renewal40. Consequently, these aspects may represent innovative therapeutic targets. Our predictions, therefore, highlight the anticancer potential of these drug classes, underscoring the need for further research.
As a personalized model, the predictions made by CHANCE are tailored to specific mutations harbored by an individual, resulting in varying contributing drug targets and driver genes across different drug–sample pairings. To investigate which drug targets and driver genes were the most useful in repurposing the 106 non-oncology drugs for the 5,197 patients with cancer, we extracted drug targets and driver genes used by CHANCE for each patient–drug pair. Most predictions were found to be related to the presence of driver mutations in TP53, CTNNB1, KRAS, or PIK3CA in patient tumors (Fig. 4F). This likely occurs because mutations in these genes are more common in patients with cancer and are involved in diverse biological processes, making it easier for non-oncology drugs to interact with them either directly or indirectly. This also explains why a relatively high proportion of patients with pancreatic cancer could benefit from non-oncology drugs, given the prevalence of KRAS and TP53 mutations in these patients. Notably, 37.8% (3298/8725) of the driver mutations used by CHANCE are non-coding mutations, indicating that non-coding mutations play a non-negligible role in predictions made by CHANCE. We also calculated the frequency of drug targets used in these predictions (Fig. 4G). Microtubule proteins were the most frequently targeted, appearing >1600 times, suggesting a dominant drug in this distribution. After examining all predicted pairs, we found that colchicine was involved in 1625 predicted outcomes, corroborating our speculation. Colchicine inhibits cell division by binding to microtubule proteins and blocking spindle assembly. Due to its toxicity at high dose, it is currently used in low doses for treating gout flares. Our predictions suggest that a subset of patients with cancer may be more sensitive to colchicine and could benefit from low-dose therapy. Another important protein target in cancer is BRD4, which reportedly activates c-MYC and c-JUN to promote cancer progression by transcription regulation. However, the functions of many frequently used drug targets in cancer remain unknown.
We hypothesized that aggregating data from multiple patients predicted to respond to the same drug might reveal valuable genetic biomarkers for guiding drug repurposing. Aspirin, for example, has been reported in many studies to have potential anticancer activity, but clinical trials have not been very successful due to the lack of validated biomarkers41,42. As a proof-of-concept, we studied 13 aspirin–patient pairs predicted by CHANE. All drug targets and driver genes used by predictions made by CHANCE were extracted and combined into a meta-network (Fig. 4H). By observing the linkages in the network, we identified two distinct patterns for drug targets and driver genes. Most drug targets were shared among these patients, with 16 of the 24 aspirin targets (such as TP53, DDIT3, and EDNRA) used in at least 77% (10/13) patients. In contrast, the most frequently used driver genes (TP53, SMAD7, and FYN) were only observed in only four patients each. More importantly, these driver genes were exclusively used for predicting different patients. For example, SMAD7 was used for four patients with biliary tract cancer and TP53 for two patients with biliary tract cancer, one with brain cancer, and one with liver cancer. Thus, aspirin may influence different cancer pathways through a common group of targets. Although we did not identify driver genes to be mutated in most aspirin-suitable patients, some reports support the potential value of the frequently used driver genes identified by us. For instance, previous genome-wide association studies have reported associations between SMAD7 polymorphisms and cancer risk, which can be modified by aspirin/nonsteroidal anti-inflammatory drug use43,44. We believe that more common driver mutations frequently used in multiple CHANCE predictions could be mined to identify useful biomarkers.
Experimentally testing potential non-oncology drugs for patients with advanced cancer
To evaluate the applicability of CHANCE in clinical settings, we first tested it using patient-derived pancreatic tumor cells. We chose pancreatic cancer for two main reasons: (1) there are few effective treatment options for patients with advanced pancreatic cancer and (2) according to our previous testing, CHANCE showed the highest accuracy for pancreatic cancer. We sampled tumor cells from two patients (P052 and P080) using our previously established modified wet suction technique45 and cultured them in vitro. The genome information of these tumor cells was obtained using whole-genome sequencing, yielding 201.95 and 151.52 billion base pairs of DNA sequences for P052 and P080, with average read depths of 70.49× and 52.89×, respectively. Three driver mutations were identified from P052 (CTNNB1:p.S45F, TP53:p.E153K, and SMAD4:p.R445X) and six from P080 (one missense mutation KRAS:p.G12V and five non-coding mutations belonging to the non-coding regions of TAF5, PCDH9, MIPOL1, and ZNF536 genes and DLX6-AS1 lncRNA gene) (Supplementary Data 5). These driver mutations were indicative of disruptions in some canonical oncogenic pathways, such as the Wnt/β-catenin signaling pathway (CTNNB1:p.S45F), p53 pathway (TP53:p.E153K), TGFβ pathway (SMAD4:p.R445X), and RTK/RAS pathway (KRAS:p.G12V). Unfortunately, querying the OncoKB database revealed no FDA-approved drugs for treating patients with pancreatic cancer harboring these driver mutations. This gap between biological understanding and clinical application underscores the urgent need for more cancer drugs and is a key motivation for this study.
We input all genetic variations identified from whole-genome sequencing into CHANCE to search for other treatment options among the 923 FDA-approved non-oncology drugs. We selected three drugs from the top-ranked non-oncology drugs (Supplementary Data 6) for each patient to evaluate their ability to inhibit tumor cell proliferation. A drug was defined as potentially effective if its IC50 was <20 μM. We identified two neurotransmitter receptor antagonists (perospirone and pimavanserin) for P052 and one voltage-gated calcium channel blocker (bepridil) for P080 (Fig. 5A–C). Pimavanserin, an anti-Parkinson drug, shows anticancer effects in pancreatic cancer cell lines by inhibiting the Akt/Gli1 signaling axis46. Bepridil hydrochloride, a heart disease drug, induces apoptosis in leukemic cells by decreasing NOTCH1 activation47 or inhibits brain tumor cell viability in vitro45. These findings further support our results. However, there is little literature on the anticancer activity of the antipsychotic agent perospirone, a neurotransmitter receptor antagonist used to treat schizophrenia.
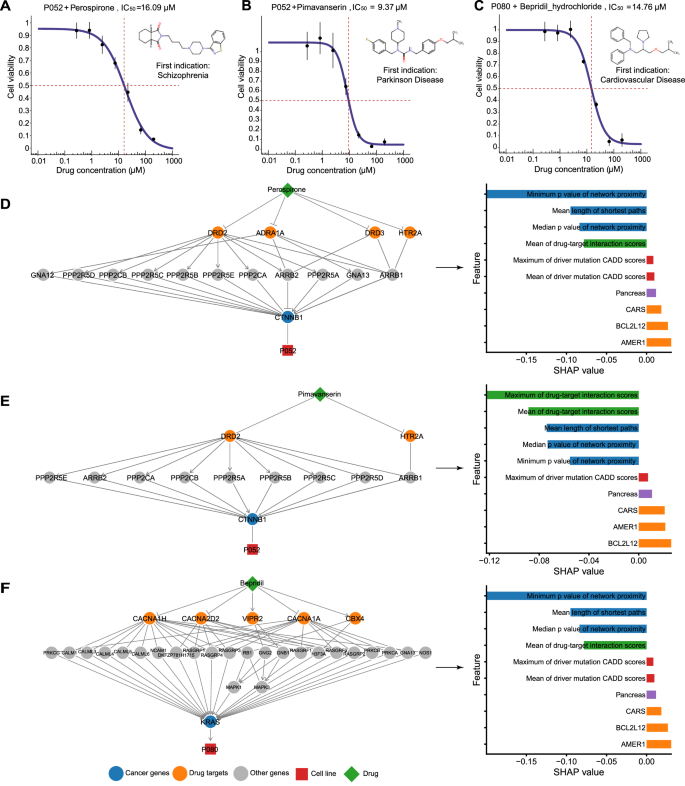
A–C Drug responses of patient-derived tumor cells to tested drugs. The drug name and ID of the corresponding patient are shown at the top of each subplot. The vertical dotted lines mark the points corresponding to the IC50 values. Seven different concentrations were used for each drug. The experiments were repeated three times at each concentration. Error bars show the standard deviation of three replicates. D–F Network visualization and SHAP analysis of potential effective drugs. The meaning of the elements is the same as in Fig. 3.
To understand why CHANCE selected these drugs, we used network visualization to explore the proximity between drug targets and driver genes, and then leveraged SHAP analysis to quantify the importance of all features in each case (Fig. 5D–F). The two drugs effective in P052 were found to share drug targets, including the dopamine receptor DRD2 and 5-hydroxytryptamine receptor 5HT2A (HTR2A), which was expected given their approved indication for psychosis. Beyond neural activity, DRD2 has been reported to modulate Wnt3 expression and control cell proliferation via WNT/β-catenin signaling48. Our network analysis indicated a connection between DRD2 and mutated β-catenin (CTNNB1), a key downstream component of the Wnt/β-catenin signaling pathway, via multiple protein phosphatases. CTNNB1:p.S45F reportedly damages the phosphorylation site for casein kinase-149 and also increases β-catenin activity and nuclear accumulation50. Thus, increased β-catenin activity could be a crucial signal supporting tumor cell proliferation in P052 and could be targeted for therapy. Inhibiting the dopamine receptor may improve β-catenin phosphorylation (by suppressing protein phosphatase), decreasing β-catenin stability. In addition, inhibiting 5HT2A may contribute to the anticancer activity of these drugs. Zhu et al.40 recently reported that 5-hydroxytryptamine secreted by enteric serotonergic neurons induces Wnt signaling activation via 5HT2A, driving the self-renewal of colorectal cancer stem cells. Levels of 5HT2A are positively correlated to colorectal cancer severity. Our network analysis showed that 5HT2A indirectly connects to β-catenin through β-arrestin (ARBB1), a necessary component of Wnt/β-catenin signaling51. These results imply that the inhibition of dopamine or 5-hydroxytryptamine receptors can suppress mutation-driven overactivation of Wnt/β-catenin signaling, which suggests that Wnt/β-catenin signaling-related driver mutations can serve as biomarkers for the effectiveness of perospirone and pimavanserin in cancer treatment. Data obtained from SHAP analysis further supported this, indicating that mutations within AMER1, a negative regulator of Wnt/β-catenin signaling, increase tumor cell resistance to these drugs. AMER1, or WTX, forms a complex with β-catenin, AXIN1, β-TrCP2, and APC, and promotes β-catenin ubiquitination and degradation52. A frameshift deletion in the exon 2 (p.L406Rfs*34) of AMER1 was observed in this patient, decreasing its protein expression and increasing Wnt/β-catenin signaling activity.
Network analysis provided valuable insights into the usefulness of bepridil for P080. Bepridil blocks calcium channels in a long-acting, non-selective manner, showing significant anti-anginal activity. Changes in Ca2+ concentration affect muscle function and also have pleiotropic effects on cell behavior. It is well established that Ca2+ fluxes are closely related to cancer, mediated by several pathways, including RAS signaling53,54. Network analysis showed an association between bepridil-targeted calcium channels and mutated KRAS through RAS guanyl-releasing proteins (e.g., RASGRF2 and RASGRF3). These proteins specifically activate RAS proteins but their activities are dependent on binding with calcium and diacylglycerol54. As a calcium channel blocker, bepridil seems to indirectly inhibit KRAS activation by interfering with the exchange of bound GDP to GTP. However, our in vitro drug sensitivity experiments revealed that bepridil inhibits tumor proliferation only at very high concentrations (IC50 > 10 μM, Fig. 5C), which raises many safety concerns for clinical applications. Consequently, bepridil is no longer marketed in the United States due to its risk of causing ventricular arrhythmias. Combining bepridil with other cancer drugs could be more efficient and necessary, as suggested by previous studies55,56.
Encouraged by these results, we sought to evaluate the performance of CHANCE in an additional cancer type. We experimentally tested its predictions on samples from five patients with esophageal cancer. Patient-derived tumor cells were used to perform whole-exome sequencing (~100×) and drug sensitivity assays. The top five drugs predicted by CHANCE for each patient were selected as candidates for testing, excluding hormone and corticosteroid drugs due to their serious side-effects. As a result, we tested a total of 18 non-oncology drug-patient pairs, with 2–5 drugs tested per patient (Supplementary Data 7). Two drugs showed anticancer potential, including eltrombopag (IC50 = 5.2 µM) and nisoldipine (IC50 = 12.94 and 16.57 µM) (Supplementary Fig. 4), covering thee out of five patients. These drugs are used for treating thrombocytopenia (eltrombopag) and cardiovascular disease (nisoldipine). Overall, these results demonstrated the usefulness of CHANCE for nominating potential anticancer drugs across multiple cancer types and its compatibility with whole-exome sequencing, which is more commonly used than whole-genome sequencing in current clinical practice.
Discussion
Drug repurposing represents a cost-effective, time-efficient strategy to expedite drug development. The discovery of the potential of a non-oncology drug in cancer treatment often occurs serendipitously. Herein we report the development of CHANCE, a novel machine learning algorithm, for repurposing non-oncology drugs for cancer treatment. We systematically evaluated its performance using computational and experimental methods. Compared to previous drug repurposing efforts, CHANCE could provide individualized treatment recommendations based on genome-scale genetic alterations detected through whole-genome sequencing, which is particularly important in cancer treatment due to the commonality of genetic heterogeneity57. In addition, predictions made by CHANCE were not limited to the drugs in its training data, allowing it to identify potential uses for previously unseen non-oncology drugs. We used CHANCE to analyze data from TCGA/ICGC, as well as our clinical samples. Our results indicate numerous opportunities for repurposing non-oncology drugs in cancer treatment. We believe CHANCE can help researchers uncover new therapeutic opportunities.
Network-based features enable CHANCE to link targets of non-oncology drugs and driver mutations in a flexible and explainable manner. It is challenging to directly match non-oncology drugs with patients with cancer as the targets of these drugs are usually not mutated driver genes. Moreover, most patients harbor multiple genetic alterations in their genomes. The molecular network serves as a useful resource to link genes within the same functional pathway58. This approach has been successfully applied for functionally annotating cancer mutations59, predicting drug combinations60, and drug repurposing for COVID-1961. Inspired by these studies, we used the protein–protein interaction network to measure the topological distance between drug targets and driver genes and assessed the compatibility between drug effects and driver mutation effects. This allowed us to construct an informative representation of the complex functional relationships between drugs and diverse mutations in a unified manner. Indeed, network proximity scores were the most important features according to our SHAP analysis. Furthermore, this method could naturally explain candidate drugs through network visualization. Based on the network information, we have proposed possible anticancer mechanisms for three experimentally validated non-oncology drugs (perospirone, pimavanserin, and bepridil). Although these hypotheses demand further investigations, our interpretable results should facilitate the design of subsequent biochemical experiments.
Like many other machine learning algorithms, the accuracy of CHANCE needs to be tested on independent datasets to ensure its performance is not overestimated. However, this is challenging owing to the paucity of large-scale experimental data for non-oncology drugs. Many experiments or clinical studies report the anticancer effects of non-oncology drugs on specific cancer types but lack individualized biological information of patients or cell lines, such as genetic alterations. To circumvent this dilemma, we adopted three strategies to benchmark CHANCE: (1) evaluating our novel encoding strategy by comparing CHANCE with cross-validation, (2) investigating if CHANCE-predicted AUC distribution for a non-oncology drug matches literature reports for specific cancer types, and (3) using patient-derived tumor cell models to experimentally validate drugs predicted by CHANCE. CHANCE was more accurate than previous methods and its predictions matched those with the literature in >50% cases. Further, our experimental results encouraged us to believe the top-scored drugs by CHANCE may be useful. The drugs predicted by CHANCE should serve as starting points for identifying new therapeutic opportunities, and thus, they should be further validated and optimized.
CHANCE can provide a bridge to connect personal drug requirements with drug sensitivity information learned from cell line experiments. However, several limitations need to be addressed. First, although cell lines are important workhorses in cancer research due to their high tractability, differences in drug responses between cell lines and patients have been pointed out62. As patient-derived xenograft or organoid models become more mature, drug screening data from these platforms are bound to ameliorate this problem. Second, CHANCE may not be effective for drugs without accurate target information. CHANCE uses drug targets as a general proxy for pharmacological mechanisms, implying its predictions would be incorrect if the true targets differ from those annotated in databases. Third, we used a static molecular network to construct our model and hard-encoded tissue types as independent features. This design can be improved by adopting tissue-specific networks.
We experimentally tested CHANCE predictions using tumor cells derived from seven patients with pancreatic or esophageal cancer and validated five non-oncology drugs (including perospirone, pimavanserin, bepridil, eltrombopag and nisoldipine) with IC50 values between 5.2 and 16.57 µM. Although these values are high compared to those of highly effective anticancer drugs that have been specifically optimized for cancer treatment during the drug development phase, there are still potential applications for these candidate drugs for below reasons. First, non-tumor drugs are generally less cytotoxic. For example, perospirone has oral LD50 (median lethal dose) values of 600 mg/kg and 870 mg/kg in mice and rats, respectively, whereas gemcitabine, a first-line chemotherapeutic agent for pancreatic cancer, has oral LD50 values of 333 mg/kg and ~500 mg/kg in mice and rats, respectively63. Such low toxicity allows relatively high doses to be given during cancer treatment. van Kalken et al.’s work56 demonstrated that bepridil plasma concentration could reach 2.6~19.3 µM through a continuous 36 h infusion for cancer treatment. Another study64 also reported that it is possible to achieve very high level of non-oncology drugs in the blood of some individuals. Second, the range of IC50 values observed in the five drugs is not unrealistically high. These drugs are likely to exhibit anticancer activity at safe doses in vivo. It has been shown in a previous work46 that pimavanserin has a IC50 value of 8.9 µM in PANC1 cell line, however, it can significantly suppress the proliferation of pancreatic tumors in mouse model, which received 10 mg/kg pimavanserin every day. And no general signs of toxicity were observed. In another example, although Ref-1 inhibitor E3330 has IC50 values range from 20 to 50 µM in vitro tests on cell lines65,66, Hu et al. showed that the growth of tumors in mice fed with 50 mg/kg E3330 once a day could also be significantly inhibited66. Finally, we would like to emphasize that the use of a single drug to treat cancer patients is very rare in clinical practice. Instead, it would make more sense to further explore the synergistic effects of these non-oncology drug candidates with existing anti-cancer drugs.
Methods
Non-oncology drug information
We downloaded all drug records from DGIdb67 (v2017) and extracted drug information including: protein targets of a drug, the interaction score for each drug-target pair which summarizes the specificity and number of evidences between of them, the effect of a drug on specific target (also known as model of action, MOA), drug indications and the clinical status of each drug. We call a drug as oncology drug if anyone of its indications can be successfully matched with at least one cancer type listed in MSKCC OncoTree68. And the other drugs in the databases are defined as non-oncology drugs for further analysis. According to the MOA of drug-target pair, we classified these relationships into four categories: Activation (A), Inhibition (I), Activation and Inhibition (A,I) and unknown.
Building pathogenic mutation scoring scheme
Somatic mutation data including SNVs and short Indels from 78 ICGC projects across 22 tissues were downloaded from ICGC official website2 (release 27). Cancer names were unified by matching them to OncoTree Level 1 and Level 2 nomenclature. We filtered out 86,031 cancer type-specific pathogenic mutations (Supplementary Data 8) using two conditions: (1) more than one patient affected by the mutation in a specific cancer type; (2) CADD PHRED Score69 ≥15.
Pathogenic mutations were further associated with 16,294 target genes at different levels (Supplementary Fig. 5 and Supplementary Data 9) according to Ensembl Variant Effect Predictor70 (VEP) annotations. (1) Level 1.1: Mutations located in protein-coding regions or splicing sites of the target genes; (2) Level 1.2: Mutations located in non-coding regions within the target gene body; (3) Level 2: Mutations located in enhancer of the target gene. Enhancer-target interaction were predicted by JEME71; (4) Level 3.1: Mutations that are associated with the nearest gene by VEP; (4) Level 3.2: All other mutations that have not been associated by above rules will link to the nearest protein coding genes.
The above levels reflect association strength between pathogenic mutations and corresponding genes. We assigned association score 5, 4, 3, 2, 1 for Level 1.1, Level 1.2, Level 2, Level 3.1, Level 3.2, respectively. And for each mutation, it can only be classified into the lowest level of one target gene.
To determine if a mutation will induce loss of function (LOF) or gain of function (GOF) in oncogenesis, we first annotated 4,053 cancer driver genes by combing three cancer driver gene databases (COSMIC72 v84, OncoKB14 and CancerMine73) (Supplementary Data 10), and 3,462 cancer driver genes were mapped by above pathogenic mutations. If a pathogenic mutation is associated with an oncogene (or a tumor suppressor gene), is will be taken as a GOF (or LOF) mutation. Specially, if a cancer gene is annotated as an oncogene and a tumor suppressor gene, every associated mutation will be label with “LOF, GOF”.
Pharmacogenomic data used for CHANCE training
Cancer cell viability profiling data
Drug response data of non-oncology drugs on cancer cell lines were downloaded from PRISM drug repurposing resource (https://depmap.org/repurposing/). The AUC (dose-response area under the curve) values from secondary screen were used. If a drug-cell pair had multiple AUC values, we calculated median of them. The original data contain 1,448 drugs tested across 480 cell lines and correspond to 701,004 drug-cell pairs. CHANCE models the relationship between drugs and cancer cells by linking drug targets and driver mutations through gene networks. We removed some drug-cell pairs that do not meet our criteria to link them (see Feature engineering for more details). The final training dataset contain 647 drugs (335 non-oncology drugs and 312 oncology drugs) tested across 318 cell lines and corresponds to 103,371 drug-cell pairs. Note that we included oncology drugs in our training data for two reasons: (1) a larger training data could improve the overall performance of the machine-learning algorithm; (2) there was no difference for CHANCE in learning relationships between input features and drug responses for non-oncology and oncology drugs.
Genetic information of cell lines
Genetic information of all cell lines used in PRISM drug repurposing were downloaded from Depmap19Q4 (https://depmap.org/portal/download/all/CCLE_mutations.csv). All mutations were converted into HGVSg format with TransVar74 and pathogenic mutations among them were identified using our established pathogenic mutation database described in above section.
Feature engineering
Linking and refining drug targets and driver mutations
To improve the signal-to-noise ratio of our features used in machine learning process, we designed some criteria to remove noninformative network paths between drug targets and cancer drivers before feature encoding. These criteria include two parts:
In the first one, we calculated an empirical threshold of network proximity utilizing a drug repurposing database RepurposeDB75. In RepurposeDB, a drug and its new disease indication are recorded. We downloaded all drug repurposing cases stored in RepurposeDB and collected corresponding drug target information from DGIdb and disease genes from DisGeNET76. For a drug-new disease pair in RepurposeDB, all targets of the drug were selected as seeds in the protein-protein interaction network, and a network propagation analysis was conducted using random walk with restart (RWR) algorithm77 to obtain network proximity measurements between targets and all other genes in the network. The higher the score is, the disease gene is closer to targets. We used ReactomeFI78 as our protein-protein interaction network here. The restart probability of RWR was set as 0.7. If disease genes were enriched (Fisher’s exact test, p < 0.05) in the top t% high score genes, we said the predicting is successful. We searched a minimum of t that we could successfully recall most drug-disease pairs in RepurposeDB and got the optimized t = 4.4 in our work. Before encoding the features of CHANCE for each drug-cell pair, we also firstly performed RWR with drug targets as seeds. Then, we ignored drivers whose network proximity is not in top t%, which means they were not considered in further feature encoding process. In addition, we computed an empirical p value to represent specificity between drug targets and a driver. To do this, we randomly selected 1000 gene sets with same size as the real drug targets and conducted RWR. The time n of a driver in the top t% nearest genes would use to calculate p-value as n/1000.
In the second part of our criteria, we removed links between a drug and drivers that showed illogical association. For example, an inhibitor should not act on a driver with LOF mutation. A non-oncology drug can directly affect the function of a mutated cancer driver when driver and drug target is the same gene. Beyond that, the perturbation of drugs on its targets can also spread to drivers that multiple steps away in the biological pathway by protein-protein interactions. For specific drug-cell pair, both scenarios can exist because there are usually more than one targets for a drug and multiple drivers mutated in one cell line. It’s easily to identify illogical associations for direct links. For indirect links, we examined all shortest network paths between a target and a driver and considered the interaction types (such as inhibition or activation provided by ReactomeFI) along these paths. Any inconsistent network paths would be removed. We also removed paths with length larger than network diameter to further improve the confidence of network paths. R package igraph79 was used to search shortest paths.
Based on these strategies, we linked a drug and a sample by the shortest paths initiated from the drug targets to the drivers identified in the sample, and made sure that the pharmacological MOA of the drug on its targets was consistent with the functional effects of cancer drivers. These paths were called as informative paths. And all cancer drivers and drug targets that were included in informative paths were called informative driver genes and informative drug targets. If there was no any network path could be identified after application of above criteria, the drug-cell pair would be deemed as unpredictable for CHANCE.
Pathogenic scores of driver mutations as features
Based on the mutation-gene association levels that we had established in building pathogenic mutation database, we used (1) the mean and (2) maximum of association levels to summarize the causal relationship between mutations and function alteration of informative driver genes. We also added the other two features to represent importance of mutations: (3) the mean and (4) maximum of driver mutation CADD PHRED scores.
Mutation status of cancer genes as features
In addition to cancer driver mutations, we also encoded the non-silent mutational states of 708 canonical cancer genes listed in Cancer Gene Census (COSMIC v92) in to a binary feature vector no matter whether these mutations were driver or not. If a gene is mutated, the corresponding feature will be set as 1. Otherwise, it will be set as 0. We adopted this strategy in encoding cancer driver status based on below consideration. We would like to use a relatively concise approach to encode genotypes of cancer cells. And although mutations in some cancer genes may not be driver mutations, they may still affect the cellular response to drugs. We therefore considered all non-silent mutations located on canonical cancer genes.
Network proximity between drug targets and mutated driver genes as features
We designed five features to characterize network proximity: (1) The average and (2) minimum of network distances between informative drug targets and informative driver genes, which were measured as the length of informative paths, (3) the median and (4) minimum of empirical p values representing specificity of proximity (measured by RWR) between informative drug targets and informative driver genes and (5) the proportion of informative driver genes which were directly targeted by the drug in all informative driver genes. The definition of informative paths and empirical P values can be found in section headed “Linking and refining drug targets and driver mutations” in Methods.
Drug-targets as features
DGIdb provides a drug-target interaction score to reflect the drug specificity, gene specificity and number of evidences supporting an interaction between a drug and a gene target. Because most drugs have more than one targets, we summarized all interaction scores between the drug and its informative targets into two features: (1) the mean of drug-target interaction scores and (2) the maximum of drug-target interaction scores.
Tissue of origin as features
To integrated cancers with different tissue of origin into one model, we encoded the tissue information corresponding to each cancer using one-hot encoding strategy, which means a binary feature vector with a length equals to 17 (= number of tissue types) was used to represent it. The feature stands for tissue type of the sample would be set as one, and left the others as zero. The 17 features encoding tissue of origin are corresponding to: Biliary Tract, Bladder Urinary Tract, Bone, Breast, CNS/Brain, Esophagus/Stomach, Kidney, Liver, Lung, Ovary/Fallopian Tube, Pancreas, Peripheral Nervous System, Prostate, Skin, Soft Tissue, Thyroid and Uterus.
Training of the machine learning model
We train a regression model to predict AUC of tested samples to non-oncology drugs using XGBRegressor function provided XGBoost. The parameters of our model are set as below: booster = ‘gbtree’, eval_metric = ‘rmse’, gamma = 0.3, min_child_weight= 5, max_depth= 9, subsample= 0.95, colsample_bytree= 0.95, tree_method= ‘exact’, learning_rate=0.1, n_estimators=1000, reg_alpha=0.1, nthread=10 and seed=27. We also tested other machine-learning algorithms with default parameters, including linear regression, Bayesian ridge regression and Random Forest, which were provided in Scikit-learn framework80.
Literature reported drug repurposing cases
Twenty-four non-oncology drug-cancer repurposing relationships were manually curated from literature17. We matched the reported cancer types in original articles into tissue levels of OncoTree. To test if CHANCE can distinguish useful non-oncology drugs from others in specific cancer types, we first defined the drug-cell line pair with AUC smaller than the median of all AUCs in training data as sensitive and the larger one as resistant, respectively. Then we performed benchmark analysis for specific cancer types as below:
We defined a drug for which more than 50% tested cell lines showing sensitivity as the positive control, otherwise the drug was deemed as a negative control. Note that only cell lines from the tissue types we are interested in were included in this step. Then we predicted the drug response of TCGA/ICGC tissue type-matched tumor samples to all drugs in training data and literature reported effective drugs. If the average AUC of the reported drug had no significant difference with the average AUC of positive control drugs or even smaller than the positive control drugs’ average AUC (one-sided Wilcoxon test), we said it as the Matched case. Because CHANCE predicted that the reported drug showing overall drug response as good as the overall drug response of positive control drugs for this cancer type. If the average AUC of the reported drug was between the values of positive and negative control drugs (i.e., AUCpositive_control < AUCreported_drug < AUCnegative_control), we said this case as the Partially matched. And if the average AUC of the reported drug did not show significantly smaller value when it compared with negative control drugs, we said this case as the Mismatched.
Applying CHANCE on TCGA/ICGC cancers
Genetic mutations identified from TCGA and ICGC whole-genome sequencing were downloaded from UCSC Xena (https://xena.ucsc.edu/) or ICGC data portal (https://dcc.icgc.org/). Duplicated samples were removed. We used CHANCE to predict the drug responses of a total of 5,197 TCGA/ICGC tumors to 923 FDA-approved non-oncology drugs (Supplementary Data 11) we collected, for which 149 (16%) of them were included in our training data. Because we could not link any drug with driver mutations in some tumors according to our criteria described above, the number of predictable samples is smaller than the total number of TCGA/ICGC samples. One of the reasons to explain these unpredictable tumors is the lacking of known driver mutations in them.
Experimental validation using ex vivo drug sensitivity assay
Samples were obtained with written informed consent in accordance with the Declaration of Helsinki. This study was approved by hospital ethics committees of Third Xiangya Hospital, Central South University (19203); Hefei Cancer Hospital, Chinese Academy of Sciences (PJ-KY2024-017). The trial of a modified wet suction technique (MEST) was registered at ClinicalTrials.gov (NCT03821974).
We obtained tumors samples from two advanced pancreatic cancer patients in Third Xiangya Hospital using endoscopic ultrasound-guided fine-needle biopsy with MEST. We had shown that MEST can give better quality of specimen than dry suction technique. More details about our criteria for definition of eligible patients can be found in our previous work81. Esophageal cancer samples were obtained from patients who underwent surgical excision in Hefei Cancer Hospital (esophageal cancer).
We used CK7 (Cytokeratin 7) and CK19 (Cytokeratin-19) as positive markers and vimentin as a negative marker to label tumor cells of pancreatic cancer (Supplementary Fig. 6). CK5/6 (Cytokeratin 5/6), p40 (deltaNp63) and p63 were used as positive markers to evaluate the identity for tumor cells of esophageal cancer. (Supplementary Fig. 7).
Tumor samples were transported at 4 °C in tissue storage solution (MACS, 130-100-008) and kept for not more than 72 h. Primary cells were obtained by digestion with digestive enzymes (PRECEDO, # PRS-TDE-2). To obtain enough cells for testing drugs, primary cells were amplified for more than five generation in vitro. Tumor cells were sent for whole-genome sequencing or whole-exome sequencing with DNBSEQ-T7 (MGI). Mutation calling was conducted using Sentieon82 TNseq. Because we have no matched normal samples, we prepared panel-of-normal and gnomAD files to filter germline mutations according to guideline of Sentieon. Other parameters were set as default. Mutations were annotated with ANNOVAR83.
For performing drug sensitivity assay, pancreatic cancer cells were seed and cultured in 384 well opaque culture plates (Nest, 761601) with 4000 cells/well and two compound wells were used for each drug. The cells were then cultured for a 16–18 h. All drugs were dissolved and diluted using DMSO and the control group was treated with only DMSO. Drug treated cells were incubated in a 5% CO2 incubator for 72 h at 3 °C, and then CellCounting-Lite 2.0 Luminescent Cell Viability was added to each well. After 10 min, the fluorescence represented by relative luminescence units (RLU was measured with EnVision flat panel reader (Perlin Elmer Inc., Wellesley, MA, USA). Survival rate for each drug concentration was calculated as survival rate = (RLUDrug-RLUBackground)/(RLUDMSO-RLUBackground). Drug response curves were fitted using AAT Bioquest IC50 Calculator (https://www.aatbio.com/tools/ic50-calculator). And IC50 values were calculated with customed R scripts. A list of abbreviations in this study can be found in Supplementary Data 12.

Responses