Personalized prediction of glycemic responses to food in women with diet-treated gestational diabetes: the role of the gut microbiota
Introduction
Gestational diabetes mellitus (GDM) represents a prevalent condition, impacting a substantial portion, approximately up to 9–26%, of pregnancies1. GDM can lead to pregnancy complications, including but not limited to increased cesarean section rate, birth trauma, nerve palsy, neonatal hypoglycemia in the short-term period2, and increased risks of obesity, type 2 diabetes, and cardiovascular diseases in both mothers and their offspring throughout life3. It is crucial to uphold normal glycemic levels during pregnancy to mitigate adverse pregnancy outcomes and disrupt the cyclical transmission of predisposition to metabolic diseases across generations3,4.
The most common treatment for GDM is diet and lifestyle modification, reportedly effective without adding medications for achieving glucose control in 70–85% of women5. However, according to real-life observations, many women with GDM do not achieve target glucose levels, and the rate of pregnancy complications remains high in women with GDM6.
Nutritional studies and guidelines concerning GDM concentrate on average characteristics across populations5. The historically prevailing approach to predicting postprandial glucose responses (PPGRs) to food involves relying on the carbohydrate content of the meal5, despite evidence suggesting its inadequacy as a predictor7. Alternative methods include the glycemic index, which assesses the postprandial glucose response to a specific food, and the derived glycemic load5. Attributing a singular postprandial glucose response (PPGR) to each food implies that the response is entirely inherent to the food itself. Yet, recent studies exploring interindividual variations in PPGRs have revealed significant variability in how different individuals respond to identical foods7,8. The distinctive PPGRs of an individual were shown to be influenced by their biological traits (such as gut microbiome composition and genetic variation) and lifestyle factors7,8,9.
Several studies integrated gut microbial features into the models predicting PPGRs in healthy individuals7,8 or patients with type 1 diabetes9. However, only a few evaluated the impact of microbiome on the prediction of PPGRs through variance components analyses8 or the SHapley Additive exPlanation (SHAP) method9, and only one study exclusively concentrated on investigating the connections between bacterial species and the host glycemic regulation10. Furthermore, none of these studies directly compared the accuracy metrics of the models before and after the addition of microbial data into the list of the input variables. They compared basic models including carbohydrates and premeal glucose level with a full model including multiple individual parameters apart from microbial features7,8,9.
Moreover, although there is mounting evidence regarding the regulatory functions of the microbiome in normal and impaired glycemic responses among non-pregnant individuals7,8,9,10, limited knowledge exists concerning the microbiome’s impact on PPGRs among pregnant women, both with and without GDM. We have previously developed PPGR prediction models based on multiple individual parameters without microbiome for pregnant women with and without GDM11. The performance of our model in predicting the incremental area under the glucose curve in the 2 h after the meal (iAUC120) (R = 0.7) was comparable to the model created by Zeevy et al. for healthy individuals based on individual parameters and microbiome (R = 0.7)7. However, our past model was inferior to the accuracy of the microbiome-based model subsequently developed by Berry et al. for iAUC120 prediction in healthy individuals (R = 0.77)8, leaving space for the improvement of our model, potentially with the inclusion of microbiome data. Another distinguishing feature of the Berry model, in comparison to both our previous model and the Zeevi model, was the incorporation of genetic factors. This likely enhanced the predictive accuracy, as genetics constituted the second most crucial parameter group after serum glycemic markers, as indicated by the proportion of variance explained (R2)8.
The aim of this study was to develop a prediction model for PPGR in pregnant women, including both those with GDM and normal glucose tolerance, and to explore the impact of microbial data on the model’s performance. An accurate PPGR prediction model holds promise in optimizing personalized diet recommendations to improve glucose control and pregnancy outcomes in women with GDM. Simultaneously, the identification of a distinct gut microbial signature affecting PPGR, a secondary aim of this project, could serve as a basis for the development of potential therapeutic interventions.
Results
In total, 152 participants were recruited for the study. After the exclusion of 3 women who did not provide CGM data, 2 women with antibiotics intake during the study period, 34 women with inaccurate food diaries, 2 women with less than 6 meals left after filtering, and 6 microbiota samples with low read count (<10,000 reads), 105 participants (77 women with GDM and 28 healthy pregnant women) were included in the final analysis (Fig. 1).
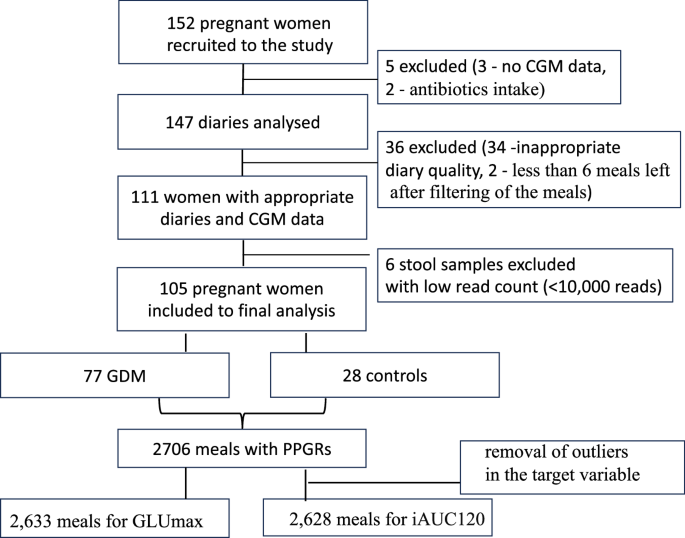
Cohort selection.
The characteristics of the participants are in Table 1. Women with GDM did not differ from the control group in terms of age and gestational age upon initiation of continuous glucose monitoring. Patients with GDM had higher body mass index (BMI) before pregnancy. As expected, healthy pregnant women had lower plasma glucose levels during OGTT and hemoglobin A1C (HbA1C) upon inclusion into the study.
Patients with GDM consumed lower amounts of carbohydrates (28.4 ± 10.9 vs 36.6 ± 10.8 g) and higher amounts of proteins (17.0 ± 5.2 vs 13.8 ± 2.9 g) per meal compared to healthy women (Table 1). Presumably due to this fact, iAUC120 and GLUmax levels did not significantly differ between the groups and even tended to be lower in women with GDM compared to their healthy counterparts who were not dieting (0.52 ± 0.29 vs 0.63 ± 0.28 and 6.2 ± 0.6 vs 6.4 ± 0.6 mmol/L, respectively) (Table 1). For comprehensive details on lifestyle assessments and baseline blood tests, please refer to Supplementary Table S3.
Microbial features in women with higher and lower PPGRs
As there was no difference in the levels of GLUmax and iAUC120 between women with and without GDM during CGM, we combined their data for selection of microbial features associated with higher and lower PPGRs. The medians for iAUC120 and GLUmax in the cohort were 0.527 and 6.254 mmol/L, respectively. Participants with median PPGR indices (iAUC120 or GLUmax, respectively) below these numbers were considered to have lower PPGRs, and those with median PPGR indices equal to or above the cohort median comprised the subgroup with higher PPGRs.
Linear discriminant analysis revealed 18 bacterial taxa exhibiting significantly higher scores in the subgroup of women with higher iAUC120 and 21 bacterial taxa with higher scores in the subgroup with lower iAUC120, p < 0.05 for all (Fig. 2). All bacterial taxa distinguished by LefSe were included as input variables for creation of PPGR prediction models.
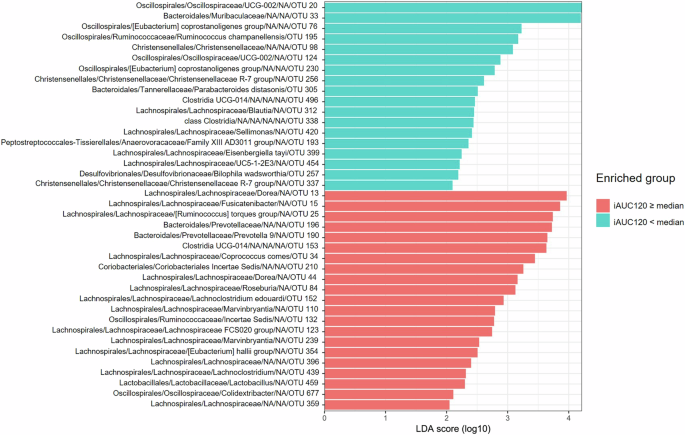
Red indicates higher RA in patients with iAUC120 equal to or above median, and turquoise indicates higher RA in patients with iAUC120 below median, ranked by the effect size.
When comparing women with higher and lower GLUmax, 7 taxa were enriched in the subgroup with higher GLUmax, including Clostridia UCG 014 and “Lachnoclostridium” (Lachnospiraceae), and 8 taxa were enriched in the subgroup with lower GLUmax, including Methanosphaera (Methanobacteria), Lachnospira eligens (basonym: Eubacterium eligens) (Lachnospiraceae), Butyricicoccus faecihominis (Oscillospiraceae), Intestinibacter bartlettii (Clostridia, Peptostreptococcaceae), Sellimonas (Lachnospiraceae), E. tayi (Lachnospiraceae), Christensenellaceae R-7 group (Clostridia) (Fig. 3).
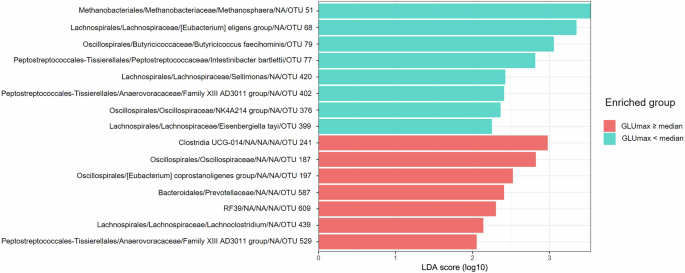
Red indicates higher RA in patients with GLUmax equal to or above median, and turquoise indicates higher RA in patients with GLUmax below median, ranked by the effect size.
Predicting individual postprandial responses
We assessed the overall extent to which different combinations of input variables predict personal postprandial responses: iAUC120 and GLUmax. A total of 750 days of concurrent CGM usage and meal logging resulted in 3514 meals to be analyzed with their PPGRs. Meal filtering (see “Research design and methods: Meal preprocessing”) reduced the dataset to 2706 meals. After the removal of outliers in the target variable, the final dataset comprised 2633 meals with PPGRs for GLUmax prediction model and 2628 meals for iAUC120 prediction. Prediction models for both indices were developed utilizing gradient boosting algorithms, with the following combinations of input variables: (1) only carbohydrate content of the meal (carbs); (2) clinically available parameters (anthropometric, biochemical, lifestyle questionnaire, meal content and meal context, CGM data); (3) model 2 parameters + microbial features (the full model). For the full list of features please see the Supplementary Table 1. Validation of the model was performed using a three-fold cross-validation scheme (see “Research design and methods”).
In the context of predicting GLUmax, the first model that relied solely on the amount of carbohydrates in a meal demonstrated the lowest correlation with PPGRs (R = 0.35) and accounted for only 5% of the variation in glycemic response (Fig. 4a). The second model based on clinically available parameters achieved a significantly higher correlation (R = 0.62) and explained 34% of variance (Fig. 4b). Adding microbiome features (Fig. 4c) further increased the predictive ability with an R of 0.66 and a coefficient of determination of 42%.
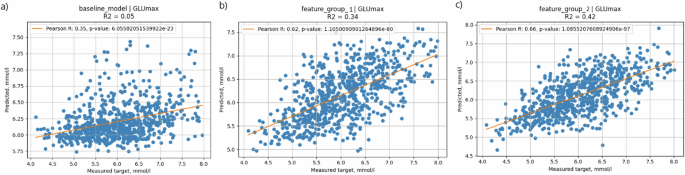
X scale—CGM-measured values, Y scale—predicted values. a Baseline model—solely carbohydrate content of the meal (carbs); b the model based on clinically available parameters (anthropometric, biochemical, lifestyle questionnaire, meal content, meal context, CGM data); c full model—clinically available parameters + microbial features.
Likewise, in the prediction of iAUC120, a model based solely on the carbohydrate content of meals demonstrated a relatively weak correlation (R = 0.51) and explained only 26% of the variation in glycemic response (Fig. 5a). The addition of parameter groups, as described above, resulted in an increase in correlation between CGM-measured and predicted values (R = 0.71, R2 = 0.50). Addition of microbial features to this model slightly increased the accuracy of prediction (R = 0.72, R2 = 0.52) (Fig. 5b, c).
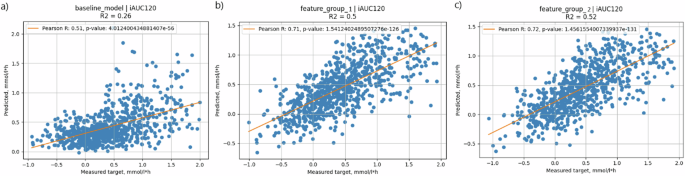
X scale—CGM-measured values, Y scale—predicted values. a Baseline model—solely carbohydrate content of the meal (carbs); b the model based on clinically available parameters (anthropometric, biochemical, lifestyle questionnaire, meal content, meal context, CGM data); c full model—clinically available parameters + microbial features.
Because the performance of a model can also be affected by non-linear relationships between measured and predicted values, we also assessed MAE, MSE and RMSE for the models with higher performance (models 2–3, Table 2). As shown in Table 2, adding microbial features decreased MAE, MSE and RMSE for GLUmax prediction but did not influence these parameters characterizing prediction of iAUC120.
Exploring factors influencing the prediction of postprandial glycemic responses
Following the examination of different models predicting PPGRs, our subsequent focus was on understanding the individual factors influencing prediction accuracy, including microbial features and other parameters comprising the full model. For this purpose, we conducted feature attribution analysis employing SHAP12.
The features that exerted the greatest influence on iAUC120 prediction, as indicated by the highest mean absolute SHAP value, encompassed the carbohydrate content of the meal, glycemic load of the meal, amount of starch in the meal, and CGM-derived parameters characterizing glucose levels preceding the meal (glucose level 10 min before meal and glucose rise from 240 min before the meal to meal start) (Fig. 6a). The most influential parameters for the prediction of GLUmax were the glucose levels at the onset of the meal (GLU0), the carbohydrate content of the meal, glycemic load of the meal, RA of I. bartlettii, and the amount of protein consumed up to 6 h before the meal (Fig. 6b).
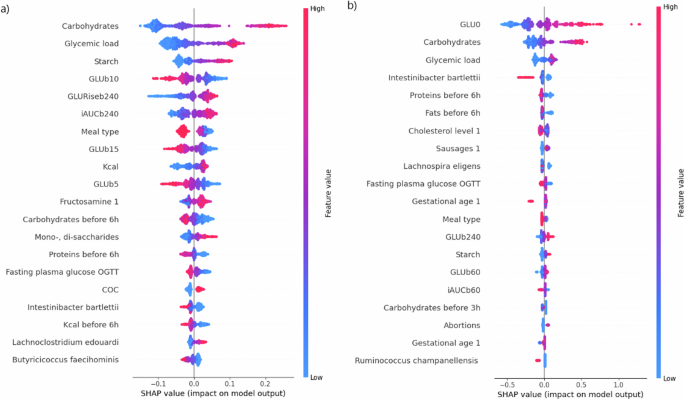
iAUC120 (a) and GLUmax (b) are predicted based on full clinical data with the addition of bacterial features. Higher values of the feature are indicated by colors closer to red, lower values by colors closer to blue. If a point of a certain color is located on the left side of the central axis, the feature has a downward effect on the target variable; if the point is located on the right side, the effect will be the opposite. For example, lower values of GLU0 (the long blue tail on the left of b) correspond to lower values of the target variable (GLUMax). GLUb—glucose level before meal initiation. Numbers near «GLUb» represent the minutes prior to meal initiation in which the measurement was obtained. For example, «GLUb10» represents the glucose level 10 min prior to the meal; Kcal—the energy value of the meal; COC—combined oral contraceptive use any time before pregnancy (1—yes, 0—no); Sausages 1—frequency of consuming sausage products before pregnancy. For a more detailed description of the input features, please refer to Supplementary Table 1.
Among the 20 most influential parameters for the prediction of iAUC120 or GLUmax, the algorithm selected the RA of the following bacterial taxa: I. bartlettii, “L. edouardi”, B. faecihominis (for iAUC120), and I. bartlettii, L. eligens (basonym: Eubacterium eligens), and R. champanellensis (for GLUmax) (Fig. 6a, b). Notably, I. bartlettii ranked fourth among influential parameters for the prediction of GLUmax and was selected by the algorithm among the top parameters both for iAUC120 and for GLUmax prediction.
In order to assess the cumulative influence of microbial composition and other feature groups on the model, we summed the SHAP values of associated features (Fig. 7). These examinations revealed that the meal composition had the most significant effect on prediction of iAUC120, followed by CGM-derived data, meal context, and microbial composition (Fig. 7a). Оn the contrary, for the prediction of GLUmax the main predictor group was the CGM-derived data, followed by meal composition, meal context, and microbial data also taking the fourth place (Fig. 7b).
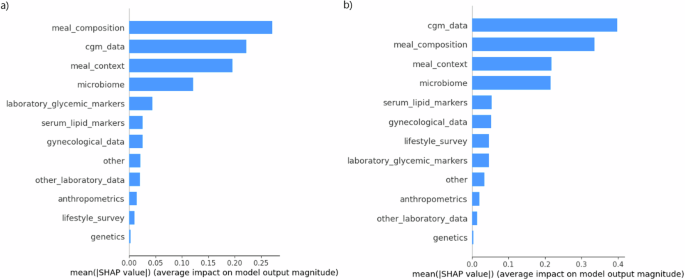
SHAP values (linear scale, absolute values) of the groups of features for the prediction of iAUC120, mmol/L∗h (a) and GLUmax, mmol/L (b). The groups of features are presented as follows: «meal composition» includes the nutritional content of the meal, «cgm_data» includes glucose values obtained from CGM devices; «meal_context» includes the nutritional content of meals consumed up to 12 h prior to the index meal; «Microbiome» includes RA of bacteria detected from stool samples; «genetics» includes rs10830963 and rs1387153 variants in MTNR1B gene. The full description of the parameters included in each feature group is listed in Supplementary Table 1.
Discussion
Recently, a high interpersonal difference in PPGRs was revealed, and the gut microbiota has been shown to be a factor underlying this variability. Furthermore, the gut microbiota has been used to enhance the accuracy of PPGR prediction in healthy volunteers and individuals with type 1 diabetes7,8,9. However, to our knowledge, no study has explored the impact of the gut microbiome on PPGRs in pregnant women with or without GDM.
Pregnancy is characterized by substantial alterations in all types of metabolism as well as by dynamic changes in gut microbial composition13,14,15,16,17. This fact, in line with the importance of achieving target postprandial glucose levels for improved pregnancy outcomes, underscores the importance of comprehensive evaluation of factors underlying PPGRs in pregnant women for the construction of more accurate PPGR prediction models for personalized dietary advice in this specific population.
Our study has shown that microbiome features are among the top 5 most impactful individual parameters on the PPGR prediction in pregnant women with GDM. The cumulative influence of microbial composition was the fourth among the ten most impactful feature groups following CGM-derived data, meal composition and meal context for the prediction of GLUmax and iAUC120. Of note, adding microbiome features increased the predictive ability of the GLUmax model with the increment of the coefficient of determination from 34 to 42%.
However, the addition of microbiome features had a lower impact on the accuracy metrics of iAUC120 prediction than on the metrics of GLUmax. This could be a consequence of relatively high accuracy of iAUC120 prediction even before microbiome addition. The addition of the microbiome had a lower impact on the models than the factors related to the meal (carbohydrates, starch, glycemic load), blood glucose levels at certain time points, and the foods eaten earlier that day (meal context). The relatively modest impact of the microbiome’s addition on the performance of the prognostic models can be attributed to the use of the 16S rRNA gene amplicon sequencing method or may reflect that the contribution of the microbiome to the regulation of the postprandial glucose levels is relatively limited.
The postprandial glycemic predictions in our study (with R = 0.72 for the model predicting iAUC120) closely resembled those documented by Zeevi et al. (with an R value of 0.70) in healthy subjects7. The performance of our models was also superior to that of the models developed by Shilo et al. for patients with type 1 diabetes (R = 0.72 vs 0.59 for iAUC120 prediction and R = 0.66 vs 0.61 for GLUmax prediction)9. Furthermore, Shilo et al. included PPGRs from the same patient in training and validation datasets, while in our study, we separated participants between datasets so PPGRs of a participant from a training dataset could not be analyzed in the test or validation datasets. If Shilo et al. followed the same protocol, the difference in model performance might be even more pronounced. However, type 1 diabetes patients have much greater glucose variability and excursions, thus complicating the task of accurate PPGR prediction in this group of patients.
In the biggest study of PPGRs in healthy individuals, to date, Berry et al. obtained the highest accuracy of iAUC120 prediction with R = 0.75 in the validation cohort8. They likely reached the maximum accuracy which could be anticipated judging by the correlation between PPGRs to repeated standard meals (intraindividual variability) of 0.7–0.77 reported by Zeevi et al.7. A potential reason for the lower performance of our model is almost 10-fold smaller sample size and a lower number of included genetic variants compared to the study by Berry et al.8.
Furthermore, taking into consideration well-known alterations in carbohydrate metabolism during pregnancy, especially in the third trimester13, we suppose that PPGRs may differ in a pregnant vs non-pregnant state. Compared to our previous study on PPGRs prediction without implementing microbiome data11, our current model exhibited only a slight increase of R (0.72 vs 0.7). However, for the previous model, we had a larger dataset (3240 records of meals and corresponding PPGRs) making direct comparisons inappropriate.
Concerning the gut microbiome, our study identified bacterial taxa differentially enriched in pregnant women with higher and lower mean PPGR. According to LefSe analyses, most taxa belong to Lachnospiraceae and Oscillospiraceae, and some families of Bacteroidia. These families are represented by the most functionally active bacteria involved in dietary fiber degradation and short-chain fatty acid (SCFA) biosynthesis18. SCFAs, especially butyrate, are generally considered beneficial metabolites that reduce the risk of GDM. However, excess SCFAs can activate gluconeogenesis, leading to hyperglycemia and insulin resistance19.
Even though, in general, Lachnospiraceae and Oscillospiraceae are considered useful symbionts that interact beneficially with the host, among them, some taxa carry a “dual” function. For example, Anaerobutyricum hallii and some Blautia species, are considered pathobionts that can cause harm to the host19. Further, among the taxa with higher abundance in women with higher iAUC120 or GLUmax, several are of interest for discussion as taxa potentially contributing to GDM pathogenesis. Prevotella 9 is now characterized as the new genus Segatella with the type species Segatella copri (basonym: Prevotella copri). Although S. copri is considered to be associated with health20, a significant positive association between increases in Prevotella 9 and higher GDM risk was identified21, and an increased abundance of Prevotella was reported in GDM patients22. Coprococcus comes is a butyrate producer18, usually considered beneficial. However, in the FINRISK-2002 cohort, the strongest association with higher statin-associated new-onset type 2 diabetes risk was observed for C. comes23, which aligns with our results. A possible explanation for this may be the ability of C. comes to produce the highest butyrate levels18, which can lead to its excess. A. hallii (basonym: Eubacterium hallii) is also associated with health20. However, GDM patients who failed to control glycemic levels were characterized by increased A. hallii24, which corresponds to the results of our study.
In women with lower iAUC120 or GLUmax, some taxa also had higher relative abundance, conversely suggesting a protective effect against higher PPGR. Oscillospiraceae UCG-002, previously Ruminococcaceae UCG-002, was more abundant in the normal glucose tolerance group than in GDM. Previous research found it was reduced in early pregnancy in women with subsequent GDM and was negatively correlated with fasting blood glucose levels25. Oscillospiraceae UCG-002 was also negatively associated with the homeostasis model assessment of insulin resistance (HOMA-IR) index and served as a marker of intestinal phytoestrogen enterolactone production26.
Christensenellaceae R-7 group is a beneficial genus: elevated abundance was associated with reduced visceral adipose tissue and a healthier metabolic profile27,28. Parabacteroides distasonis may protect against inflammation and obesity; however, increased abundance of P. distasonis was previously reported in GDM22. Sellimonas is an acetate producer, associated with a reduced type 2 diabetes risk29 and has been linked to low polycystic ovary syndrome (PCOS) risk30.
Eisenbergiella tayi produces butyrate, lactate, acetate, and succinate and is thought to be potentially beneficial. However, E. tayi was associated with the disease state20. Women who developed GDM showed a significantly higher abundance of Eisenbergiella in early pregnancy, and Eisenbergiella was also positively correlated with fasting blood glucose levels25, which contradicts our results. Bilophila wadsworthia is associated with the metabolism of fatty acid esters of hydroxy fatty acids, which improves glucose homeostasis, stimulates insulin sensitivity, and has anti-inflammatory effects31.
After including bacterial taxa distinguished by LefSe as input variables for the creation of PPGR prediction models, microbiome features were categorized as either advantageous or disadvantageous. As the RA of these taxa increased, the algorithm projected a decrease or increase in postprandial glucose response, respectively. Among bacterial features, the greatest contribution to iAUC120 prediction was made by the RAs of I. bartlettii, B. faecihominis, and “L. edouardi”. The most impactful bacterial features for the prediction of GLUmax were I. bartlettii, R. champanellensis, and L. eligens. A higher abundance of these bacteria was associated with lower PPGRs.
Notably, I. bartlettii was selected by the algorithm both for the prediction of iAUC120 and GLUmax among the top 20 parameters. I. bartlettii can produce indoleacetic and phenylacetic acids, acetate, isovalerate, and isobutyrate. Due to the latter’s production, Intestinibacter might be beneficial to host lipid and glucose metabolism and intestinal barrier integrity, which may explain the inverse association of Intestinibacter with diabetes32.
L. eligens produces butyrate, acetate, and lactate, and promotes the production of the anti-inflammatory cytokine IL-10. L. eligens was reduced in early pregnancy in women with subsequent GDM25. The abundance of L. eligens was significantly higher in the healthy controls than in the obese individuals33. Additionally, L. eligens was positively associated with adherence to a Mediterranean diet34. B. faecihominis is a butyrate producer and was included in the stool-derived microbial ecosystem therapeutics to combat Clostridioides difficile infection as a beneficial bacterium35. R. champanellensis is a cellulose-degrading bacterium36. The strongest association with lower statin-associated new-onset type 2 diabetes risk was observed for R. champanellensis23. “L. edouardi” was associated with an increased risk of GDM21 and heightened type 2 diabetes risk29.
The limitation of our study is a relatively small sample size. Further studies in other cohorts and populations of pregnant women are needed to confirm our findings concerning certain bacterial taxa associated with PPGRs. Another limitation of our study is the inability to confidently classify taxa at the species level which is due to sequencing only part of the 16S rRNA gene. Additionally, the participants of our study were women with GDM treated with diet only and women with normal glucose tolerance during pregnancy. Thus, our model may not be representative of pregnant women with GDM treated with insulin or other pharmacological glucose-lowering agents. Further studies are needed to explore PPRG prediction models for insulin-treated women with GDM.
There is further room for improvement, such as conducting more comprehensive assessments of contextual factors than those employed in the current study. For example, including data on physical activity preceding meals and integrating extensive ‘omics’ data could improve the predictive capacity of these algorithms.
It is essential to delve deeper into understanding the functional roles of bacterial taxa that were the most influential for PPGR prediction in our study. Additionally, circulating SCFA levels should be measured in future studies as this could have conveyed an insight into whether the SCFA actually are the important metabolites for the regulation of blood glucose levels or whether its regulation is modified by other bacterially associated metabolites. The insights gained from this data could pave the way for the future advancement of probiotic or autoprobiotic therapies aimed at enhancing glycemic regulation. Probiotics with metabolic effects that target functionally active bacteria, predominantly belonging to Clostridia and Bacterodia, which play a key role in maintaining the balance of the intestinal microbiota, seem promising37.
Our study highlights the role of the gut microbiota in the interpersonal variability of PPGRs. While previous research extensively utilized microbiota for PPGR prediction in healthy individuals and those with type 1 diabetes, our study fills an important gap by examining its impact on PPGRs in pregnant women, particularly those with GDM.
Our findings indicate that microbiome features rank among the top parameters influencing PPGR prediction in pregnant women with GDM, although the addition of the microbiome has a relatively modest impact on the performance of the prognostic models, especially for iAUC120. Specifically, certain bacterial taxa were identified as significantly associated with variations in PPGRs, highlighting the potential of microbiota-based interventions for optimizing glycemic control which should be validated in future interventional studies.
Research design and methods
Study design
We recruited pregnant women who participated in the randomized controlled trial “Genetic and Epigenetic Mechanisms of Developing Gestational Diabetes Mellitus and its Effects on the Fetus” (GEM-GDM), and consented to be connected to a continuous glucose monitoring (CGM) system (CGMS) for at least 7 days, tracked information on food consumption in a designated mobile app, and provided stool samples. The parent GEM-GDM study aimed to compare different glycemic targets for women with GDM. It was registered at ClinicalTrials.gov (Identifier: NCT03610178), and its design is described elsewhere38. Briefly, gravidas with GDM were randomly assigned into two groups according to their glycemic goals: the first group had strict glycemic goals (<5.1 mmol/L for fasting blood glucose (BG) and <7.0 mmol/L for 1-h postprandial BG), and the second group had less strict glycemic goals (<5.3 mmol/L and <7.8 mmol/L, respectively). For this study, the women from both groups were combined to create the GDM group. GDM was diagnosed using a single-step 75-g OGTT according to the recommendation of the International Association of Diabetes and Pregnancy Study Groups (IADPSG)39.
Apart from women with GDM, we also included healthy pregnant women with normal values of plasma glucose during oral glucose tolerance test (OGTT) (controls).
At study initiation, a physician acquired informed consent, recorded medical history and took anthropometric measurements (weight, height, waist circumference, blood pressure and heart rate). Pregestational body mass index (BMI) was calculated by dividing self-reported pregestational weight (in kilograms) by the square of height (in meters). Blood tests, including fasting plasma glucose, lipid profile and HbA1c, were performed in the Almazov National Medical Research Centre laboratory. Participants filled out questionnaires concerning their lifestyle before and during pregnancy and were then connected to CGMS for 7–14 days during which they tracked information on meal consumption in the proprietary mobile app DiaCompanion, as described elsewhere40,41. The CGM and meal-related data were processed using a previously described algorithm41. The study was approved by the local ethics committee of the Almazov National Medical Research Centre, Russia (protocol no. 119).
Inclusion and exclusion criteria
Participation in this study was optional for participants of the GEM-GDM trial.
The GDM group included pregnant women with GDM and gestational age of ≥24 weeks at the start of CGM. The control group comprised pregnant women with normal glucose tolerance, confirmed by OGTT between 24 and 32 weeks of gestation.
In addition to the inclusion criteria used in the GEM-GDM study, for this particular study, consent to be connected to a CGMS for 7 days and a capability to work with a mobile phone app for the recording of dietary intake in real time were required.
Exclusion criteria included an active inflammatory or neoplastic disease, any known medical condition affecting glucose metabolism (with the exception of GDM), current use of insulin and other medications that could affect glucose metabolism, antibiotic usage 2 months prior to participation in the study, failure to provide a stool sample and submission of inaccurate food diaries through the app. Taking into account that accurate logging is crucial for analysis of PPGRs to food, a set of rules was formulated by the authors to filter negligently filled-in and misreported diaries: (1) more than 50% of the logged meals comprised of a single dish or a single dish with a single beverage; (2) the average amount of logged calories per day was less than 1000 kcal; (3) more than 50% of the logged weights of food items were rounded to the hundreds (excluding beverages); (4) the amount of logged snacks was less than 10% of all meal records11. Participants with misreported diaries were excluded.
Lifestyle questionnaire
The questionnaire comprised several sections covering various aspects: frequency of consuming staple items per week (such as fruits, pastries, skimmed dairy products, legumes, meat, sausage products, dried fruits, fish, whole-grain bread, sauces, vegetables, alcohol, sweet drinks, and coffee), levels of physical activity (daily walking duration categorized as <30 min/day, 30–60 min/day, or >60 min/day; daily frequency of stair climbing categorized as <4 flights/day, 4–16 flights/day, or >16 flights/day; frequency of engaging in sports activities categorized as <2 days/week, 2–3 days/week, or >3 days/week), and smoking habits before and during pregnancy. Each section of the questionnaire was structured in a semi-quantitative manner. This questionnaire has been previously documented41. For the description of the parameters from the lifestyle questionnaire included in the final dataset, please refer to Supplementary Table S1.
Blood samples were collected by a certified nurse after 8–12 h of fasting. The blood panel included measurement of glycosylated hemoglobin (HbA1c%), plasma glucose, total and HDL cholesterol, triglycerides, insulin, and leptin. and fructosamine levels in the central lab of the Almazov National Medical Research Centre. Plasma glucose concentration was determined by the glucose oxidase method in fresh plasma samples. HbA1c was measured in fresh whole blood samples using high-performance liquid chromatography (HPLC) (D10 HbA1c). Blood for genotyping of pregnant women and serum for other biochemical analysis were stored at −80 °C until the analysis. Serum fasting insulin levels were measured using the electrochemiluminescence immunoassay (Roche Diagnostics, GmbH, Germany). The homeostatic model assessment (HOMA) index was calculated using the following formula: fasting serum insulin (m IU/L) × fasting plasma glucose (mmol/L)/(22.5) as an insulin resistance indicator. Total cholesterol, HDL-C, LDL-C, VLDL-C, and triglyceride levels were measured utilizing enzymatic colorimetric methods with diagnostic reagent system designed for the Cobas Integra Autoanalyzer. Fructosamine was measured in the serum using the colorimetric nitro-blue tetrazolium assay (Roche Diagnostics Corporation, Indianapolis, IN) and the Roche cobas c 311 instrument. Serum leptin levels were measured using an enzyme-linked immunosorbent assay (ELISA) as recommended by the manufacturer (Diagnostics Biochem Canada Inc., Canada).
Continuous glucose monitoring (CGM) was conducted using the iPro2TM system from Medtronic, MN, USA. This system utilizes EnliteTM sensors placed subcutaneously to measure interstitial glucose levels. To align CGM readings with blood glucose levels, participants also utilized finger-prick measurements with the Accu Chek Performa from Roche, Germany. Participants were instructed to perform four daily blood glucose measurements. To enhance accuracy, participants were specifically asked to measure blood glucose levels before meals, following recommendations outlined in the iPro2 manual. Calibration of CGM measurements was performed using the CareLink online software from Medtronic, following the guidelines provided in the iPro2 manual.
Food diary tracking was facilitated through our proprietary mobile app DiaCompanion. Each consumed food item was recorded by selecting it from a database created by the authors on the basis of reference books of the Russian Academy of Medical Sciences and the US Department of Agriculture (USDA) Food Composition Databases (Release 28) with the expansion of additional items by certified dietitians. The distinctive feature of this food database, in addition to a wide selection of foods (more than 5500 items), is the presence of glycemic index (GI). Each food item in the database was assigned a dietary GI41. Participants were instructed to meticulously log their daily activities using this platform. They were required to document precise details, including the components and weights of each meal, sleep and wake-up times. Participants were informed of the importance of accurate logging, particularly emphasizing the correct timing of meal logging and accurate recording of food components. Research physicians conducted weekly reviews of each participant’s loggings. Any uncertainties in the logs were addressed directly with the participants.
Meal preprocessing
Before a meal and corresponding PPGR were added to the dataset for model training, the following filters were implemented (mainly to exclude recordings with incorrect timing): (1) a meal followed by a subsequent meal less than 60 min after its start; (2) a meal on the peak of a CGM-curve: an increase in glucose levels by more than 1 mmol/L during an hour preceding the index meal; (3) a meal on the falling edge of a CGM peak; and (4) a meal with inadequately low PPGR (iAUC120 ≤ 0.3 mmol/L∗h) to a considerable amount of carbohydrates (>40 g)11. Glucose level at baseline was considered as the lowest glucose value within ±15 min from self-reporting of the meal in the app.
DNA and genotyping of blood samples
Genomic DNA was extracted from blood samples using the FlexiGene DNA Kit from Qiagen (Hilden, Germany). Genotyping of the following variants: HKDC1 (rs10762264), MTNR1B (rs10830963 and rs1387153), GCK (rs1799884), KCNJ11 (rs5219), IGF2BP2 (rs4402960), TCF7L2 (rs7903146), CDKAL1 (rs7754840), FTO (rs9939609), and IRS1 (rs1801278), was conducted through real-time PCR utilizing custom kits from Applied Biosystems, based in the USA. The procedures recommended by the manufacturer were followed meticulously. Each primer tube contained a concentrated mixture of SNP Genotyping Assay Mix, comprising polymorphism-specific direct and reverse primers, along with two TaqMan MGB probes: one tagged with VIC dye for allele 1 identification and the other tagged with FAM dye for allele 2 identification. Following replication of 10% of the samples, the discordance rate was determined to be less than 0.1%.
Microbiome: DNA extraction
DNA was extracted from all collected samples using the PowerSoil DNA Isolation Kit (MO BIO, Carlsbad, CA, USA) according to the manufacturer’s instructions and following a 2 min bead beating step (BioSpec, Bartlesville, OK, USA). Next, the variable V4 region was PCR-amplified using the 515F and 806R barcoded primers following the Earth Microbiome Project protocol42. Each PCR reaction contained 25 µL with ~40 ng/µL of DNA, 2 μL 515F (forward, 10 μM) primer, 2 μL 806R (reverse, 10 μM) primer, and 25 µL PrimeSTAR Max PCR Readymix (Takara, Mountain View, CA, USA). PCR conditions were as follows: 30 cycles of denaturation at 98 °C for 10 s, annealing at 55 °C for 5 s, and extension at 72 °C for 20 s, followed by a final elongation at 72 °C for 1 min. Amplicons were purified using AMPure magnetic beads (Beckman Coulter, Indianapolis, IN, USA) and quantified using the Picogreen dsDNA quantitation kit (Thermofisher, Waltham, MA, USA). Equimolar amounts of DNA from individual samples were pooled and sequenced using the Illumina MiSeq platform at the Genomic Center at the Bar-Ilan University, Azrieli Faculty of Medicine. Appropriate negative and positive controls were included at all stages of analysis.
Bioinformatics and microbiome analysis
The quality of raw reads was assessed with FastQC v. 0.11.943 and MultiQC v. 1.1444. Reads were trimmed and filtered with Trimmomatic v. 0.3945 (SE -phred 33 HEADCROP 31 ILLUMINACLIP:2:30:10 SLIDINGWINDOW:4:15 MINLEN:150). The remaining reads were processed with the DADA2 pipeline v. 3.6.2.46, including additional trimming, denoising, and error correction. The derived sequences – amplicon sequence variants (ASVs) were clustered using MMseqs2 v. 13.4511147 (identity 99%, coverage 80%). The resultant representative sequences were treated as operative taxonomic units (OTUs). We clustered ASVs to OTUs to reduce the number of sequencing errors inherent in ASVs and avoid false diversity. The OTUs were returned to DADA2 for taxonomy assignment with SILVA SSU database v.138.148. Sequences classified as eukaryotes were removed. Only samples containing more than 10,000 reads were used for downstream analysis. The bioinformatics analysis was conducted using R packages. Permutational multivariate analysis of variance (PERMANOVA) was performed with vegan v2.6.449. PCoA (Principal coordinates analysis) and alpha-diversity were performed with phyloseq v1.42.050 and ggplot2 v. 3.3.6 (https://github.com/tidyverse/ggplot2). Linear discriminant analysis Effect Size (LefSe) was conducted using microbiomeMarker v1.4.051 with default parameters.
Models for the prediction of postprandial glucose response
We used two measures of PPGR characteristics: iAUC1207 and the peak glucose level within 120 min after the meal start (GLUmax, mmol/L). The latter indicator was chosen because the recommended timing of blood glucose self-monitoring for pregnant women is established in the time interval when glycemic levels are highest. The peak glycemic level in pregnant women with diabetes mellitus is reached 45–75 min after a meal, which is the reason for the recommendation to measure glycemia 1 h after a meal52. However, the peak blood glucose (BG) level is less sensitive to inaccurate logging of meal start time than 1-hr postprandial BG.
Outliers in the target variable were removed using Tukey’s Interquartile Range method53 resulting in the final dataset of 2633 meals with PPGRs for GLUmax prediction model and 2628 meals for iAUC120 prediction.
We used the gradient boosting algorithm LightGBM54 to predict both indices and improved its performance with Optuna hyperparameter optimization55.
Within Optuna, we adopted the Tree-structured Parzen Estimator (TPESampler) for sampling within the hyperparameter space, and the Asynchronous Successive Halving Algorithm (SuccessiveHalvingPruner) was implemented to eliminate underperforming trials efficiently. The optimal configuration of hyperparameters that emerged from our analysis included a “num_boost_round” of 4700, a “learning_rate” of 0.0015, “max_depth” of 11, “num_leaves” of 30, “min_sum_hessian_in_leaf” at 0.12, “bagging_fraction” of 0.55, “bagging_freq” of 10, “feature_fraction” of 0.4, “lambda_l1” at 0.006 and “lambda_l2” at 0.007. The data was divided into training and test sets with a ratio of 70:30, ensuring that records from the same patient were only included in one set to prevent data leakage and potential bias in performance metrics. To enhance the robustness of the training process, we employed 3-fold cross-validation.
The final metrics, including mean absolute error (MAE), mean squared error (MSE), root mean squared error (RMSE), Pearson’s correlation coefficient (R), and the coefficient of determination (R2), were calculated on the held-out test sample in the Python scikit-learn library.
Other statistical analyses
To describe the patients in our data frame, we employed the bootstrap hypothesis test56. The main idea behind this method is to repeatedly draw random subsamples of the data with replacement in order to estimate the distribution of the test statistic and make decisions about the significance of differences. The bootstrap test does not require any assumptions about the underlying distribution of the original data, making it more robust compared to parametric tests such as the t-test.
Feature selection and evaluation of input parameters
We selected 164 features as model inputs, including features characterizing meal content, anthropometric measures, gynecological data, blood test results, CGM-derived features, lifestyle questionnaire data, and genetic and microbiome features (Supplementary Table S1).
In order to avoid model overfitting, we used several approaches to decrease the number of input variables. From the original lifestyle questionnaire characterizing the consumption of certain product groups and physical activity, described elsewhere11,57, we selected the parameters with significant Spearman correlations with iAUC120 and/or GLUmax (Supplementary Table S2).
Microbial features were selected based on the results of LefSe analysis. For this purpose, all participants were divided into two groups based on the average levels of PPGR indices: group 1—below the median and group 2—equal or above the median for the group. The relative abundances (RA) of bacterial taxa differentially enriched in these groups were used as input variables.
Among genetic factors, we selected rs10830963 and rs1387153 variants in MTNR1B previously shown by our group to be associated with the results of OGTT in pregnant women57.
SHAP methods were utilized for enhancing model interpretability12. SHAP values were computed in two ways. First, calculations were made individually for each feature to denote the average alteration in the model’s output when conditioning on that specific feature. Second, the additive nature of SHAP values was employed to assess the impact of various feature groups on the model.
Responses