PGRMC2 is a pressure-volume regulator critical for myocardial responses to stress in mice
Introduction
Heart disease is the leading cause of death worldwide. The heart has different steroid receptors, including progesterone receptors1,2. Progesterone receptors are classified into nuclear and membrane-bound receptor families. Nuclear family receptor is a classical slow-acting response that consists of genomic pathways, whereas membrane-bound family receptor involves a rapid-acting response where changes in gene expression are not involved2,3. Unlike the nuclear progesterone receptor, the roles of membrane progesterone receptors are less defined, especially in the cardiac muscles. In general, membrane-associated progesterone receptors are believed to mediate a rapid cellular effect, such as intracellular calcium mobilization4.
Our most recent unbiased proteomic studies indicate a potential association between the progesterone receptor membrane-bound component-2 (PGRMC2) and pericardiac effusion, as well as an increased heart rate in zebrafish5. PGRMC2 is expressed in the hearts of porcine and zebrafish5,6. However, its expression, role and function in human and mouse hearts remain unknown. Steroid hormones are known to regulate cardiac functions by modulating intracellular calcium level3,7.
Cardiac stressors can modulate steroid receptor activity and affect cardiomyocyte function8,9. In response to chronic hypoxia, the heart undergoes various functional adaptations, exhibiting adjustments aimed at maintaining homeostasis. These adaptations are crucial for protecting the right and left ventricles under conditions that demand increased workload10. Previous studies have demonstrated that exercise and hypoxia modulate steroid receptor activation, which in turn regulates cardiac functions9,11.
It is generally recognized that chronic hypoxic stress induces pulmonary hypertension (PAH), increasing right ventricular (RV) afterload12,13,14. To gain a better understanding of the role of PGRMC2 in heart function, we generated a heart-specific knockout of Pgrmc2 mice and exposed them to normobaric hypoxic stress in a controlled chamber for 6 weeks. Here we show that PGRMC2 is an essential mediator of steroid hormone signaling in regulating myocardial Ca²+ homeostasis and in providing cardioprotective effects. These cardioprotective effects became more important under hypoxic condition to preserve normal cardiac contractility and function.
Results
PGRMC2 is expressed in human and mouse heart tissues
We used human cardiac tissues to investigate the expression of PGRMC2 in the hearts (Supplementary Fig. 1a). Our immunohistochemistry (IHC) data provide evidence for the presence of PGRMC2 in autopsy samples from human subjects with or without heart failure (HF). These IHC data revealed a distinct PGRMC2 level, showing a higher PGRMC2 in the HF compared to the non-HF autopsy samples (Supplementary Fig. 1b). HF was determined based on the gross anatomy of the left ventricle hypertrophy and prior medical records of the patients. This indicates that PGRMC2 is relevant toward heart diseases in human.
To further validate the importance of PGRMC2 in the heart, we used a MyH6Cre heart specific PGRMC2 mouse model (Pgrmc2WT/flox) and verified the transgenic knockout via genotyping (Supplementary Fig. 1c, d). Henceforth, MyH6Cre•Pgrmc2WT/WT mice are denoted as wild-type (WT) and MyH6Cre•Pgrmc2flox/flox as knockout (KO). To further verify the KO mouse model, we conducted IHC (Fig. 1a) and Western blot (Fig. 1b, c). To validate the heart-specificity of the KO mouse model, PGRMC2 expressions were verified in the heart and kidney tissues (Supplementary Fig. 1e). In the KO mice, PGRMC2 was not expressed in the heart but was expressed in the kidney. The expression of PGRMC2 was also studied with immunostaining in the cardiac tissues; PGRMC2 was detected in WT but not in KO cardiac myocytes (Supplementary Fig. 1f). These additional analyses further solidified the selectivity of our gene silencing approach and its specificity to the heart.
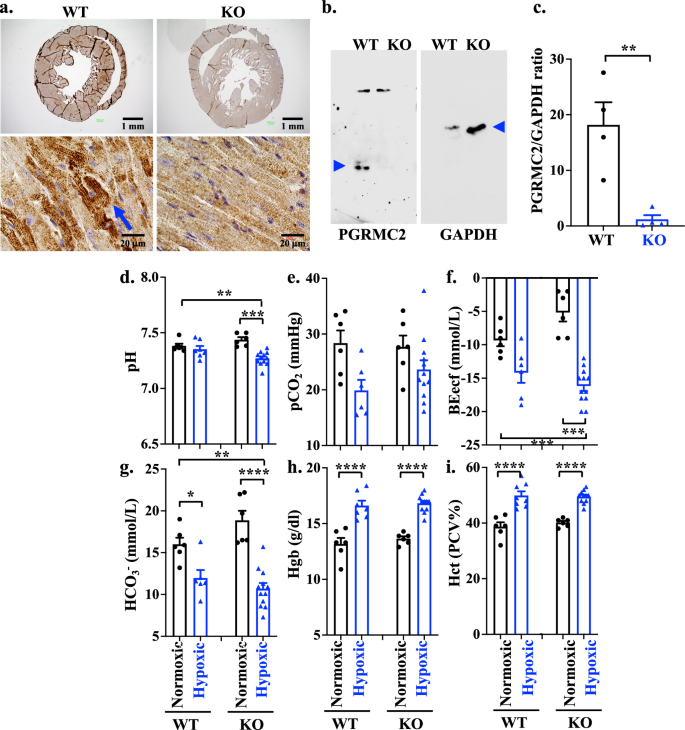
a IHC staining of PGRMC2 receptor in heart tissues of WT and KO mouse models. b Western Blot analyses of PGRMC2 and GAPDH in heart tissues of WT and KO mouse models (blue arrow heads). c Quantification of PGRMC2 expressions in heart tissues of WT and KO mouse models using two-tailed t-test. The protein expression of PGRMC2 was normalized with the GAPDH of the corresponding samples (n = 4 each; p = 0.0064). Blood gas analyses of pH (d; p = 0.0084 & 0.0006), pCO2 (e), BEecf (f; p = 0.0004 & 0.0005), and HCO3 (g; p = 0.0309, 0.0007 & <0.0001) were measured in WT and KO of normoxic or hypoxic mouse models. Blood hemoglobin (Hgb; h; p < 0.0001) and hematocrit (Hct; i; p < 0.0001) concentrations were also measured using i-STAT CG8+ cartridge. n = 6-12 for all data sets, n represents the number of mice. Statistical analysis of blood test is based on one-way ANOVA multiple comparisons, followed by Tukey’s post-hoc. Statistical significance between different groups is indicated in the graph with asterisk (*); data are presented as mean values ± SEM. Source data are provided in a Source Data file.
Cardiac PGRMC2 is required for acid base homeostasis
Chronic respiratory alkalosis due to hypoxia can initiate a compensatory metabolic renal acidosis. In the presence of heart failure, however, it has been postulated that a compromised systemic perfusion and renal hypoperfusion can result in a low blood pH and metabolic acidosis15,16. To understand the roles of PGRMC2 in heart failure, KO mice were therefore subjected to hypoxia stress condition with 10% oxygen as compared to normoxia with 21% oxygen. After a 6 week exposure period, mice were removed from the hypoxic chamber, and venous blood gas (VBG) analyses were conducted to assess the responses of WT and KO mice under normoxic and hypoxic conditions (Fig. 1d–g). Our results indicated a significantly lower blood pH in KO hypoxic mouse model compared to the KO normoxic group (Fig. 1d) with no significant change in CO2 blood level (Fig. 1e). The observed reduction in blood pH had an important impact biologically17,18, as evidenced by a subsequent significant reduction in base excess levels (Fig. 1f) and bicarbonate concentration (Fig. 1g). These findings indicate that KO hypoxic mice were experiencing metabolic acidosis. The blood creatinine tests were within the normal range in all groups.
Considering that hypoxia induces a polycythemic responses, resulting in elevated levels of blood hemoglobin (Hgb) and hematocrit (Hct)19, we evaluated these parameters. The results indicated that both Hgb (Fig. 1h) and Hct (Fig. 1i) levels increased in hypoxic compared to normoxic mice, but there was no statistically significant difference observed between the WT and KO groups. We further investigated if sex played an important role in acid-base homeostasis (Supplementary Fig. 2). Our analysis did not reveal any statistically significant differences in the blood gas parameters as well as Hgb and Hct levels between the male and female mice. Taken together, our data suggested that while both WT and KO mice were still responsive to hypoxia, only KO mice failed to regulate the low blood pH during hypoxia regardless of sex.
Cardiac PGRMC2 has important roles in heart remodeling and electrical propagation
Clinically speaking, electrocardiogram (ECG) is the simplest and most common way to evaluate the heart functions. The ECG was thus performed to evaluate the role of cardiac PGRMC2 in cardiac electrical activity, rate, and rhythm. The ECG morphology in mice differs from that in humans. Mice typically exhibit a J wave at the termination of the QRS complex, which corresponds to the early repolarization wave and happens due to high heart rate characteristic of mice20,21,22. In mice, ventricular repolarization occurs in a gradual manner with the absence of a distinct positive T wave. The duration of the QT interval in mice is defined as the time interval between the onset of the QRS complex and the return of the ECG waveform to the isoelectric baseline23.
Although there were no differences in the heart rates between WT and KO, the ECGs in KO mice during hypoxia stress showed a prolonged J wave which was attributed to the extended repolarization in the left ventricle (Fig. 2a). This abnormality was observed in both sexes in KO mice (Supplementary Fig. 3). Cardiac remodeling can induce alteration in the electrical conduction, ultimately resulting in a prolonged repolarization and alteration in the ECG. Therefore, we examined cardiac structural changes in the KO hearts. The gross anatomical observation showed the dimensional enlargement of the hearts in the KO mice during hypoxia (Fig. 2b), but it was not significantly different between WT and KO in the heart weight (Fig. 2c) or heart-to-body weight ratio (Fig. 2d). However, the heart-to-body ratio was higher in female than male KO hearts due to lower body weights in females (Supplementary Fig. 4a, b). Further pathological analyses showed the presence of interstitial fibrosis in KO hypoxic hearts with a notably higher prevalence observed in both the right ventricle (RV) and left ventricle (LV) cohorts (Fig. 2e–g; Supplementary Fig. 4c, d). It is interesting that RV and LV thickness remained statistically unchanged in the KO compared to WT hearts (Fig. 2h, i). However, both RV and LV inner circumferences were significantly increased in the KO than WT hypoxic hearts (Figs. 2j, k); these increases were consistent across both male and female subjects with a significant higher LV fibrosis and thickness in males compared to females in KO hypoxic cohort (Supplementary Fig. 5). Of note is that hypoxia did not change the expression and cellular localization of PGRMC2 in cardiomyocytes (Supplementary Fig. 6). Based on these results, we could reasonably conclude that the presence of dilated and fibrotic cardiac tissues could promote the J wave abnormalities in the electric propagation within the hearts.
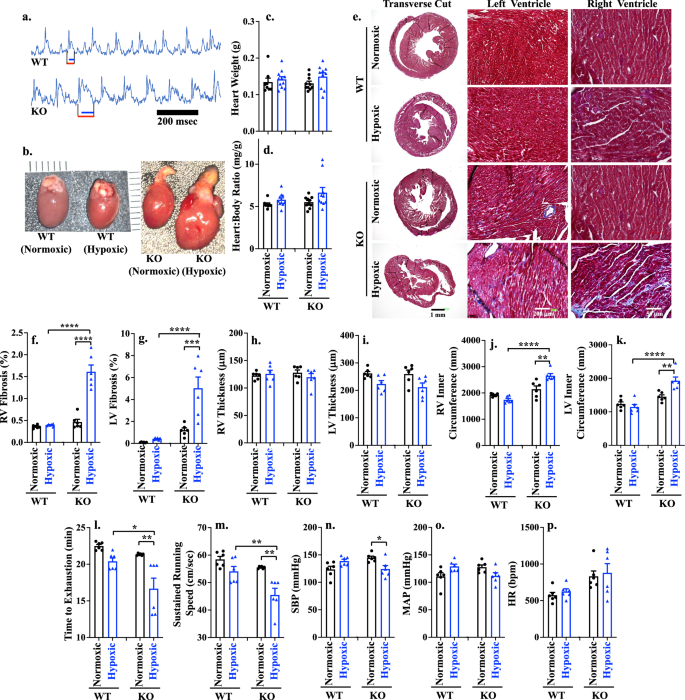
a Electrocardiogram of WT and KO hypoxic mouse models. Red and blue lines indicated QT interval and J-wave, respectively; n = 6 for each group. b Comparison of gross heart anatomy between WT vs KO of normoxic/hypoxic mouse model. c, d Heart weight and heart-to-body weight ratio after hypoxia exposure in all four groups at 18 weeks-old; n = 8-11. e Masson’s trichrome staining of heart tissue in WT and KO of normoxic or hypoxic mouse model. f–k Right ventricle (RV) fibrosis (f; p < 0.0001), left ventricle (LV) fibrosis (g; p = 0.0002, <0.0001), RV thickness (h), LV thickness (i), RV inner circumference (j; p = 0.0011 & <0.0001), LV inner circumference (k; p = 0.0025, <0.0001) were measured. Exercise capacity (l; p = 0.0017, 0.0065) and sustained running speed, (m; p = 0.0015, 0.0015) were measured using Exer 3/6 treadmill. Systolic blood pressure (SBP; n; p = 0.035), mean arterial pressure (MAP; o) and heart rate (HR; p) were measured using tail cuff. n(ge)6 for all data sets, n represents the number of mice. Statistical analysis is based on one-way ANOVA multiple comparisons, followed by Tukey’s post-hoc. Statistical significance between different groups is indicated in the graph with asterisk (*); data are presented as mean values ± SEM. Source data are provided in a Source Data file.
Cardiac PGRMC2 is required to maintain exercise capacity and blood pressure during hypoxic stress
Cardiac exercise tests such as treadmill were employed to evaluate the impact of heart fibrosis and dilation on cardiac functions. This test can detect any potential cardiovascular impairments that may not be apparent at resting condition24. Since there are no prior investigations of PGRMC2 role on the cardiac function, we assessed the physiological response of cardiac PGRMC2 to physical activity. Our data demonstrated that KO hypoxic mice exhibited a significantly shorter time to exhaustion (Fig. 2l) and could not maintain maximum running speed (Fig. 2m) compared to WT mice. While the WT female mice significantly exhausted faster and could not maintain running speed compared to WT male groups, this pattern was reversed in the KO model (Supplementary Fig. 7a, b). In KO hypoxic mice, male compared to female mice exhausted faster with a slower running speed. This difference could be related to higher percentage of fibrotic tissue in the hearts of hypoxic KO male compared to female mice (Supplementary Fig. 5). Nonetheless, the KO mice had a significantly lower exercise capacity compared to WT mice during hypoxia (Fig. 2l, m). Overall, our data indicated that cardiac PGRMC2 was required for exercise activity during hypoxia.
Advanced heart failure can be associated with a reduced systolic blood pressure (SBP), which is due to myocardial failure and insufficient cardiac output25,26. Blood pressure was therefore studied to examine the role of cardiac PGRMC2 in maintaining normal blood pressure levels. Our data uncovered a significant reduction in SBP in the KO hypoxic mice, compared to the KO normoxic group (Fig. 2n). This contrasted with WT mice where SBP was increased to support blood perfusion during hypoxia. In this study, we did not observe any significant differences in the mean arterial pressure (Fig. 2o) or heart rate (Fig. 2p) between the WT and KO mice. There were also no differences between different sexes (Supplementary Fig. 7c–e). The reduced exercise capacity, combined with a decreased SBP, suggested that cardiac PGRMC2 was required in maintaining proper heart function during hypoxic conditions.
Cardiac PGRMC2 is required for right ventricular adaptation to hypoxia stress
Hypoxia stress affecting pulmonary vasculature leads to pulmonary hypertension and increased afterload in the right ventricle, potentially resulting in right heart failure12. Through our pathology analyses of lung tissue, we observed various forms of pulmonary vascular constriction, proliferative and occlusive remodeling, including various degrees of neointimal thickening, medial wall hypertrophy, and plexiform lesions, which is a hallmark for severe PAH in hypoxic KO model (Fig. 3a; Supplementary Fig. 8a). These pulmonary pathologies have been reported in the KO hypoxia model with cardiac remodeling and dysfunctions27,28.
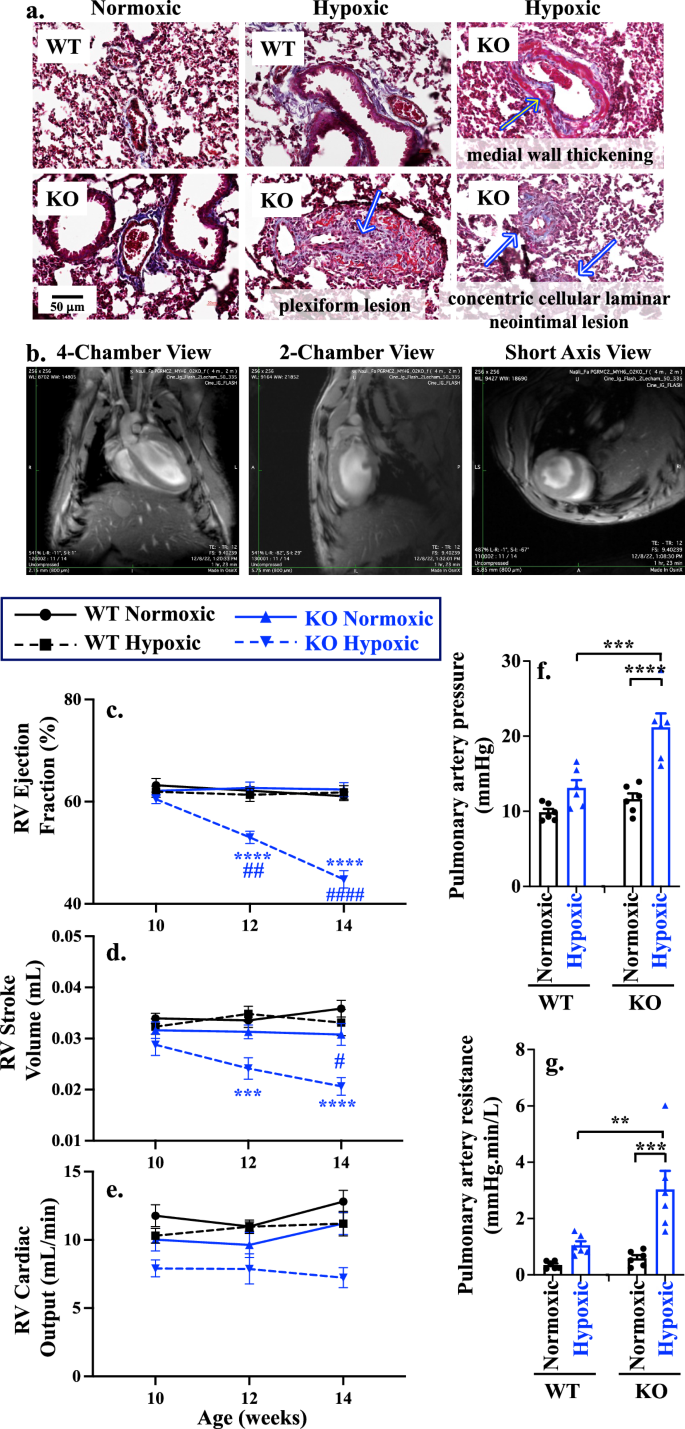
a Masson’s trichrome staining of pulmonary vascular remodeling and lesions of WT and KO of normoxic or hypoxic mouse models. Arrows indicated pathology associated with medial wall thickening, plexiform lesion, and concentric cellular laminar neointimal lesion. b Different views of cardiac magnetic resonance (CMR). c–e Statistical significance between WT and KO is indicated with black (*) and blue (*) asterisks for normoxic and hypoxic, respectively. Longitudinal comparison to the 10 weeks age of the corresponding groups is shown in black (#) and blue (#) hashtag in WT and KO, respectively. RV Ejection fraction (c; p = 0.0025, <0.0001 for the rest), RV stroke volume (d; p = 0.027, 0.0004, <0.0001), and RV cardiac output (e; p = 0.0007) were measured with CMR at 10-, 12-, and 14 weeks old WT and KO of normoxic or hypoxic mouse models. f, g Statistical significance between WT and KO normoxic is indicated with black asterisk (*); Statistical significance between WT and KO hypoxic is indicated with blue asterisk (*); longitudinal comparison to the 10 weeks age of the corresponding groups is shown in hashtag (#). Comparison of pulmonary artery pressure (f; p = 0.0004, <0.0001), and pulmonary artery resistance (g; p = 0.0028, 0.0003) between WT vs KO of normoxic/hypoxic mouse model. n = 6 for all data sets; n represents the number of mice. Statistical analysis is based on two-way ANOVA (heart function) and one-way ANOVA (pulmonart artey pressure and resistance) multiple comparisons, followed by Tukey’s post-hoc. Data are presented as mean values ± SEM. Source data are provided in a Source Data file.
Cardiac magnetic resonance (CMR) imaging is a non-invasive diagnostic technique to assess cardiac structural and functional parameters. As cardiac PGRMC2 is essential for proper heart function, we decided to examine the mechanism by which cardiac PGRMC2 altered heart functions using CMR imaging at different views (Fig. 3b; Supplementary Fig. 8b, c; Supplementary Movie 1). It is well known that chronic hypoxia induces pulmonary arterial hypertension by causing vasoconstriction in the pulmonary vasculature, which in turn increases right ventricular afterload12,13,14.
To evaluate our hypothesis that PGRMC2 KO hearts with PAH were unable to overcome hypoxia stress, leading to right heart failure, we longitudinally assessed RV function at 10, 12, and 14 weeks of age (Fig. 3c–e; Supplementary Table 1). The end-diastolic volume (EDV) and the end-systolic volume (ESV) in RV were measured. The RVEDV is an indicator for cardiac compliance to measure optimal blood filling during diastole, and the RVESV measures the amount of blood volume remaining in the ventricle at the end of contraction to evaluate the ability of RV to pump blood into pulmonary artery. The elevation of RVESV was observed during hypoxia in the KO model, but RVEDV decreased in hypoxic KO mice (Supplementary Table 1), especially in the male group (Supplementary Table 2). Further, we measured the RV ejection fraction (EF, Fig. 3c), stroke volume (SV, Fig. 3d), and cardiac output (CO, Fig. 3e). Our results indicate that only the KO hypoxic cohort was experiencing reductions in EF, SV, and CO with no functional changes observed between males and females (Supplementary Fig. 9a–c; Supplementary Table 2).
To understand the mechanism of elevated RVESV and reduced RVEDV, we looked at pulmonary artery pressure (PAP) and pulmonary artery resistance (PAR), as previously described29,30. In both sexes, PAP (Fig. 3f) was significantly increased in KO hypoxic compared to WT hypoxic mice due to a pulmonary vasoconstriction and an increase in PAR (Fig. 3g). There was a significant increase in PAP and PAR in female hypoxic compared to male hypoxic mice (Supplementary Fig. 9d, e). This indicated that abnormal RVESV and RVEDV were attributed to elevated afterload, RV fibrosis and stiffness leading to reduced RV contractility and increased difficulty in pumping the blood into the pulmonary artery. Overall, our data indicate that the KO hypoxic mouse model exhibited RV functional failure due to increase PAH and afterload (PAR and PAP).
Cardiac PGRMC2 is required to prevent congestive heart failure
Because RV failure (maladaptation to hypoxia) can result from LV failure31, we next evaluated LV functions in both normoxic and hypoxic hearts using CMR. The LV was evaluated longitudinally at the ages of 10, 12, and 14 weeks old (Supplementary Table 3). Our CMR imaging demonstrates that while LVESV was already elevated significantly in normoxic KO mice, this elevation was further increased during hypoxia compared to WT hearts. Additionally, there was an increasing trend in ESV observed in both sexes (Supplementary Table 4). We observed no significant changes in LVEDV (Supplementary Tables 3 and 4).
To investigate the mechanisms underlying the effect of PGRMC2 on LVESV, we measured all three systolic functional parameters of ejection fraction (EF, Fig. 4a), stroke volume (SV, Fig. 4b), and cardiac output (CO, Fig. 4c). Our findings revealed a reduction of EF in KO during normoxia and all systolic parameters during hypoxia – compared to the corresponding WT (Fig. 4a–c). We also evaluated the LV functions between different sexes (Supplementary Fig. 10a–c). Both male and female KO exhibited decreasing trends in ejection fraction, compared to WT during normoxia (Supplementary Table 4). Consistent with our histopathological data on the LV thickness (Fig. 2i), there was no differences in the LV thickness between WT and KO hearts when measured with the short-axis CMR (Fig. 4d). Furthermore, no sex-specific variation in the LV thickness was observed (Supplementary Fig. 10d). Together, our data indicated that cardiac PGRMC2 regulates LVESV via cardiac contractility and systolic function.
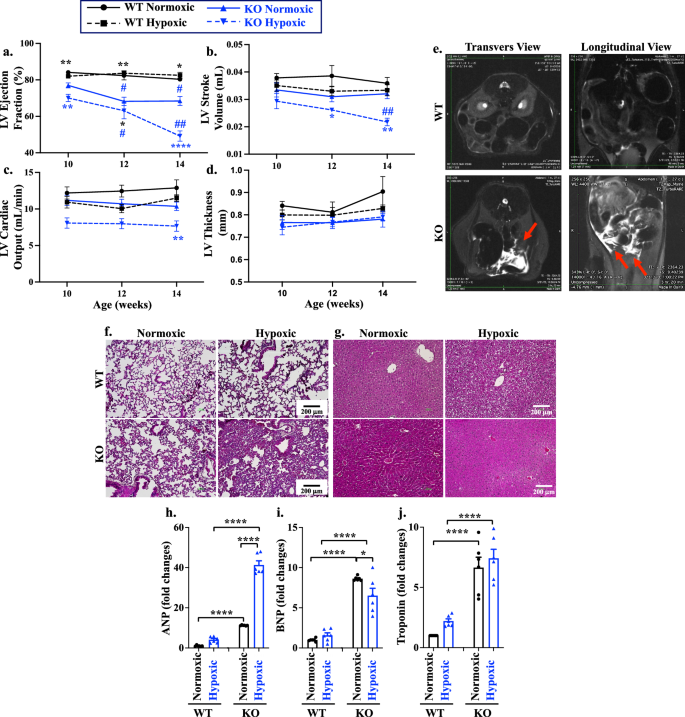
a–d Statistical significance between WT and KO is indicated with black (*) and blue (*) asterisks for normoxic and hypoxic, respectively. Longitudinal comparison to the 10 weeks age of the corresponding groups is shown in black (#) and blue (#) hashtag in WT and KO, respectively. LV ejection fraction (a; p = 0.014, 0.045, 0.0048, 0.0078, 0.0078, <0.0001 for asterisk; p = 0.0272, 0.0250, 0.0138, 0.0084 for hashtag), stroke volume (b; p = 0.0290, 0.0084, 0.0053), cardiac output (c; p = 0.0071), and thickness (d), were measured with CMR at 10-, 12-, and 14 weeks old of WT and KO of normoxic or hypoxic mouse models. e Abdominal transverse and longitudinal planes of the WT and KO were taken from T2 Weighted TurboRARE MRI imaging, which was used to examine free abdominal fluid (red arrows). f, g Masson’s trichrome staining of lung (f) and liver (g) tissues from female mice to indicate the alveolar wall thickness and hyperemic liver. Male mice can be found in Supplementary Fig. 11c, d, h– j. Atrial natriuretic peptide (ANP; h; p < 0.0001), brain natriuretic peptide (BNP; i; p = 0.045, <0.0001), and cardiac troponin-I (cTnI; j; p < 0.0001) at 14 weeks old were analyzed with quantitative PCR. n = 6 for all data sets; n represents the number of mice. Statistical analysis is based on two-way ANOVA (heart functions) and one-way ANOVA (biomarkers) multiple comparisons, followed by Tukey’s post-hoc. Statistical significance between different groups is indicated in the graphs with asterisk (*) and hashtag (#); data are presented as mean values ± SEM. Source data are provided in a Source Data file.
It is known that hypoxia typically results in weight reduction32. However, a significant increase in body weight was observed in the KO mice during hypoxia (Supplementary Fig. 11). The increased body weight accompanied by a decreased in the systolic functions in both RV and LV (Supplementary Tables 1–4) prompted us to examine a potential congestive heart failure (CHF), which potentially could be characterized by the free abdominal fluid. The abdominal magnetic resonance imaging (MRI) confirmed the presence of abdominal free fluid, known as ascites, in the KO mice during hypoxia (Fig. 4e; Supplementary Fig. 12a, b). Based on these findings, it was reasonable to speculate that ascites could be resulted from CHF, leading to venous system expansion and serum infiltration into the abdominal cavity33,34. Subsequently, we evaluated the congestion in other organs (Supplementary Fig.12c, d). Congestion was observed in the lung (associated with the LV congestion; Fig. 4f) and liver (associated with the right ventricle congestion; Fig. 4g). Pulmonary and portal congestion were apparent during hypoxia in KO mice as evidenced by the thickening of the alveolar wall due to lung edema, as well as portal sinusoidal and central vein congestion in the liver. Taken together, these findings led to the conclusion that the KO hypoxic hearts were experiencing both left and right heart congestion. It is reasonable to speculate that the observed cardiac dysfunction from the MRI results, along with increased body weight due to fluid retention in the KO mice during hypoxia, was associated with reduced exercise capacity and SBP due to CHF.
To validate our clinical (i.e., exercise test, SBP, and ECG) and paraclinical (i.e., MRI) findings, we analyzed atrial natriuretic peptide (ANP; Fig. 4h), B-type natriuretic peptide (BNP; Fig. 4i), and troponin (cTnI; Fig. 4j) in the cardiac tissue. These biomarkers are indicative of heart failure, as their levels rise not only in acute heart failure but also in chronic cardiac conditions35,36,37. Our studies revealed that all three biomarkers were elevated in the heart tissues of the KO hearts. These observations were consistent across both sexes (Supplementary Fig. 13).
Cardiac PGRMC2 is required for normal heart functions to prevent pressure overload
Our studies thus far showed that PGRMC2 played an important role in cardiac functions through a mechanism which involved cardiac contractility and cardiac volume regulation (Supplementary Tables 1–4; Figs. 3, 4). The heart failure in the KO mice were exacerbated during hypoxia, resulting in the CHF. Since a healthy heart regulates both volume and pressure concurrently38, we next examined if cardiac pressure was dysregulated in KO hearts. To determine if PGRMC2 was involved in pressure regulation, we subsequently analyzed both LV maximum pressure (LVPmax), end-systolic pressure (ESP), and end-diastolic pressure (EDP) using an isolated working heart system. To evaluate the relationship between LV pressure and volume in each cardiac cycle, without the influence of the autonomic nervous system and humoral effects, we utilized the ex vivo Pressure-Volume (PV) loop39,40. Adrenaline and diltiazem were also used to represent positive and negative ionotropic stresses, respectively (Fig. 5a).
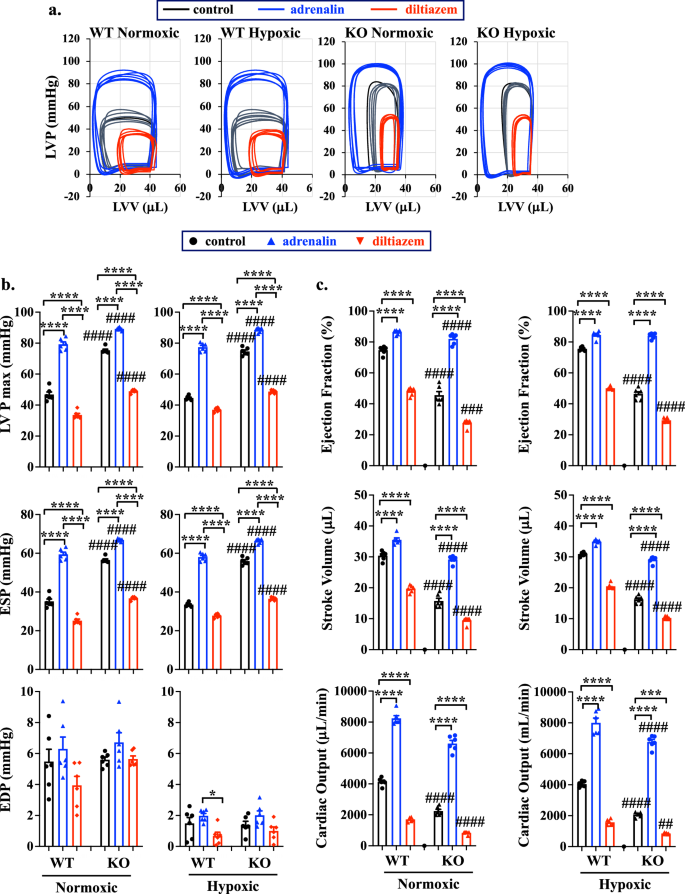
PV loop was studied in 14 weeks old WT and KO of normoxic or hypoxic mouse models (a). LVV left ventricle volume, LVP left ventricle pressure. Left ventricle pressure maximum (LVPmax), end systolic pressure (ESP), and end diastolic pressure (EDP) parameters were analyzed (b). Ejection fraction, stroke volume, and cardiac output were analyzed to indicate LV functions (c). Adrenalin (4 mg/L) and diltiazem (0.08 mg/L) were used as a stress test. n = 6 for all data sets; n represents the number of mice. Statistical analysis is based on one-way ANOVA multiple comparisons, followed by Tukey’s post-hoc. Statistical significance between control and treatment is indicated with asterisk (*); comparison between WT and KO is shown in hashtag (#). *p = 0.021; ****p < 0.0001; #p = 0.025; ####p < 0.0001; data are presented as mean values ± SEM. Source data are provided in a Source Data file.
Both LVPmax and ESP were found to be significantly elevated in KO hearts, compared to WT hearts, even after treatment with adrenaline or diltiazem (Fig. 5b). These data indicate that the increases in LVPmax and ESP, but not EDP, contribute to the pressure overload observed in KO hearts. Additionally, EDP in KO hearts was not responsive to adrenaline or diltiazem treatments (Fig. 5b; Supplementary Tables 5, 6), suggesting a potential cardiac dysfunction due to the cardiac fibrosis or filling defect39. As expected, EDP was lower in both WT and KO groups during hypoxia compared to normoxia due to a potential adaptation from hypoxia-induced vasodilation41 and increased in RV afterload, which decreases the LV loading42. Our ex vivo PV loop studies also confirmed the in vivo CMR data, showing significant reductions in systolic functions (EF, SV and CO) with an increased ESV in both male and female KO hearts (Fig. 5c; Supplementary Fig. 14; Supplementary Tables 7–10). Taken together, our findings suggest that LV dysfunctions occurred prior to hypoxic stress, indicating that cardiac PGRMC2 is required to regulate the normal pressure-volume relationship in LV physiology, particularly during adaptation to hypoxia. The mechanism through which PGRMC2 regulates the pressure and volume relationship involves the regulations of LVPmax, ESP, and heart contractility. Abnormalities in these parameters could result in LV volume and pressure overload, subsequently leading to cardiac remodeling and failure.
PGRMC2 is a steroid hormone mediator required for intracellular signaling
PGRMC2 is a steroid hormone mediator43, and it is well known that steroid hormones play a role in regulation of myocardial intracellular Ca2+.44 It remains unknown whether steroid hormones have an impact on intracellular Ca2+ levels through non-classical, non-genomic, rapid-response steroid receptor, PGRMC2. We thus assessed the impact of various steroid hormones on the rapid cytosolic Ca2+ responses in isolated cardiomyocytes using a ratiometric Fura-2 assay. Steroid hormones estradiol, progesterone, and hydrocortisone were used to potentially activate PGRMC2, and ionophore ionomycin was used as a positive control.
A relatively higher optimal concentration of steroid hormones was used to stimulate the myocytes, because the hormones consistently showed no response in KO myocytes (Fig. 6a). Increased cytosolic Ca2+ responses to steroid hormones was always observed in the WT myocytes. To confirm this finding, ectopic expression of PGRMC2 in KO cardiomyocytes was carried out using Myc-DDK-tagged PGRMC2 adeno-associated virus particles. The successful ectopic expression of PGRMC2 (or rescued) was confirmed with Western blot using a DDK antibody and further validated with PGRMC2 antibody (Supplementary Fig. 15). The Fura-2 AM results show that the ectopic expressed PGRMC2 cardiomyocytes could rescue cytosolic Ca2+ in response to all steroid hormones.
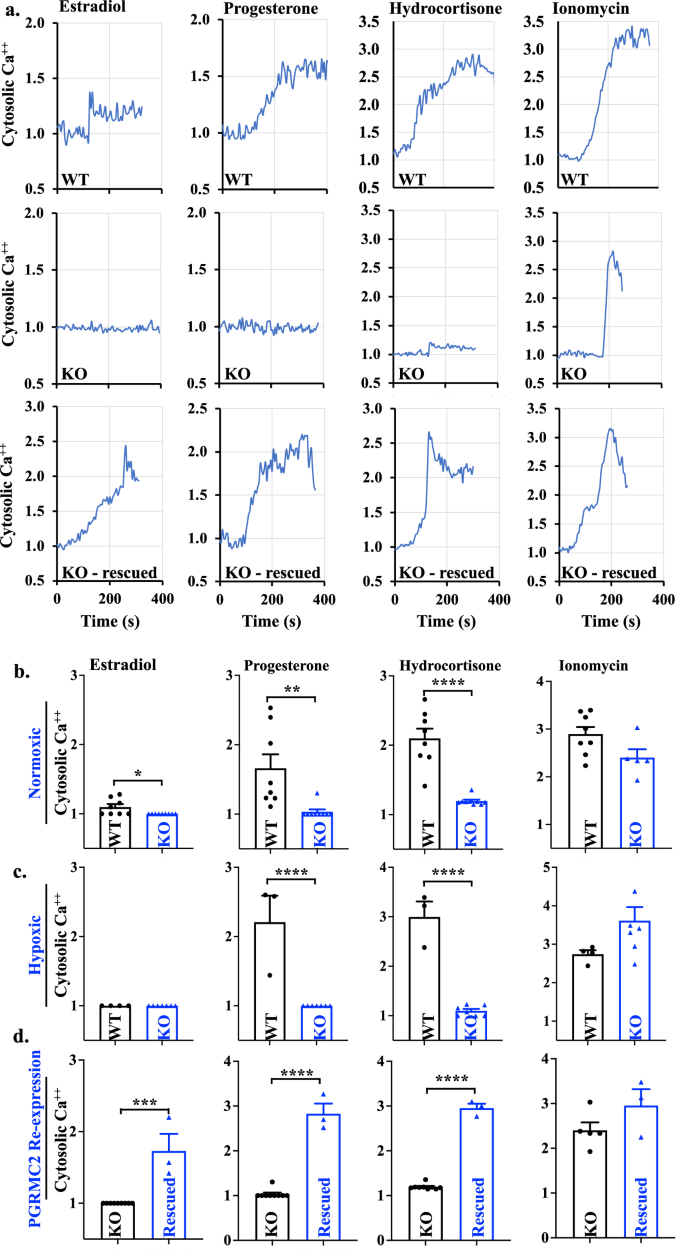
a Representatives of 340 nm/380 nm excitation ratio using Fura-2AM test in WT, KO, and rescued cardiomyocytes were shown with treatment of estradiol (15 ng/mL), progesterone (40 ng/mL), and hydrocortisone (10 μg/mL) after baseline calcium level was recorded for 2–3 min. Ionomycin (5 μM) was used as a positive control. b–d Cytosolic calcium was quantified and compared between WT and KO cardiomyocytes in normoxic (b), hypoxic (c), and after rescued (d). n = 3–9 represents the number of cardiomyocytes (or independent experiments) from a total of 3 mice in each group. Statistical analysis is based on two-tailed t-test. Statistical significance between different groups is indicated with asterisk (*); *p = 0.025; **p = 0.0053; ***p = 0.0001; ****p < 0.0001; data are presented as mean values ± SEM. Source data are provided in a Source Data file.
A significant higher cytosolic Ca2+ levels in the WT, compared to KO cardiomyocytes, were revealed in response to the steroid hormones in normoxic cardiomyocytes (Fig. 6b). While the KO cardiomyocytes had no response, WT cardiac myocytes were highly responsive to the steroid hormones, especially to progesterone and hydrocortisone in hypoxic cardiomyocytes (Fig. 6c). Interestingly, neither hypoxic WT nor KO cardiomyocytes showed estradiol-induced Ca2+ signaling. Ectopic expression of PGRMC2 could rescue KO myocytes in response to all three steroid hormones (Fig. 6d).
Based on these results, we could draw a conclusion that steroid hormones, particularly progesterone and hydrocortisone, required PGRMC2 receptors for a rapid response and increase of the intracellular Ca2+ levels in cardiomyocytes. Taken together, in response to steroid hormones, activation of PGRMC2 is required to maintain a balanced intracellular signaling in both normoxic and hypoxic conditions. This result further supports the role of PGRMC2 in cardiomyocytes through intracellular Ca2+ signaling.
It is well-established that the hypoxia-inducible factor-1α (HIF-1α) plays a crucial role in the transcriptional response to hypoxia, and chronic nuclear translocation of activated HIF-1α can induce cardiomyopathy45. To understand how hypoxia exacerbated the KO heart dysfunctions, we measured the expression level of HIF-1α in the heart tissue, and the results did not show significant differences in Hif-1α expressions, irrespective of sex (Supplementary Fig. 16a, b). However, the KO hearts exhibited an increase in the nuclear translocation of HIF-1α, particularly within the KO hypoxic mice in both sexes (Fig. 7a,b; Supplementary Fig. 16c, d). VEGF expression in response to hypoxia was significantly upregulated in KO mice (Fig. 7c), possibly resulting from the nuclear HIF-1α induction46. Both HIF-1α and VEGF are involved in cardiac remodeling, angiogenesis, and dysfunction47.
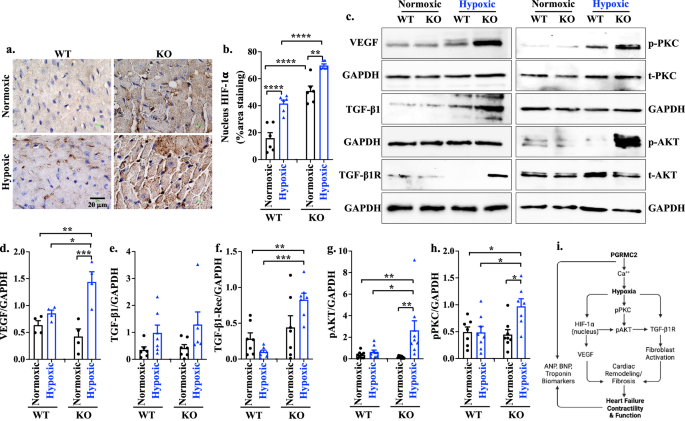
a, b IHC staining (a) and quantification (b; p = 0.0029 or <0.0001) of HIF-1α in heart tissue. c. Western blot analyses of mouse heart tissue for VEGF, TGF-β1, TGF-β1 receptor (TGF-β1R), p-PKC, and p-AKT. d–h Expression levels of VEGF (d; p = 0.032, 0.0040, 0.0006), TGF-β1 (e), TGF-β1R (f; p = 0.0054, 0.0002), p-AKT (g; p = 0.018, 0.0025, 0.0059), and p-PKC (h; p = 0.013, 0.023, 0.031) were quantified. All protein expressions were normalized with the GAPDH of the corresponding samples. i. Graphical summary of PGRMC2 role in the heart during hypoxia. n = 6–9 for all data sets, n represents the number of mice. Statistical analysis is based on one-way ANOVA multiple comparisons, followed by Tukey’s post-hoc. Statistical significance between different groups is indicated with asterisk (*); data are presented as mean values ± SEM. Source data are provided in a Source Data file.
To investigate signaling pathways leading to myocardial interstitial fibrosis, we examined the expression levels of the key mediators implicated in cardiac fibrosis48,49, including transforming growth factor (TGF-β1), TGF-β1 receptor (TGF-β1R), phosphorylated AKT (p-AKT), phosphorylated calcium-dependent protein kinase (p-PKC), phosphorylated mitogen-activated protein kinases (p-MAPK), phosphorylated SMAD2-3 (p-SMAD2-3), and phosphorylated phosphoinositide 3-kinase (p-PI3K), using heart tissue lysates. Our data indicated elevated expression levels of TGF-β1R, p-AKT, and p-PKC in the KO hearts during hypoxia (Fig. 7c-h; Supplementary Fig. 17), indicating that these molecules could play a crucial role in compensating the KO hearts. These activation cascade results in fibroblast activation and accumulation in the KO hearts ultimately leading to cardiac fibrosis (Supplementary Fig. 18a). No significant differences were observed in the expression of TGF-β1, p-MAPK, p-SMAD 2–3, and p-PI3K between the WT and KO hearts (Supplementary Fig. 18b), suggesting that TGF-β1/p-MAPK/p-SMAD 2–3/p-PI3K was not a predominant pathway to alter KO heart remodeling. Overall, these findings suggested that steroids/Ca2+/hypoxia/HIF-1α/VEGF/TGF-β1R/Akt/PKC signaling pathway contributed to the cardiac remodeling and functional changes in response to hypoxia in the KO hearts (Fig. 7i).
Transcriptome analyses reveal that PGRMC2 is associated with heart diseases
The RNA-Seq has been used as a reliable method for profiling gene expressions in mouse heart tissue50. Total mRNA transcriptome sequencing of WT and KO heart samples was studied using the NovaSeq X Plus platform (Illumina). The bioinformatic analysis of RNA-Seq was performed to identify differentially expressed genes (DEGs). To interpret the functional implications of the DEGs identified in KO heart tissues, we utilized QIAGEN Ingenuity Pathway Analysis (IPA). This approach allowed us to explore 1) canonical pathways, 2) toxicology-related (TOX) functions, and 3) key signaling pathways potentially disrupted in the KO model. The analyses revealed significant enrichment in canonical pathways such as glucocorticoid receptor signaling, estrogen receptor signaling, cardiac hypertrophy signaling, HIF1α signaling, cardiac conduction, Akt signaling, cardiac hypertrophy and VEGF signaling, among many others (Supplementary Fig. 19).
The IPA canonical pathway analysis supports our prior studies. Among many other, the Western blot studies are consistent with the IPA pathway that the VEGF signaling was significantly elevated in KO hypoxic (Fig. 7c, d). The elevated VEGF level during hypoxia has generally been used as a key marker of angiogenic activity51. To validate this correlation, we evaluated angiogenesis and quantified capillary density in the heart tissues using endothelial marker CD31 for angiogenesis (Supplementary Fig. 20). Our findings showed an increased in the cardiac capillary density of the KO hypoxic mice.
The IPA-Tox analysis was conducted to investigate toxicological functions (or disease associations) and to identify groups of DEGs that could predict disease endpoints. The IPA analysis identified key-related diseases, including cardiac dysfunction, cardiac fibrosis, and cardiac enlargement and failure with significant associations (p-value ≤ 0.0001), among many others. These results suggest a potential link between PGRMC2 and heart diseases, which may contribute to the observed phenotype in KO hearts (Supplementary Fig. 21).
Several key signaling pathways were also significantly altered in the KO model (Supplementary Fig. 22). For example, consistent with our findings (Fig. 7i), the PKC and Akt pathways were activated, while intracellular Ca²+ release was inhibited, as observed in the KO hypoxic group. Further studies should explore additional signaling pathways, such as G-protein pathways, which may interact with steroid hormone signals52. Protein kinase A (PKA) is also a central regulator of cardiac performance and structure, in which PKA also regulates intracellular Ca2+.52 These findings offer valuable insights into the molecular mechanisms and suggest potential targets for further research or therapeutic development.
PGRMC2 is not involved in mitochondria biogenesis and heme metabolism in the heart
Previously study has shown that PGRMC2 is related to mitochondrial biogenesis via intracellular heme in the adipose tissue53. We therefore analyzed the expression levels of two crucial protein components associated with mitochondria biogenesis and function: subunit I of complex IV (cyclooxygenase-1; COX-1) and complex II (succinate dehydrogenase subunit A; SDH-A). The results showed that the expressions of the COX-1 and SDH-A remained unchanged in the hearts from WT and KO mice (Supplementary Fig. 23a, b). Our data also suggest that the total intracellular heme was similar between WT and KO hearts (Supplementary Fig. 23c). This implies that PGRMC2 is not involved in mitochondria biogenesis and function in the heart tissues.
Discussion
In the current study, we discovered the cardiac role of PGRMC2 as a rapid response steroid receptor for Ca2+ signaling. The cardiac PGRMC2 is required to maintain a normal heart function through the regulation of pressure-volume relationships. In the absence of PGRMC2, hypoxic stress accelerates the pressure-volume overload leading to left ventricle (LV) dysfunction. PGRMC2 is also implicated in the steroids/Ca2+/hypoxia/HIF-1α/VEGF/TGF-β1R/Akt/PKC signaling pathway, leading to cardiac fibrosis that negatively impacts the cardiac electrical propagation and repolarization. Hypoxia induces pulmonary artery vasoconstriction, which significantly increases the afterload on the right ventricle (RV); this leads to pulmonary hypertension and edema in the absence of PGRMC2. Without cardioprotective PGRMC2 role, the LV and RV dysfunctions progress to congestive heart failure in hypoxia.
To investigate the cardiac function of PGRMC2, we utilized a heart-specific PGRMC2 KO mice. Using normobaric hypoxic as a cardiac stress model in vivo54,55, we uncovered the cardio-protective functions of PGRMC2. During hypoxia, metabolic acidosis was observed in KO but not WT mice as indicated by the blood pH (Fig. 1). Chronic hypoxia is generally known to induce respiratory alkalosis, which results in renal compensation by reducing bicarbonate. The KO mice with sub-optimal heart functions would further induce poor perfusion (hypo-perfusion), reducing O2 content at the physiological level. This microvascular flow dysregulation may trigger metabolic acidosis56, which significantly lowered the blood pH in KO mice (from 7.43±0.05 to 7.26±0.05).
Under hypoxic stress, the absence of PGRMC2 significantly exacerbated cardiac fibrosis and dilation in both left and right ventricles (Fig. 2). Such remodeling impeded electrical propagation and repolarization, manifesting as abnormal J-waves on ECG in PGRMC2 KO mice. The cardiac remodeling processes observed in KO mice also led to decreased exercise tolerance and systolic blood pressure (SBP). To investigate if our data variation and distribution could be contributed by differences in sexes, we further analyzed the data by separating the sexes. Apart from ventricular fibrosis and the physical activity, which showed greater effects in the hypoxic male of KO group, no major sex differences were identified. These findings suggest that while sex did not play a significant role for most parameters, the influence of sex on ventricular fibrosis and physical activity warrants further investigation in future studies.
The heart undergoes various adaptations during hypoxia to sustain essential cellular functions10. These adaptations involving cellular adjustments are required to maintain cardiovascular homeostasis and protect the heart under a stressful condition that requires an increased workload10. Hypoxia typically induces pulmonary artery vasoconstriction, thereby elevating afterload on the RV, which could lead to pulmonary hypertension and heart failure46. This necessitates an increase in the RV cardiac work to effectively pump blood into the pulmonary artery12,14. Notably, we observed a greater pulmonary resistance exclusively in the KO hypoxic model, accompanied by pulmonary vascular remodeling in the lungs (Fig. 3). Pulmonary resistance could significantly increase the afterload on the RV, resulting in pulmonary edema and hypertension. This scenario exacerbated hypoxia-induced pulmonary vasoconstriction and hypertension, ultimately resulting in RV heart failure.
Although we did not observe any RV abnormalities in the KO normoxic model in the CMR, the LV systolic function was decreased even under normoxic conditions and exacerbated during hypoxia (Fig. 4). Hypoxia further decreased ejection fraction (EF), stroke volume (SV), and cardiac output (CO) in LV, indicating a systolic dysfunction. The systolic dysfunction in turn caused blood backup, resulting in congestive heart failure (CHF). CHF in this model was shown by ascites and edema in the lungs and livers. Additionally, elevated levels of heart failure biomarkers (ANP, BNP, cTnI) persisted even during normoxia in KO mice. This elevation is primarily due to an increased strain caused by high ventricular filling pressure and volume57,58,59. Thus, the biomarkers supported our clinical findings (physical exercise, ECG and SBP) and paraclinical data (CMR results).
The systolic heart failure was due to the inability of the heart to sustain contractility. Our studies confirmed that such an inability to sustain contractility led to left ventricular volume and pressure overload, disrupting the critical pressure-volume relationship (Fig. 5). Advanced cardiac function assessments using CMR and Working Heart system consistently revealed elevated left ventricular end-systolic volume (LVESV), left ventricular end-systolic pressure (LVESP), maximum left ventricular pressure (LVPmax), right ventricular end-systolic volume (RVESV), and right ventricular end-diastolic volume (RVEDV). These observations suggest that pressure and volume overload in the LV contributed to blood backing up into the lung, leading to pulmonary edema during hypoxia. The dysregulation of cardiac pressure-volume relationship seen in the PV loop studies suggests the failure of the heart to regulate its own function (auto-regulation), a phenomenon commonly seen in various cardiac diseases, including heart failure and valve disorders60,61,62.
Because PGRMC2 is a non-classical rapid response steroid receptor, we investigated Ca2+ signaling known to have a crucial role in myocyte contraction39. Furthermore, PGRMC2 was required for pressure-volume relationship regulation to sustain contractility. We therefore used steroid hormones estradiol, progesterone and hydrocortisone to investigate Ca2+ fluxes, because steroid hormones are known to regulate myocardial intracellular Ca2+.44 It is apparent that PGRMC2 was required for rapid cytosolic Ca2+ increase in response to steroid hormones in normoxia or hypoxia (Fig. 6). Ectopic expression of PGRMC2 in KO cardiomyocytes could rescue the rapid Ca2+ increase, supporting the critical role of PGRMC2 in cardiomyocytes on the regulation of intracellular Ca2+ signaling. Our transcriptome signaling pathway analyses also revealed the inhibition of Ca2+-dependent cascade in KO compared to WT cardiomyocytes. This finding underscoring the importance of PGRMC2 in Ca2+ signaling in maintaining cardiac contraction and the overall systolic function63,64.
PKC is a known marker in heart failure65, contributing to hypoxia-induced activation of the TGF-β1R and Akt pathway. Our results suggested that HIF-1α/VEGF/PKC/TGF-β1R/Akt pathway is abnormally up-regulated (Fig. 7). The PKC/TGF-β1R/Akt pathway is implicated in cardiac remodeling and fibrosis under chronic pressure-overload conditions66,67,68. Additionally, HIF-1α/VEGF/Akt/TGF-β1R signaling cascade promotes fibroblast activation, cardiac remodeling, fibrosis, angiogenesis, and the progression of heart failure. We report here that PGRMC2 was involved in the Ca2+ signaling and hypoxia-induced signaling pathways relevance to cardiac pathology. We also performed an unbiased RNA-Seq transcriptomic analyses on differentially expressed genes (DEGs) to confirm our studies. The DEGs predicted the differential pathways of HIF-1α/VEGF/PKC/TGF-β1R/Akt between WT and KO hearts.
Overall, our study highlights the critical role of PGRMC2 in maintaining normal cardiac function through the regulation of pressure-volume relationships. PGRMC2 serves as a crucial mediator of steroid hormones, modulating myocardial Ca2+ levels to preserve cardiac contractility and function. In the absence of PGRMC2, hypoxic stress accelerates pressure-volume overload leading to cardiac remodeling by implicating the steroids/Ca2+/hypoxia/HIF-1α/VEGF/TGF-β1R/Akt/PKC signaling pathway and ultimately impacting cardiac electrical propagation and repolarization. This research underscores the essential role of PGRMC2 in regulating cardiac volume and pressure to maintain normal cardiac physiology, suggesting its potential therapeutic utility in heart disease treatment.
Methods
The Chapman University Federalwide Assurance for the protection of human subjects is FWA#00011020. The use of human samples was reviewed and approved by Chapman University Institutional Review Board (IRB Protocol#1415H040). Because no patient was recruited in our studies, no informed consent was needed. The waiver of consent as the study used unidentified samples is issued by the IRB (#1415H040). Throughout our studies, mice were utilized to investigate the structural and functional changes in the hearts. Our animal studies were approved by Chapman University Institutional Animal Care and Use Committee (IACUC; OLAW#D17-00960). The PGRMC2flox/flox mice69 were crossbred with heart-specific transgenic mice (MyH6) obtained from the Jackson Laboratory (stock#011038; C57BL/6). The MyH6•Pgrmc2wt/wt mouse was identified as the wild type (WT; control), while the MyH6•Pgrmc2flox/flox mouse was referred as the Pgrmc2 knockout (KO; mutant). The heart structure and function assessments were done in both male and female mice at 10-, 12-, and 14 weeks old.
Mouse handling
All mice were housed at 12 h dark/light cycle, 18-23 °C room temperature, and 40-70% relative humidity. A potential mouse distress was closely monitored. These distress parameters included weight loss of 20% original body mass, failure to eat or drink normally. Mice were checked for eating, drinking, moving normally and potential abnormal body posture. Aside from distress, mice were also monitored for the need of nail trimming as a potential measure for ulcerative dermatitis. Laboratory staff provided a general observation once daily. When abnormality was observed, a closer monitoring was warranted (a minimum of twice daily). Symptoms of heart failure were monitored closely; we examined the following clinical signs: inactive and weakness, enlarged abdomen, limb swelling and weight gain due to the fluid retention, poor appetite, behavioral changes, and/or and potential untimely death.
For initial anesthesia induction, up to 5% of isoflurane was used in a closed anesthesia chamber. For anesthesia maintenance, 1–3% of isoflurane was administered to animals using a precision vaporizer. Anesthesia was assessed by the absence of paw pinch reflex. The toe was firmly pinched to elicit a withdrawal response by the mouse. The absence of palpebral reflex by touching the eyelid was also used to assess the depth of anesthesia. Respiratory pattern was also carefully monitored for a constant respiratory rate, consistent respiratory cycle (length of inspiratory/expiratory), respiratory rhythm, and effort of breathing. The isoflurane dose was adjusted as needed.
For euthanasia, mouse was anesthetized with 200–250 mg/kg body weight of ketamine by i.p. injection. The chest and abdomen of the mouse was then wiped with 70% ethanol and opened with a surgical scissor. The diaphragm was next removed to expose and dissect out the heart. This was a terminal procedure for the mouse followed by organ collections. In general, mouse handling, welfare, monitoring and euthanasia practices were followed based on the operating procedures and policies set by Chapman IACUC with the highest ethical and humane standards.
Mouse genotyping
To identify the transgenic mice, we performed genotyping using qualitative polymerase chain reaction (PCR). The ear tissue sample from individual mouse was digested and homogenized; the genomic DNA was then analyzed with PCR using specific primers for MyH6 and Pgrmc2 (see Primer List below). For the PCR reaction, 12.5 µl of QUICK-LOAD® Taq 2X Master Mix (Biolabs, 200064-426) and 0.5 µL of 10 µM pre-diluted forward and reverse primers (100 µM stock; Integrated DNA Technologies, USA) were added to 0.2 mL PCR tube; 1 µl of genomic DNA sample and up to 25 µl of nuclease-free water were added to each tube for a final reaction volume of 25 µl. PCR was conducted using a standard thermocycler (BioRad, 1851148). The thermocycler conditions were as follows: initial denaturation (94 °C for 3 min), followed by 35 cycles of denaturation (94 °C for 30 s), annealing (54 °C for 45 s) and extension (72 °C for 45 s) and a final extension at 72 °C for 2 min. The PCR products were then removed from the thermocycler and loaded onto 1% agarose gel. MyH6 hemizygous was identified by the presence of 2 bands at ~300 and ~100 base-pairs (bp), and PGRMC2 homozygous mutants were characterized by a single band of ~500 bp. The forward primers for Myh6 were 5’-ATG ACA GAC AGA CAG ATC CCT CCT ATC TCC-3’ and 5’-CAA ATG TTG CTT GTC TGG TG-3’. The reverse primers for Myh6 were 5’-CTC ATC ACT CGT TGC ATC ATC GAC-3’ and 5’-GTC AGT CGA GTG CAC AGT TT-3’. For Pgrmc2, the forward and reverse primers are respectively 5’-CGG GTC CAT ATG GCA TCT TTG-3’ and 5’-CTT TAA ACT GCA TTT CCC ATT CTC G-3’.
Hypoxia induction
Eight weeks old control MyH6Cre•Pgrmc2WT/WT and heart specific MyH6Cre•Pgrmc2flox/flox mice (fertile males and females) were maintained in a normobaric hypoxic chamber (BioSpherix, Ltd., RRID: SCR_021177) for 6 weeks with 10% O2 and <1000 ppm CO2. When mice were put into the hypoxic chamber, the chamber’s O2 level was progressively decreased to 10% (1% O2 every 10–20 min) and kept constant at this level for 6 weeks, except at 10, 12, and 14 weeks-old when mice were taken out from the chamber briefly for about 2 h to do the cardiac magnetic imaging. Matching normoxic control animals were kept in the same room for 6 weeks outside of the hypoxic chamber. When mice were taken out from the chamber, the O2 level inside the chamber was returned to 21% (1% O2 every minute). At the end of the 6 weeks period, the animals and their hearts were used for our in vivo (blood test, blood pressure, etc.) and in vitro studies, respectively. In the hypoxia chamber, the O2 and CO2 levels were regulated using ProOx 360 High Infusion Rate O2 Controller (BioSpherix, Ltd., RRID: SCR_021130) and ProCO2 120 Compact CO2 Controller (BioSpherix, Ltd., RRID: SCR_021127), respectively. CO2 level was also controlled with soda sorb (Mckesson Medical-Surgical, 568430).
Blood test
We employed the handheld, wireless i-STAT blood analyzer (Abbott Laboratories, 04P75-03) along with the single-use CG8+ (Abbott Laboratories, 03P88-25) and creatinine cartridges (Abbott Laboratories; 03P84-25). The Abbott Laboratories cartridges were stored at 4°C and allowed to reach room temperature for 5–10 min prior to use. Under anesthesia using isoflurane, blood samples were collected from the submandibular vein (cheek) into the lithium heparin blood tubes (BC Microtainer, 365985), gently mixed with anticoagulant and used for blood tests. Approximately 100 µl of whole blood was applied to the cartridge, the port was securely sealed before placing the cartridge into the iSTAT analyzer, and the results were read after 2–3 min.
Histology
To evaluate myocardiac fibrosis and hypertrophy, heart tissues were collected and fixed in 4% paraformaldehyde for 24 h. The fixed tissues were then processed for dehydration through a serial of graded ethanol solutions (70%, 95%, and 100%) and xylene. Next, tissues were embedded in the paraffin using an automated tissue processor. The paraffin-embedded tissues were sectioned at a thickness of 5 μm, deparaffinized in a 60 °C oven for 30 min, and rinsed with xylene. The deparaffinized tissue slides were next rehydrated through graded ethanol solutions (100%, 95%, and 70%) and stained using Masson’s trichrome kit (Cat# 25088-1; Polysciences, Inc.). Images were acquired using a KEYENCE BZ-X710 microscope39,70. Fibrosis in the tissue, stained with Masson’s trichrome, was quantified using binary masking of the blue-colored regions in the image. Image analysis was performed using Nikon NIS-Elements for Advanced Research software (Version 4.51).
For H&E staining, the lung, liver, and heart tissues were collected, processed, sectioned, deparaffinized, and rehydrated as described above in Masson’s trichrome section. The tissue slides were then stained with hematoxylin [VWR; cat#10143-152], followed by eosin [VWR; cat#10143-140], dehydrated with 75%, 95%, and 100% alcohol, rinsed with xylene and mounted with coverslip. For immunohistochemistry of PGRMC2 and HIF-1α expression, tissue slides were initially subjected to deparaffinization and dehydration process, followed with epitope retrieval. After permeabilization, endogenous peroxidase activity was blocked with 3% hydrogen peroxide for 10 min, and unspecific bindings were further blocked with animal-free blocking solution (Cell Signaling, 15019). The tissue slides were then incubated overnight at 4 °C with different antibodies, including primary mouse monoclonal anti-PGRMC2 (Santa Cruz, 374624) and anti-HIF-1α receptor (Santa Cruz, 13515). Subsequently, the slides underwent thorough washing step and were incubated in the Signal Stain Boost Detection Reagent, HRP mouse (Cell Signaling, 8125) for 30 min at room temperature, followed by incubation in Signal Stain DAB (Cell Signaling, 8059) for 3–5 min. To complete the staining process, hematoxylin (Cell Signaling, 14166I) was used for nuclear staining and slides were mounted with coverslips. All washing steps were performed three times with PBS-T (0.05% Tween-20).
To investigate protein localization and expression using immunofluorescence staining, the formalin-fixed tissues were deparaffinized. Following deparaffinization and dehydration, heat-induced epitope retrieval was conducted using a pressure cooker and sodium citrate buffer (10 mM sodium citrate, 0.05% Tween-20, pH 6.0). The slides were immersed in the sodium citrate buffer within the pressure cooker for 10 min after boiling, then cooled to room temperature for 30 min. Tissue permeabilization was achieved by washing the slides with a permeabilization buffer containing 0.3% Triton X-100 in PBS for 10 min. Subsequently, the slides were blocked with a solution of 5% bovine serum albumin and 0.1% Triton X-100 in PBS before proceeding with protein detection. All washing steps were performed three times using PBS-T. We used the following primary antibodies: rabbit monoclonal anti-CD31 (Abcam, cat# 222783 [EPR17260-263]; 1:100), rabbit monoclonal anti-PGRMC2 (Santa Cruz, cat# 374624; 1:100), rabbit monoclonal anti-vimentin (Cell Signaling, cat# 5741S; 1:100), rabbit anti- Troponin (Abcam, 209813 [EPR20266]), and wheat germ agglutinin (WGA) (Vectorlabs; 1:1,000; cat# FL-1021) to stain the cell membrane.
Blood pressure and treadmill exercise measurements
The non-invasive tail-cuff method was used at 14 week-old age to measure the blood pressure, pulse pressure, heart rate, systolic and diastolic blood pressures71. Mice were first introduced and acclimated to the blood pressure restrainers and procedure for up to 7 days before the experiments were performed. Systolic and diastolic blood pressure measurements were taken using a non-invasive tail cuff method with a pneumatic pulse sensor attached to the tail, utilizing the CODA High Throughput System (Kent Scientific Corp.).
Cardiac exercise test was performed to evaluate the impact of PGRMC2 on cardiac functions and activity. We used Exer3/6 treadmill (Columbus instrument) and allowed mice to habituate to the treadmill procedures for up to 7 days before experiments were performed. This allowed mice to become familiar with the sight, sound, and smell of the instrument to minimize psychological stress. To encourage unwilling mice from exercising, we placed an electric shock grid at the back of the treadmill to deliver a mild electric shock (1 mA) for motivation but would not injure the animals. Mice that did not exercise willingly after several training sessions, required extensive prodding, or received several electrical shocks per session were excluded from the study. The speed of the exercise was incrementally increased by 5 cm/s every 2 min. If at any point during the experiment a mouse became exhausted, the shock grid for that lane was turned off, and the mouse allowed to rest. Exhaustion time, running distance, and speed were recorded and analyzed.
Magnetic Resonance Imaging (MRI)
Functional MRI of animal heart was acquired using a 9.4 Tesla Bruker MRI system (BioSpec 94/20 USR, Bruker Biospin, Ettlingen, Germany). An MRI radiofrequency (RF) volume coil with an outer/inner diameter of 112 mm/86 mm and cardiac surface coil array for optimal signal reception during cardiac imaging was used. The mice were removed from hypoxic chamber for ~2 h, anesthetized in an anesthetic chamber using 2.5–3% isoflurane in a mixture of oxygen and air for induction. They were then placed in the RF coil in the prone position, and anesthesia was maintained at a level of 1–1.5% isoflurane in an oxygen/air mixture. Respiration rate and body temperature were monitored with a small respiratory pillow sensor and a temperature probe placed under the abdominal area, respectively. Body temperature was maintained at 37 °C using a water-heated blanket, and the respiratory rate was kept between 20 and 70 breaths per minute by adjusting the isoflurane dose. Electrocardiogram (ECG) electrodes were connected to the front paws and tail after applying electrode gel, and the ECG signals were continuously monitored. To get the long and short axis views of the hearts, we went through the localizer and planning scans to check the position of the coil and to localize the heart among the other organs. Multiple image Cine-IG-Flash views, including short-axis, long-axis 4-chamber, and 2-chamber views, with 0.8 mm slice thickness using both cardiac and respiratory gating at age of 10-, 12-, 14 weeks old, were captured to evaluate the structure and function of the mouse heart. For cardiac imaging analysis, we utilized the Segment software from Medviso running on MATLAB (https://medviso.com/segment/); we also used OsiriX MD software; version 14 (https://www.osirix-viewer.com/osirix/osirix-md/) to visualize abdominal fluid retention. Pulmonary arterial pressure was determined via right ventricle cardiac output, heart rate by using blood density measured in our experiments. Blood density was measured to be 12.6 and 16.7 g/dL in normoxic and hypoxic mice, respectively. Pulmonary resistance was calculated via mean left arterial pressure and mean pulmonary pressure based on right cardiac output taken from the functional MRI.
Quantitative PCR
The mRNA was isolated from the mouse heart tissues using the RNeasy Mini Kit (Qiagen, 74104), following the manufacturer’s protocol. Subsequently, the mRNA was immediately reverse-transcribed into complementary DNA (cDNA). The cDNA was used to measure ANP, BNP and cTnI gene expressions, while GAPDH was used as the reference gene in the real-time PCR. A reaction mixture was prepared by combining 2 μL of cDNA, 2 μL of forward primer (200 nM), 2 μL of reverse primer (200 nM), 4 μL of UltraPure DEPC-treated water, and 10 μL of Bullseye Real Time qPCR Master Mix (MedSci, BEQPCR-S), resulting in a total volume of 20 μL. The mixture underwent a thermal cycling process, which included an initial incubation at 95 °C for 10 min, followed by 40 cycles at 95 °C for 15 s and 55 °C for 60 s. The forward and reverse primers were purchased from Integrated DNA Technologies. The gene expressions of ANP, BNP, and cTnI were calculated using the ΔCT method.
The respective forward and reverse primers for Nppa (or ANP) were 5’-GGG TAG GAT TGA CAG GAT TGG-3’ and 5’-TTC CTC CTT GGC TGT TAT CTT C-3’; for Nppb (or BNP) 5’-ACT CCT ATC CTC TGG GAA GTC-3’ and 5’-GCT GTC TCT GGG CCA TTT-3’; for Tnni3 (or cTnI) 5’-AGC CAC ACG CCA AGA AA -3’ and 5’-CAT CTC CTG CTT CGC AAT CT-3’; and for Gapdh (or GAPDH) 5’-ACC ACA GTC CAT GCC ATC AC-3’ and 5’-TCC ACC ACC CTG TTG CTG TA-3’.
Isolated working heart
The isolated working heart system was used to evaluate cardiac function in the absence of neurohumoral factors39. A 14 week-old mouse was administered heparin (100 units; intraperitoneal) to inhibit blood coagulation. Approximately 8–10 min later, the mouse was anesthetized with ketamine (dose range: 200–350 mg/kg; intraperitoneal). Subsequently, following abdominal and diaphragmatic incisions, the heart was excised. The aorta was cannulated and perfused with a Krebs-Ringer solution (comprising 125 mM NaCl, 2.5 mM KCl, 1.25 mM NaH2PO4, 2 mM CaCl2, 1 mM MgCl2, 25 mM NaHCO3, and 25 mM glucose) under continuous carbogen aeration (consisting of 95% O2 and 5% CO2) to maintain a pH of 7.4 at 38.0 °C. The ex vivo perfusion of the mouse heart was conducted in which the left atrium was cannulated, preload was adjusted to 5 mmHg, and cardiac function parameters were recorded via the working heart system (emka Technology, Inc.). To evaluate cardiac electrical activity independent of neurohumoral factors, an ex vivo ECG was recorded after placing ECG electrodes on the right atrium and the apex of the heart. Additionally, the SPR-671 Mikro-Tip® mouse pressure catheter was inserted into the left ventricle to measure and record the left ventricular pressure. The heart’s responses to external stressors were examined through pharmacological stress tests, including the administration of epinephrine (4 μg/L) or diltiazem (0.08 μg/L) via perfusion into the heart through the left atrium.
Cardiomyocyte isolation
The simplified Langendorff-free method was used for the isolation of adult primary cardiomyocytes72. 14 week-old mice were anesthetized with isoflurane. Following the opening of the chest and diaphragm, both the descending aorta and inferior vena cava were incised, and the heart was held using a round-end forceps. Subsequently, the right ventricle was perfused with 7 mL of 60 mM EDTA buffer (pH = 7.4) to prevent blood coagulation and heart contraction. After clamping the ascending aorta, the left ventricle was perfused with 10 mL of EDTA buffer using a sterile 27 G syringe. The heart was then transferred to a dish containing perfusion buffer, and 3 mL of perfusion buffer was perfused into the apex of the left ventricle using a sterile 27 G syringe. The perfusion buffer (pH = 7.4) contained 130 mM NaCl, 5 mM KCl, 0.5 mM NaH2PO4, 10 mM HEPES, 10 mM glucose, 10 mM 2,3-butanedione monoxime (BDM), 10 mM taurine, and 1 mM MgCl2. To facilitate heart digestion, the heart was transferred to a dish with 10 mL of collagenase buffer, and 25–40 mL of prewarmed collagenase buffer was perfused into the apex of the left ventricle using a sterile 27 G syringe. Once digestion was completed, the clamp was removed, and the left ventricular portion was carefully separated using sharp scissors and transferred to a new 3 mL dish of collagenase buffer. The tissue was then gently teased apart into ~1 mm × 1 mm pieces, followed by gently mixing for 2 min using a 1 mL pipette. Finally, to inhibit further collagenase reaction, a stop buffer (10% fetal bovine serum) was introduced, and the cell suspension was passed through a 500 µm pore size strainer. After allowing the cells to settle by gravity and reintroducing calcium to the cells in the culture medium containing BDM, the isolated cardiomyocytes were subsequently resuspended and plated onto a laminin-precoated culture dish and maintained in a humidified culture incubator at 37 °C with 5% CO2.
Intracellular calcium measurement
Following the removal of BDM from the culture medium, cardiomyocytes were loaded with a Ca2+ indicator, using 5 µM of Fura-2-acetoxymethyl ester (Fura-2 AM) (TEF Labs, 0103), at temperature of 37 °C for a duration of 30 min. After rinsing with DPBS, the cardiomyocytes were observed with Nikon Eclipse Ti-E microscope, employing a 40× objective lens. Fluorescent images of Fura-2 were captured using dual excitation wavelengths of 340/380 nm (representing Ca2+ bound/Ca2+ free Fura-2, respectively), with an emission wavelength of 510 nm. These images were acquired at 5-s intervals. A baseline Ca2+ level was recorded for 2 min, following which the cells were subjected to exposure to estradiol (15 ng/ml) (Sigma-Aldrich, E2758-1G), progesterone (40 ng/ml) (Sigma-Aldrich, P8783-5G), and hydrocortisone (10 µg/ml) (Sigma-Aldrich, H4001-1G). Ionomycin (5 mM) (Sigma-Aldrich, 10634) was used as a positive control. To evaluate intracellular Ca2+ dynamics in cardiomyocytes during hypoxia, hypoxic condition was applied for 15 min in a hypoxic chamber (Embrient Inc, MIC-101) with 5% oxygen. Experimental data was then collected and calculated based on the ratiometric of Fura-2 fluorescent73. The fluorescent ratiometric before drug induction was used as the baseline, and the subsequent changes in fluorescent ratiometric from the drug treatment were normalized to the baseline.
Ectopic expression of PGRMC2
The mouse PGRMC2 adeno-associated virus (AAV) particles (Myc-DDK-tagged) (Cat#: MR217476A1V; Origene) were used to induce ectopic expression of PGRMC2 in the KO mice. A dose of 5 × 10¹² genome copies per KO mouse in 80 μL of saline was injected retro-orbitally into the venous sinus. After 4 weeks, the mouse hearts were isolated under isoflurane anesthesia, cardiomyocytes were extracted, and the Fura-2 studies were performed as mentioned above. The ectopic expression of PGRMC2 was confirmed with Western blot using a DDK rabbit monoclonal antibody (Origene, TA592569S; 1:3000) and a monoclonal anti-PGRMC2 antibody (Santa Cruz, 374624; 1:500).
Western blot analyses
To evaluate protein expression levels, we conducted Western blot analyses39. About 25-50 μg extracted proteins were loaded into 8–10% sodium dodecyl sulfate-polyacrylamide gel electrophoresis (SDS-PAGE) gel and transferred onto nitrocellulose membrane (PVDF) using the Transfer-Blot Turbo Transfer system (Bio-Rad, 1704150). The membrane was then blocked with 5% dry milk or bovine serum albumin followed by an incubation step with the primary antibodies to detect specific proteins expression. We used the following primary antibodies: monoclonal anti-PGRMC2 (Santa Cruz, 374624; 1:500), DDK rabbit monoclonal antibody (Origene, TA592569S; 1:3000), monoclonal anti-HIF-1α (Santa Cruz, 13515; 1:500), monoclonal anti-VEGF (Santa Cruz, 7269; 1:500), polyclonal anti-TGF-β1 (Abcam, 92486; 1:1000), polyclonal anti-TGF-β1 receptor (Abcam, 31013; 1:1000), monoclonal anti-p-PKC (Santa Cruz, 377565; 1:500), monoclonal anti-t-PKC (Santa Cruz, 8393; 1:500), monoclonal anti-p-AKT (Santa Cruz, 377556; 1:500), monoclonal anti-t-AKT (Santa Cruz, 81434; 1:500), monoclonal anti-p-MAPK (Cell Signaling, 4370, 1:1000), polyclonal anti-t-MAPK (Cell Signaling, 9102, 1:1000), monoclonal anti-p-SMAD2,3 (Cell Signaling, 8828, 1:1000), polyclonal anti-t-SMAD2,3 (Cell Signaling, 3102, 1:1000), monoclonal anti-t-PI3K (Cell Signaling, 4257; 1:500), monoclonal anti-p-PI3K (Cell Signaling, 17366; 1:500), rabbit monoclonal anti-GAPDH (Santa Cruz, 32233; 1:500), MitoBiogenesis Western Blot Cocktail (Abcam, 123545; 1:500). Anti-mouse HRP-tagged secondary antibody (Cell Signaling, 7076; 1:1000) and anti-rabbit HRP-tagged secondary antibody (Santa Cruz, 2357; 1:1000) were used accordingly. All antibodies were validated by the corresponding companies, per the information shown in their websites. The same membrane blots were used in all cases when comparing protein expressions and equal loading controls.
Enzyme-Linked Immunosorbent Assay (ELISA)
To evaluate the expression levels of ANP and BNP in cardiac tissue, heart tissues were isolated and subsequently homogenized using RIPA buffer that included the Halt protease inhibitor cocktail (Cat# 78425, Thermo Fisher, Inc.). Total protein concentration was then quantified using commercially available Bradford assay kit (Cat# PI23227; ThermoFisher Scientific, Inc.). The ANP and BNP levels were measured using a commercially available mouse ANP and BNP ELISA kit, respectively (LSBio, LS-F5225 and LS-F25183). In this process, the wells were initially coated with either ANP or BNP antibodies. Subsequently, tissue lysate samples were added into these wells, facilitating the binding of the target antigen (ANP or BNP) to the respective antibodies. After removing any unbound proteins through a washing step, a biotin-conjugated detection antibody was introduced to interact with the previously captured antigen. The avidin-tagged HRP conjugate was added to form a linkage with biotin. To enable color development, the TMB (3,3′,5,5′-tetramethylbenzidine) detection substrate was added and reacted with the HRP enzyme. The resulting color change was directly proportional to the amount of bound ANP or BNP. To terminate the reaction, a stop solution was introduced, and the optical density of each well was measured at a wavelength of 450 nm.
Heme assay
To determine the total intracellular heme levels, the heart was perfused with cold PBS. A 59 mg portion of the tissue was dissected into small pieces, washed with cold PBS, and homogenized in RIPA buffer using a mortar and pestle. The homogenate was further processed with a motor-driven Potter-Elvehjem Teflon homogenizer and sonication. Finally, the homogenate was centrifuged at 14,000 g for 15 min to remove tissue debris, and total heme was measured at 400 nm wavelength using a commercially available assay kit (Abnova, cat# KA1617) per manufacturer’s instructions.
Transcriptome analysis
To conduct RNA-Seq analysis, total RNAs from 3 WT and 3 KO mouse hearts were obtained. Total mRNA sequencing of WT and KO heart samples was conducted using the NovaSeq X Plus platform (Illumina) at the UCI Genomics High Throughput Facility (GHTF). Bioinformatic analysis was performed on RNA-Seq data by the Department of Bioinformatic at UCI to identify differentially expressed genes (DEGs). To further interpret the functional implications of the differentially expressed genes (DEGs) identified in KO heart tissues, data were analyzed with the use of QIAGEN IPA (QIAGEN Inc., https://digitalinsights.qiagen.com/IPA).
Statistical analyses
The analyses of the images were conducted using Nikon NIS-Element for Advanced Research software (Version 4.51). The same software was utilized for image acquisition, segmentation, and the reconstruction of 3D objects. To capture images in high resolution, a Photometric Coolsnap EZ CCD Monochrome Digital Camera was used with a 1392 × 1040 imaging array. Based on the region of interest (ROI) size and pixel intensity, binary masking techniques were applied to assess fibrosis, ventricular thickness, protein expression and localization. For Fura-2AM Ca2+ experiments, after defining the ROI, the 340/380 radiometric Ca2+ signals from isolated cardiomyocytes were calculated and normalized to the averaged of the first 10 timepoints of the Ca2+ baseline. Western blot quantification was carried out using NIH Fiji ImageJ (Version 2.1).
Emka Technology software (IOX V2.9) was used to assess and compute various cardiac functions. This software recorded the real-time data of electrical heart propagation, heart rate, preload, afterload, aortic pressure, and aortic outflow, left ventricle pressure and volume, and cardiac contractility. Subsequently, these datasets were utilized to derive parameters such as end-diastolic/systolic volume, stroke volume, cardiac output, and left atrial pressure changes. Further analyses were carried out using Microsoft Excel for MacOS (Version 16.78).
Quantitative data are presented as the mean ± standard error of the mean (SEM). The specific number of mice utilized in each experiment was detailed in the figure legends. Our statistical analyses were carried out using GraphPad Prism for MacOS (Version 10.1). To compare two sets of independent datasets, we applied a non-parametric student t-test, assuming a two-tailed distribution with no Gaussian assumption. When comparing three or more groups without matching datasets, we employed a non-parametric or mixed ordinary one-way ANOVA test. Following this, the mean of each group was compared to the mean of every other group using the Tukey post-hoc multiple comparison test, with an adjusted P-value accounting for multiple comparisons. In some cases, linear regression was performed to obtain a standard calibration curve and linear equation. A significant level of P < 0.05 was considered statistically significant.
Reporting summary
Further information on research design is available in the Nature Portfolio Reporting Summary linked to this article.
Responses