Pharmacological or genetic inhibition of LTCC promotes cardiomyocyte proliferation through inhibition of calcineurin activity

Introduction
Fetal cardiomyocytes (CMs) proliferate to achieve organ growth during development, but once matured, CMs typically become post-mitotic whereby they permanently exit the cell cycle1. As a result, the regenerative capacity of the heart is limited, which hinders the treatment of ischemic heart failure. Therefore, identifying the factors that control cell cycle arrest in CMs is crucial to re-initiate their dormant proliferative capacity. Calcium (Ca2+) is a critical regulator of CM function. During excitation-contraction coupling, Ca2+ enters CMs through the LTCC, triggering Ca2+ release from the sarcoplasmic reticulum (SR) through ryanodine receptors (RYR). Then, during relaxation, Ca2+ is transported back into the SR by the SR Ca2+-ATPase (SERCA) and out of the cell by the sodium-calcium exchanger (NCX) and the plasma membrane calcium ATPase pump (PMCA)2. Besides regulating contraction, Ca2+ signaling controls other activities, including gene expression and transcription, metabolism, survival, cardiac development, and maturation3,4,5,6,7. Therefore, investigating how cardiac Ca2+ handling impacts cell cycle activity will provide new insights into the role of Ca2+ signaling in cardiac regeneration. LTCC are initiators of Ca2+ cycling in CMs, and a recent study suggested that small molecule inhibition of LTCC activity is a potential target for induction of CM proliferation, although how this activates cell cycle activity is unknown8. The LTCC contains five subunits: the pore-forming subunit, α1, and different auxiliary subunits, α2, β, γ, and δ. The α1 subunit allows the passage of Ca2+ ions through LTCC into CMs, while the auxiliary subunits modify the function of the channel9. Ras-related associated with Diabetes (RRAD) is a member of the RGK family of Ras-related small G proteins and an endogenous regulator of LTCC activity. RRAD binds directly to the β subunit of the LTCC, thereby controlling LTCC current (ICa, L)10,11. Exogenous RRAD overexpression potently inhibits ICa,L in adult and embryonic ventricular myocytes11,12. However, whether RRAD impacts the ability of CMs to proliferate is still unknown. Recent studies have provided insights into the downstream impact of Ca2+ signaling, highlighting the role of the calcium-dependent serine/threonine phosphatase calcineurin in mediating cell-cycle arrest of postnatal CMs7,13. Calcineurin is associated with the plasma membrane in the vicinity of Ca2+ channels. Calcineurin directly links Ca2+ signaling to protein phosphorylation status upon increased intracellular Ca2+ and plays an essential role in numerous signaling processes14,15,16,17. This includes proliferation, where forced expression of activated calcineurin (CnA) causes a premature switch from hyperplasic to hypertrophic growth. In contrast, genetic ablation of calcineurin B prolongs the window of CM proliferation and induces the cell cycle in mature CMs partly through the induction of nuclear translocation of the transcription factor Hoxb137,13. In this study, we describe how pharmacological or RRAD-mediated inhibition of LTCC promotes CM division in vitro and in vivo through inhibition of calcineurin activity.
Results
Small molecule screen targeting proteins involved in CM Ca2+ cycling identifies nifedipine, an LTCC inhibitor, as an activator of the CM cell cycle
To assess how disruption of the Ca2+ transient impacts CM cell cycle activity, we performed a small molecule screen targeting proteins involved in CM Ca2+ cycling in our cell cycle matured human cardiac organoids (hCOs)18 (Supplementary Fig. 1a). hCOs were treated with different concentrations of nifedipine (LTCC inhibitor), ryanodine (RyR inhibitor), thapsigargin (SERCA inhibitor), or reduced extracellular Ca2+ levels ([Ca2+]e) for 48 h. Cell cycle activity was assessed using Ki-67 intensity (overall cell cycle marker). Only nifedipine induced cell cycle activity in mature hCOs, as indicated by a significant increase in relative Ki-67 intensity (Supplementary Fig. 1b–e). hCOs contractility was also assessed to confirm the effect of the small molecule on modulating the contractile function. Nifedipine caused a dose-dependent reduction in force of contraction (Supplementary Fig. 1f) and decreased [Ca2+]e also reduced force (Supplementary Fig. 1i). High dose ryanodine decreases the force and rate acutely, before force recovers and there are sustained increases in time from 50% activation to peak and time from peak to 50% relaxation over a longer timeframe (Supplementary Fig. 1g). Together this shows that there is an initial systolic force defect, prior to impairment on contractile kinetics due to impaired SR Ca2+handling. These effects have also been reported previously in larger mammals19 and is likely a compensation by the LTCC when sarcoplasmic reticulum Ca2+release is inactivated20,21. Thapsigargin destabilized contraction leading to loss of rhythm in some tissues and decreased force in others (Supplementary Fig. 1h). Then we performed a secondary validation for the top hit (nifedipine), which demonstrated a dose-response increase in the count of Ki-67 positive CMs nuclei which peaked at 3 μM and plateaued at higher concentrations (Fig. 1a, b). Furthermore, following 48 h of treatment with 3 μM nifedipine, hCOs demonstrated a significant increase in PHH3 positive CM nuclei (G2-M phase marker), and the count of NKX2.5 positive nuclei (CM nuclei marker) (Fig. 1c–e). To investigate if long-term exposure to nifedipine treatment would induce more CMs to enter the cell cycle, hCOs were treated with DMSO, 3μM nifedipine for 7 days (continues experiment) or treated with 3μM nifedipine for 2 days then recovered for 5 days (recovery experiment). After 7 days, Ki-67 positive CMs returns to baseline in both the continuous experiment and recovery experiment compared with DMSO-treated hCOs (Fig. 1f, g). These data are in line with our previous publications confirming that CMs enter the cell cycle transiently in the presence of cell cycle stimuli22,23.

a Representative images of hCOs treated with DMSO (vehicle) or nifedipine (1, 3 or 10 µM) for 48 h and stained against α-actinin (green), Hoechst (blue), and Ki-67 (red) (Scale bar 20 µm). b Bar graphs representing the percentage of CMs positive for Ki-67 (n = 9–14 hCOs from 2-3 experiments). c Representative images of hCOs treated with DMSO (vehicle) or nifedipine (3 µM) for 48 h and stained against α-actinin (green), Hoechst (blue), and Ki-67 (red) (Scale bar 20 µm). d Bar graphs representing the percentage of CMs positive for PHH3 (n = 13–14 hCOs from 4 experiments e Relative CM nuclei count based on NKX2.5 positive immunostaining (n = 24–25 hCOs from 3 experiments). f Schematic of the 7-day experiment with continuous (7-day) or 48 H (recovery) treatment with 3 µM nifedipine. g Overall cell cycle activity after continuous treatment or recovery. (Ctrl, DMSO; Rec, recovery; Cont, continuous) (n = 17–22 hCOs from 3 to 4 experiments). The relative data is normalized to DMSO-treated hCOs. Data are presented as mean ± SD with individual data points representing individual hCOs. *P < 0.05, **P < 0.01, ***P < 0.001, ****P < 0.0001.
We also confirmed our findings in primary CMs isolated from P7 mice pups (NMCM P7). NMCM P7 treated with 0.5 μM nifedipine showed a significant increase in PHH3 positive CM nuclei and CM nuclei number compared with vehicle-treated CMs (Supplementary Fig. 2). These data suggested that inhibition of LTCC using nifedipine promotes CM cell cycle induction in hCOs and primary CMs. These data are consistent with the previous work that showed nifedipine has an IC50 between 0.03 and 0.5 µM for blocking L-type calcium channels (LTCCs), with slight variations depending on tissue type and experimental conditions24,25,26,27. Interestingly, in our studies, we observed that nifedipine induces cell cycle activation at 0.5 µM in NMCM P7 and at 3 µM in cardiac organoids. The requirement of a higher concentration in cardiac organoids versus 2D culture is typical, as the drugs require diffusion throughout the tissue.
Single-cell RNA seq in P1 NMCM showed that RRAD, an endogenous inhibitor of LTCC, is highly expressed in spontaneously proliferating cardiomyocytes
As small molecule inhibitors have the possibility of off-target effects, we performed experiments to identify putative protein regulators of LTCC of which the expression correlated with proliferation. We performed single-single-cell RNAseq of P1 mouse CMs that had not yet exited the cell cycle (naturally proliferating) with and without induction of cell cycle activity using Cdk1/CyclinB1 and Cdk4/CyclinD1 complexes (referred to as “4 F”), which we have previously shown to induce cell cycle in CMs22,23. Gene expression data were collected from ~11000 cells/condition as summarized in UMAP blots (Fig. 2a). Cardiomyocyte specificity was confirmed based on the expression of cardiac markers (Tnnt2, Tnnc1, and Myh7) (Fig. 2b). A unique cell population in the LacZ treated (control) CMs expressed high levels of mitosis/cytokinesis genes (Mki67, Aurka, Aurkb, Top2, Ccna2, Pcna, E2f1, Cdc20, Plk1, and Anln); this population was identified as the spontaneously proliferating CMs (Fig. 2c, and Supplementary Fig. 3). Our recent publication revealed Cd36 as a marker for CMs that can be primed to proliferate22. Cd36 was highly expressed in the spontaneously proliferating CMs as well as the population of CMs that responded to 4 F cell cycle induction (Fig. 2d). Therefore, we divided CMs transduced with LacZ into 3 clusters: spontaneously proliferating CMs where mitotic genes were highly expressed, primed CMs which responded to forced cell cycle induction (4 F), and non-cell cycle active CMs that did not express cell cycle genes nor responded to cell cycle stimulation (Fig. 2e). When focusing on genes related to Ca2+ signaling, RRAD was identified to be highly expressed in the spontaneously proliferating and primed CM populations (Fig. 2f), and is a known endogenous specific inhibitor of the LTCC. These data suggest that RRAD expression positively correlates with CM cell cycle activity.
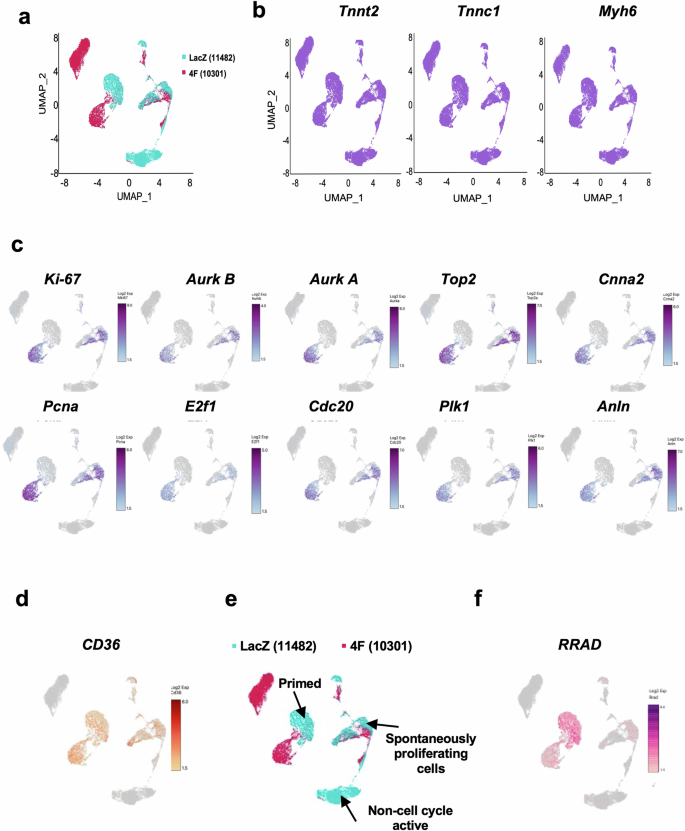
a UMAP plots displaying global gene expression for all single CMs sequenced 24 h post LacZ (control) or 4 F transduction (n = 11482, 10301 respectively). b All cells show high expression of the cardiac markers Tnnt2, Tnnc1, and Myh6, indicating a pure CM population. c P1 NMCM that showed high expression of mitotic/cytokinesis genes (Ki-67, Aurora Kinase B and A, Top2, Ccna2, Pcna, E2f1, Cdc20, Plk1, and Anln). d P1 NMCM showed high expression of Cd36, a marker for CMs that are more likely to respond to cell cycle stimulation. e Re-clustering based on the expression of the mitotic genes and the expression of Cd36 generated 3 clusters – the spontaneously proliferating CMs, primed CMs, and non-cell cycle active CMs f RRAD expression colocalized within the spontaneous proliferating CMs and the primed CMs.
RRAD overexpression promotes CM division in NMCM P7
To investigate the effect of RRAD overexpression on CM cell cycle induction, first, we transduced NMCM isolated from P7 mouse pups with LacZ (control) or RRAD adenovirus for 72 h. We confirmed RRAD overexpression in P7 NMCM using qRT-PCR and Western blotting (Supplementary Fig. 4a, b). RRAD overexpression promoted CMs to enter the cell cycle, as indicated by a significant increase in PHH3-positive CM nuclei compared with LacZ-treated CMs. A significant increase in NMCM P7 CM number was also observed in RRAD-overexpressing CMs compared to LacZ-control CMs (Fig. 3a–c). To confirm that RRAD overexpression promotes complete CM cell division, we assessed the expression of Aurora Kinase B, a cytokinesis marker, using immunostaining. NMCM P7 overexpressing RRAD showed a significant increase in CMs stained positive for Aurora Kinase B compared to the control NMCM (Fig. 3d, e). Moreover, RRAD overexpressing P7 NMCM showed a significant increase in gene expression of the cell cycle activators (cdk1, cdk4, ccnb, Ki-67, Aurora Kinase A and B) (Supplementary Fig. 4c). These results indicate that RRAD overexpression promotes CM cell division in P7 NMCM. To confirm that the effect of RRAD overexpression is through inhibition of LTCC, we transduced P7 NMCM with ShRNA-control-IL (Ctrl) or ShRNA-RRAD-IL (RRAD KD) integrating lentivirus for 24 h then treated with 0.5 μM nifedipine or vehicle for 72 h. RRAD Knockdown (KD) was confirmed using RT-PCR (Supplementary Fig. 5a). 0.5 μM nifedipine-treatment of Ctrl NMCM P7 significantly induced the CM cell cycle as indicated by a significant increase in PHH3 positive nuclei and the expression of cell cycle genes compared to vehicle-treatment of Ctrl NMCM P7. 0.5 μM nifedipine-treatment of RRAD KD P7 NMCM showed a significant reduction in the nifedipine-induced cell cycle as indicated by a significant reduction in the PHH3 positive nuclei, and the expression of cell cycle gene activator compared to 0.5 μM nifedipine -treated Ctrl NMCM P7 (Supplementary Fig. 5b–d). Furthermore, 0.5 μM nifedipine -treatment of P7 NMCM did not further increase PHH3 positive CM nuclei in NMCM P7 overexpressing RRAD (Supplementary Fig. 6). These data indicate that RRAD primarily acts through LTCC inhibition to activate proliferation.
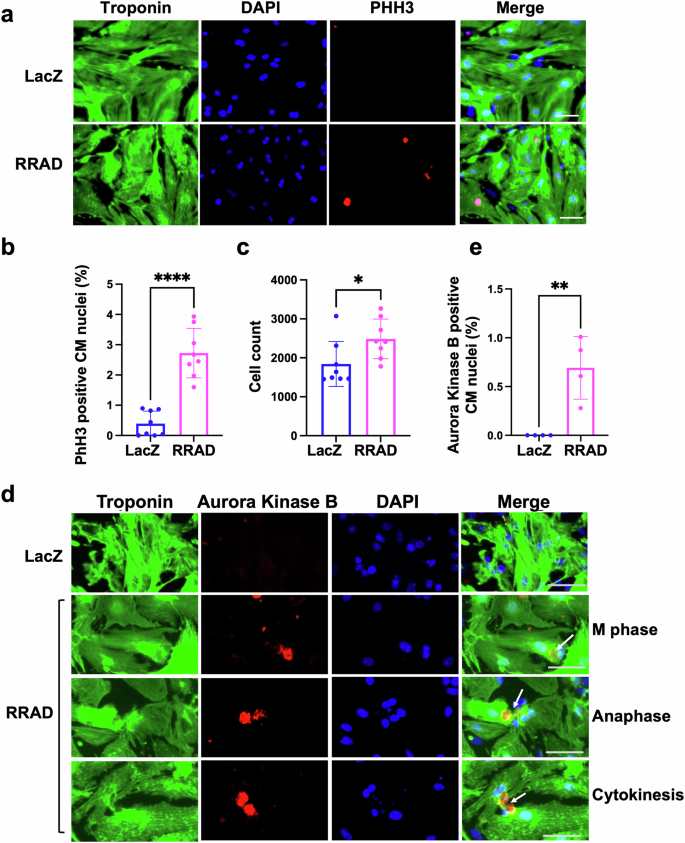
a Representative images of NMCM P7 transduced with LacZ or RRAD adenovirus and stained against troponin-T (green), PHH3 (red), and Dapi (blue) (Scale bar 100 µm). b Quantification of the percentage PHH3 positive CM nuclei (n = 8). c Quantification of CM counts (n = 8). d Representative images of NMCM P7 transduced with LacZ or RRAD adenovirus and stained against troponin-T (green), Aurora Kinase B (red), and Dapi (blue) (Scale bar 50 µm) arrows referes to the nucleous at different stage of cell cycle. e Quantification of the percentage Aurora Kinase B positive CM nuclei (n = 4). Data are presented as mean ± SD, *p < 0.05, **p < 0.01, ****p < 0.0001.
RRAD overexpression primes more CMs to proliferate in response to cell cycle stimuli
Overexpression of CCNA228, a combination of CCND and CDK4 (2 F)23, or a combination of CDK1/CDK4/CCND/CCNB (4 F)22,23 have been demonstrated to drive cell cycle induction in CMs. To examine whether RRAD can prime more CMs to respond to such cell cycle stimuli, NMCM P7 were transduced with RRAD or LacZ adenovirus for 24 h and subsequently transduced with adenoviruses encoding different cell cycle stimulators, CCNA2, 2 F, or 4 F for another 48 h. A significant increase in PHH3 positive nuclei (a marker for the G2-M Phase) and EDU positive nuclei (a marker for the G1-S Phase) compared with CCNA2, 2 F, or 4 F alone was observed (Supplementary Fig. 7). To test if RRAD overexpression has an additive effect on the cell cycle induction if RRAD is transduced at the same time or after 2 F or 4 F adenovirus transduction in vitro, NMCM P7 were transduced with 2 F, RRAD + 2 F, 4 F, or 4 F + RRAD adenovirus at the same time for 48 h or NMCM P7 were transduced with 2 F, 4 F adenovirus for 24 h and subsequently transduced with RRAD adenovirus for another 24 h. Our results showed that there is no significant additive effect of the RRAD overexpression if it is introduced with or after the cell cycle stimuli in vitro (Supplementary Fig. 8). These data suggests that inhibition of the LTTC through overexpression of RRAD is needed to prime more CMs to enter the cell cycle when stimulated by the 2 F or the 4 F. However, RRAD overexpression has no additive effect if added later as the cell cycle genes already started to exert their effect on the responsive population, therefore, the priming process through the RRAD overexpression is not effective anymore.
RRAD overexpression promotes CM cell division and primes more CMs to proliferate in response to cell cycle stimuli in adult human heart slices
Since NMCM P7 are not fully post-mitotic and do not completely mimic the characteristics of adult CMs, we examined the effect of RRAD overexpression on adult primary CMs ex vivo using human heart slices29 and in vivo using MADM mice. Human heart slices were infected with adenoviruses encoding LacZ or RRAD for 72 h. RRAD overexpression was confirmed using RT-PCR (Supplementary Fig. 9a). At 72 h post-infection, RRAD overexpression promoted cell cycle induction in human heart slices as indicated by a significant increase in CM nuclei stained positive for PHH3 versus LacZ-treated heart slices (Fig. 4a, b). To investigate the effect of RRAD overexpression on priming more CMs to enter the cell cycle in response to 2 F, human heart slices were infected with LacZ or RRAD adenovirus for 24 h and then infected with 2 F adenoviruses for 48 h. RRAD overexpression in human heart slices augmented more CMs to enter the cell cycle, as indicated by a significant increase in PHH3-positive nuclei compared to 2F-treated heart slices (Fig. 4a–c). To validate the mitotic entry of the adult CMs, human heart slices that overexpressed RRAD were stained for Aurora Kinase B. We observed a significant increase in CM nuclei stained positive for Aurora Kinase B compared to LacZ-control heart slices Furthermore, human heart slices that overexpressed RRAD in combination with 2 F showed a significant increase in CM nuclei stained positive for Aurora Kinase B compared to the heart slices that overexpressed 2 F alone (Fig. 4d–f). RRAD overexpression can thus effectively induce and prime mature primary human CMs to re-enter the cell cycle ex vivo.
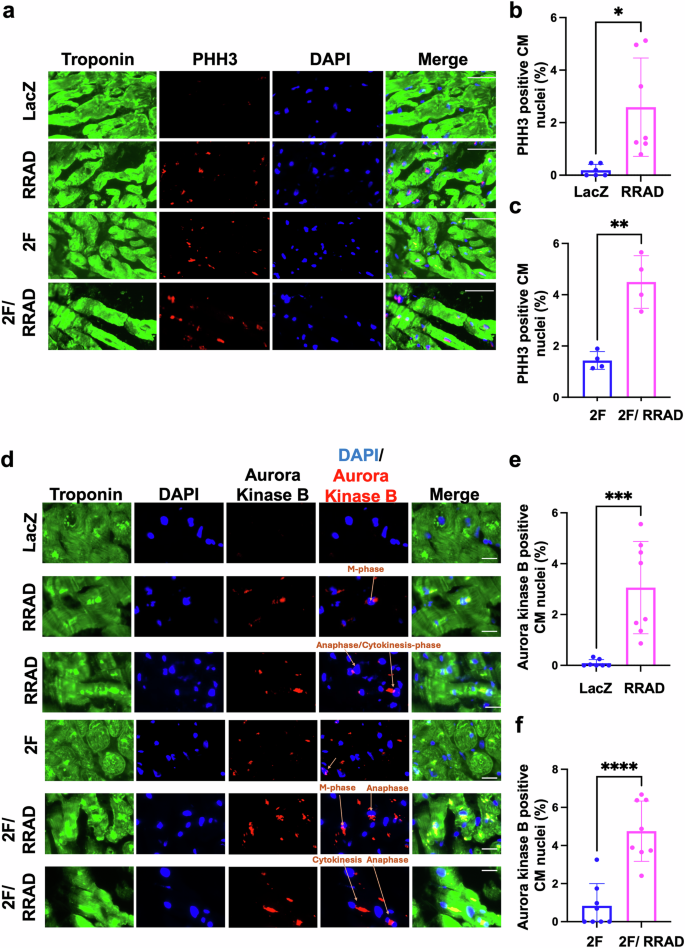
a Representative images of human heart slices transfected with LacZ or RRAD adenovirus for 24 h, then transfected with CDK4 and CCND (2 F) for 48 h and stained against troponin-T (green), PHH3 (red) and Dapi (blue) (Scale bar 20 µm). b–c Quantification of the percentage PHH3 positive CM nuclei (n = 4–6 individual slices). d Representative images of human heart slices transduced with LacZ or RRAD adenovirus for 24 h, then transduced with CDK4 and CCND (2 F) for 48 h and stained against troponin-T (green), Aurora Kinase B (red), and Dapi (blue) (Scale bar 20 µm). e, f Quantification of the percentage of Aurora Kinase B positive CM nuclei (n = 8). Data are presented as mean ± SD, *p < 0.05, **p < 0.01, ***p < 0.001, ****p < 0.0001.
RRAD overexpression promotes complete CM cell division and primes more CMs to proliferate in response to cell cycle stimuli in vivo
To investigate the effect of RRAD overexpression on CM proliferation and complete cytokinesis in vivo, a cardiomyocyte cytokinesis lineage-tracing animal model (inducible α-MHC-Cre::MADM-lineage-tracing) (MADM mice)22,23,30,31,32 was used. In these lineage-tracing mice, CMs that undergo cytokinesis produce daughter cells that are either red, green, yellow (red+green), or colorless, based on allelic recombination of fluorescent reporters; if the CMs fail to divide, they will remain double-colored (i.e., yellow), or colorless if no recombination occurs. Thus, the presence of single-colored red or green cells is a definitive indicator that these CMs have undergone complete cytokinesis. However, dividing CMs are underrepresented by single-colored CMs because double-colored (yellow) or colorless cells also could have divided. MADM mice were injected with either LacZ, RRAD, 2 F, or RRAD + 2 F adenoviruses (intramyocardially). Tamoxifen injection was carried out as described23, starting 24 h after the virus injection for 3 days to initiate recombination events. Mice were sacrificed 6 days after the viral infections, and hearts were sectioned to enumerate the cytokinesis events (Fig. 5a). RRAD overexpression was confirmed by RT-PCR (Supplementary Fig. 9b). Mice hearts in which RRAD was overexpressed showed a significant increase in the fraction of single-colored CMs compared to hearts injected with LacZ control virus and there is a positive correlation between RRAD expression in MADM mice and the proliferation events in MADM mice as determined by Pearson correlation coefficient (Supplementary Fig. 9c). Moreover, RRAD overexpression in combination with 2 F primed more CMs to proliferate, as indicated by a significant increase in single-colored CMs compared to 2F-treated hearts (Fig. 5b–d). These data demonstrate that RRAD overexpression promotes CM proliferation in vivo in the adult mouse heart.
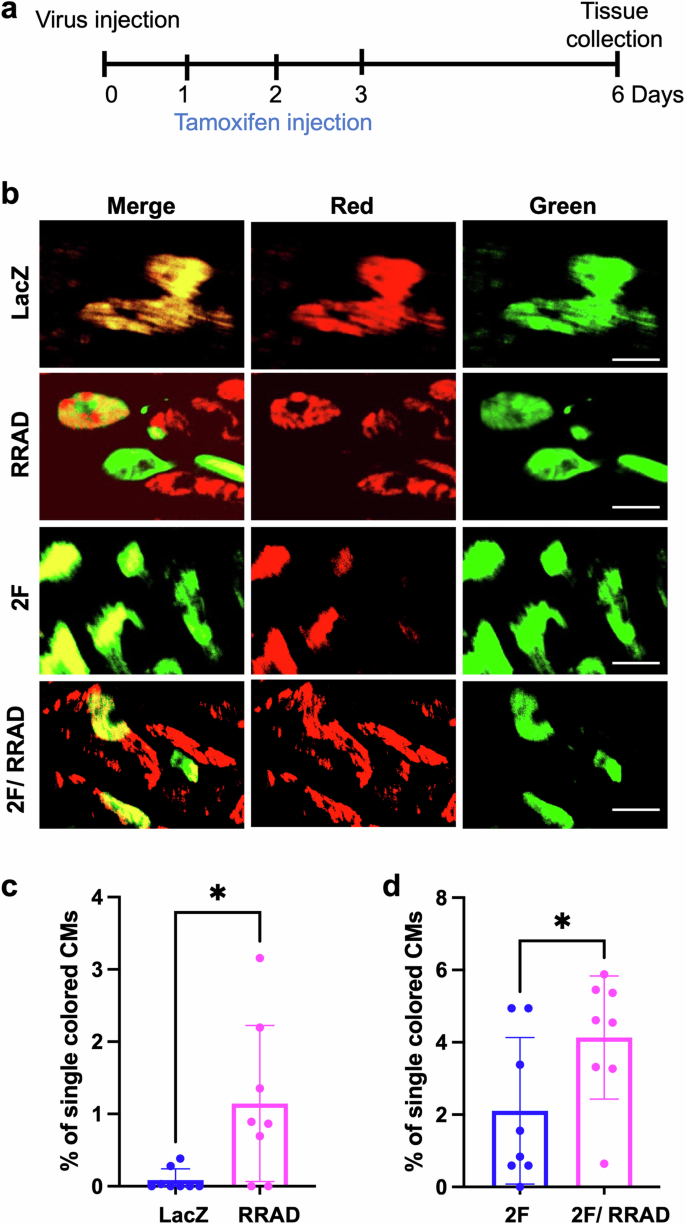
a Schematic diagram of the experimental design for MADM mice injection with LacZ, RRAD, CDK4/CCND (2 F), or RRAD/2 F. b Representative images show single-colored CMs of MADM mice hearts treated with LacZ, RRAD, CDK4/CCND (2 F), or RRAD/2 F (Scale bar= 20 μm). c Quantification of the percentage of the single-colored CMs to the total labeled CMs in LacZ or RRAD treated mice (n = 8), d 2 F or 2 F + RRAD treated mice (n = 8). Data are presented as mean ± SD. *p < 0.05.
Mechanistically, pharmacological or genetic inhibition of LTCC modulates calcineurin activity, which induces cell cycle activity in CMs
RRAD binds directly to the β subunit of the LTCC, thereby controlling LTCC current (ICa, L)10,11. Exogenous RRAD overexpression potently inhibits ICa,L in adult and embryonic ventricular myocytes11,12. It has also been demonstrated that RRAD knockout in CMs promotes LTCC current (ICa, L)33,34,35. In this manuscript, we showed that KD or overexpression in CMs increases or decreases the intracellular Ca2+amplitude, respectively (Supplementary Fig. 10a). Calcineurin is a Ca2+-dependent phosphatase enzyme localized in the plasma membrane in close proximity to the LTCC14,15,16,17. Recently, reduced calcineurin activity was reported to induce CM cell cycle activity7,13. To investigate the effect of RRAD overexpression on calcineurin activity, P7 NMCM were infected with LacZ or RRAD adenovirus for 72 h and examined for cellular calcineurin phosphatase activity. RRAD overexpression significantly reduced calcineurin phosphatase activity compared to LacZ control (Fig. 6a). The regulator of calcineurin (Rcan1) is an endogenous regulator of calcineurin activity. Expression of the Rcan1 is under calcineurin control and thus functions as a feedback inhibitor of calcineurin, and its expression is an indicator of calcineurin activity36. hCOs treated with 3 μM nifedipine had reduced Rcan1 expression (Supplementary Data 1). In P7 NMCM, RRAD overexpression or 0.5 μM nifedipine treatment significantly reduced Rcan1 mRNA expression compared to LacZ control (Fig. 6b, c). In vivo, mice transduced with RRAD adenovirus showed a significant reduction in Rcan1 expression as well (Fig. 6d). Hoxb13 is a downstream transcription factor dephosphorylated by calcineurin and then translocated to the nucleus to inhibit the cell cycle in CMs7. We observed significantly reduced Hoxb13 nuclear localization in P7 NMCM overexpressing RRAD and nifedipine-treated NMCM P7 (Fig. 6e–h), while RRAD KD in NMCM P7 showed a significant elevation of calcineurin activity as indicated by an increase of Rcan1 expression (Fig. 6c) and Hoxb13 translocation to the nucleus (Fig. 6g, h). Moreover, RRAD KD in NMCM P7 significantly elevated the nifedipine-mediated reduction in Rcan1 expression (Fig. 6c) and Hoxb13 translocation to the nucleus (Fig. 6g, h). These data suggested that pharmacological or genetic inhibition of LTCC enhances CM cell cycle entry via inhibition of the calcineurin-hoxb13 pathway.
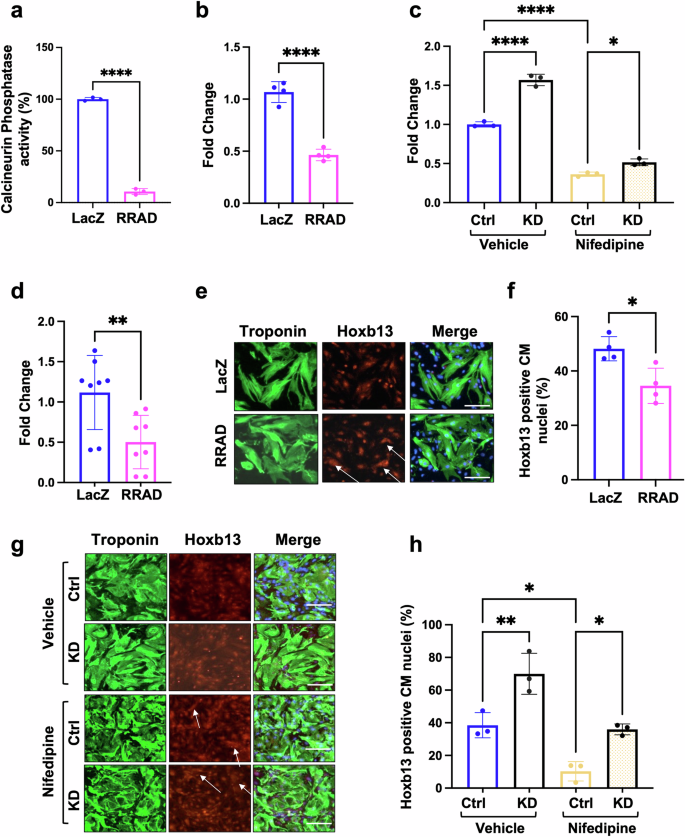
NMCM P7 transduced with LacZ or RRAD adenovirus for 72 h. a Quantification of the calcineurin phosphatase activity (n = 3). b Fold change analysis of the mRNA expression of (Rcan1) (n = 4). c Fold change analysis of the mRNA expression of (Rcan1) in NMCM P7 transduced with ShRNA-control-IL (Ctrl) or ShRNA-RRAD-IL (RRAD KD) for 24 h and then treated with vehicle or 0.5 mM nifedipine for 72 h (n = 3). d Fold change analysis of the mRNA expression of (Rcan1) in MADM mice transduced with LacZ or RRAD Adenovirus (n = 8). e Immunostaining against troponin-T (Green), DAPI (Blue), Hoxb13 (Red) in NMCM P7 transduced with LacZ or RRAD adenovirus for 72 h. (scale bar 100 μm). f Bar graph represents the percentage of Hoxb13 positive CM nuclei (n = 4). g NMCM P7 transduced with ShRNA-control-IL (Ctrl) or ShRNA-RRAD-IL (RRAD KD) for 24 h and then treated with vehicle or 0.5 mM nifedipine for 72 h and stained against troponin-T (Green), DAPI (Blue), Hoxb13 (Red) (scale bar 100 μm). h Bar graph represents the percentage of Hoxb13 positive CM nuclei (n = 3).
We next investigated the effect of LTCC inhibition on the calcineurin subcellular localization. It has been established that RRAD binds directly to LTCC at β subunit and regulates the LTCC activity11. To determine whether calcineurin is a component of the LTCC/RRAD macromolecular complex, we immunoprecipitated RRAD from mouse ventricular lysates and probed for calcineurin catalytic A (CnA), Ca2+-binding regulatory B subunits (CnB) and LTCC. Strong bands at ≈61 kDa (CnA), ≈17 kDa (CnB), ≈190 kDa (LTCC) were identified. Input from the cell lysate was used as a control (Supplementary Fig. 10b). These data are also in line with a previous publication that showed a direct binding between calcineurin and LTCC at α1 1,2 subunits37. This data suggested that LTCC/RRAD/calcineurin are localized in the same macro-complex at the plasma membrane. Calcineurin is activated in response to increases in Ca2+concentrations in the cell. CnA is primarily located in the cytosol. A-kinase anchoring protein-79 is known to bind inactive CnA and localize it to the plasma membrane in the vicinity of Ca2+channels38. To investigate if RRAD overexpression is anchoring calcineurin to the plasma membrane, thereby inactivating calcineurin, we quantified the expression of CnA and CnB to the plasma membrane and cytoplasm. P7 NMCMs were treated with nifedipine or transduced with RRAD Adenovirus for 72 h. Then a commercially available membrane protein extraction kit was used to separate the membranal protein and cytoplasmic protein. Western blot was used to determine the protein expression. GAPDH, a protein localized in the cytoplasm, and CD36, a membrane localized in the membrane were used to confirm the separation of membranal and cytoplasmic proteins. We found that there is no significant difference in the CnA and CnB protein expression in the membrane or cytoplasm in NMCM P7 treated with RRAD or nifedipine in comparison to control-treated NMCM P7 (Supplementary Fig. 10c–e). This data indicates that RRAD overexpression or nifedipine does not affect calcineurin localization and it is likely to inhibit the calcineurin activity by direct reduction of the LTCC-controlled membrane Ca2+.
Bulk RNA sequencing demonstrates that LTCC inhibition for 8 h actively regulates CM structural genes
To investigate the early transcriptional changes associated with LTCC inhibition, we conducted bulk RNAseq on hCOs treated with vehicle or 3 μM nifedipine for 8 h (5 individual hCOs per condition). Comparing the global gene expression, nifedipine-treated hCOs showed over 650 genes that were differentially expressed, of which 442 genes were down-regulated, and 219 genes were up-regulated (FDR < 0.05) (Supplementary Fig. 11a and Supplementary Data 1). The GO terms analysis reflects that the differentially regulated genes were mostly involved in cardiac function and sarcomere integrity (Supplementary Fig. 11b-c). Eleven of the top downregulated genes in nifedipine-treated hCOs were reported to be downstream transcriptional targets for Hoxb13/Meis17 (Supplementary Table 3, Supplementary Data 1). These data demonstrate that the early transcriptional changes following inhibition of LTCC are likely to be the consequence of inhibition of Hoxb13/Meis1 DNA binding as a downstream effect of calcineurin inhibition in CMs.
Interestingly, RRAD expression was significantly reduced in the presence of nifedipine which is likely a compensatory effect as it is not needed. We also observed that CACNA1D and CACNA1G gene expression were significantly upregulated in hCOs treated with nifedipine compared to vehicle-treated hCOs. The upregulation of CACNA1D and CACNA1G and downregulation of RRAD in nifedipine-treated hCOs is an indication of a compensatory mechanism associated with the inhibition of LTCC (Supplementary Table 4).
RRAD overexpression did not affect non-cardiomyocyte proliferation
To assess the effect of LTCC inhibition on non-cardiomyocyte cell cycle induction, isolated cardiac fibroblasts were treated with 5 ng/mL TGF-β to induce activation to myofibroblasts for 24 h. Then both fibroblasts or myofibroblasts were transduced with RRAD adenovirus or LacZ (control) for 72 h. The activation of myofibroblasts was confirmed by increased α-smooth muscle actin expression (Supplementary Fig. 12a,b) and RRAD overexpression was confirmed using RT-PCR (Supplementary Fig. 12c, d). Cardiac fibroblasts or myofibroblasts overexpressing RRAD showed no increase in PHH3 positive nuclei nor the expression of cell cycle genes which indicates that RRAD did not induce cardiac fibroblast or myofibroblast proliferation (Supplementary Fig. 12e–h). Moreover, RRAD overexpression in fibroblast or myofibroblast did not affect the LTCC expression or Rcan1 expression, a downstream target of calcineurin activity (Supplementary Fig. 12i–n). The same results were observed in hCOs, as hCOs treated with 3 μM nifedipine showed no significant difference in the number of non-CMs nuclei or Ki67 positive non-CMs nuclei compared with vehicle-treated hCOs (Supplementary Fig. 12o,p). This data indicates that this signaling pathway is not necessarily controlling the cell cycle activity in non-cardiomyocytes.
Ectopic expression of RRAD/CDK4/CCND improves cardiac function and reduces scar size post-myocardial infarction
Our in vitro and in vivo data suggested that RRAD overexpression induces and primes more CMs to enter the cell cycle in response to cell cycle stimuli. To investigate the effect of RRAD overexpression in improving cardiac function post-myocardial infarction (MI), adult mice were subjected to permanent ligation of the anterior descending coronary artery (LAD) to induce MI. One week later, LacZ, RRAD, CDK4/CCND (2 F), or RRAD/CDK4/CCND (RRAD 2 F) viruses were injected into the peri-infarct region of the heart. Mice were followed for four weeks and then sacrificed, and the cardiac tissue was processed and analyzed (Fig. 7a). RRAD, CDK4, CCND expression was assessed by RT-PCR (Supplementary Fig. 13). The RRAD-treated mice did not show a significant improvement in cardiac function (left ventricular ejection fraction (EF) and fractional shortening (FS)) nor reduction in the scar size four weeks post-viral injection compared to the LacZ treated mice as assessed by blinded echocardiography (Fig. 7b, d, f, h, j, k). However, RRAD/2 F treated mice showed a significant improvement in heart function (EF, FS) and a significant reduction in the scar size compared to control LacZ or 2 F hearts which is likely due to regeneration of new myocardium (Fig. 7c, e, j, l). Moreover, we compared the change in EF in each animal before and after the treatment (delta EF = EF 4 weeks post virus injection- EF before virus injection (1 week Post MI)) to detect the improvement of cardiac function per animal. RRAD/2 F group showed 7-10 points increase in the EF and FS 4 weeks post-treatment. While the 2 F or lacZ treated groups showed a decline in cardiac function 4 weeks post-treatment (Fig. 7f–i) and (Supplementary source data 2). These data indicate that ectopic expression of RRAD alone is not sufficient to improve cardiac function following an MI while ectopic expression of RRAD/2 F leads to improved cardiac function post-MI, likely through an increase in cell cycle activity level.
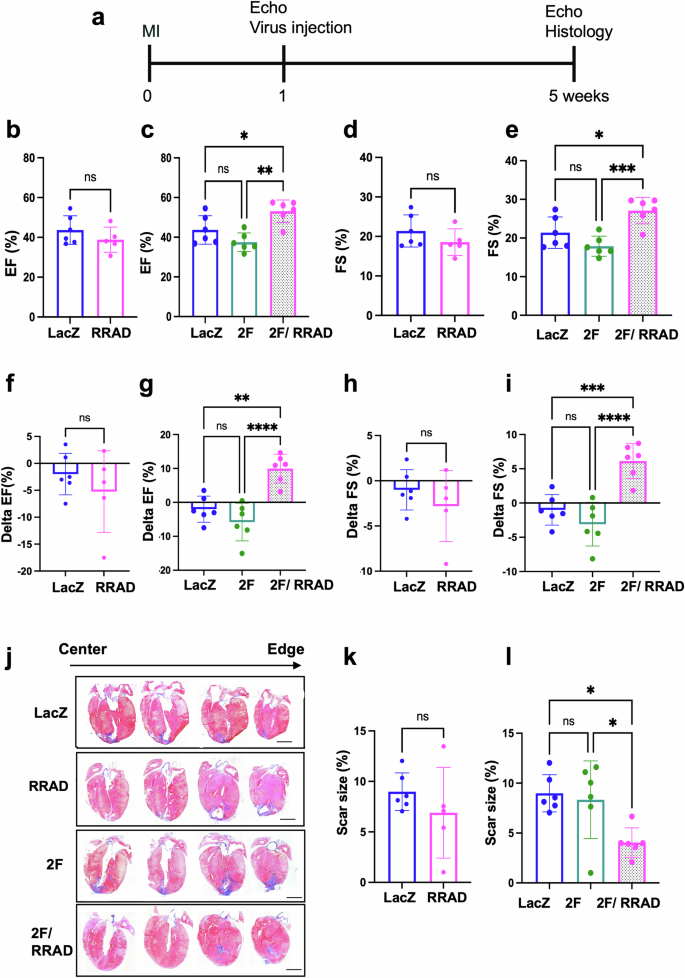
a schematic diagram of the experimental design. Echocardiography assessment of b, c EF%, d, e FS%, f, g delta EF, h, i delta FS (4 weeks post virus injection- 1 week post MI). (n = 5–6 mice per group, *p < 0.05, **p < 0.01, ***p < 0.001, ****p < 0.0001, error bars indicate S.D.). j Representative images of mice hearts were stained with Masson’s trichrome stain (healthy myocardium stains red and fibrotic tissue stains blue) at the end of the experiment (scale bar= 2 mm). k, l The scar size quantification as a percentage of total heart tissue (n = 6 mice per group, 12–13 heart sections per animal, *p < 0.05, error bars indicate S.D.). (delta function = cardiac function 4 weeks post virus injection- cardiac function before virus injection (1 week Post MI)).
Discussion
Activating the CM cell cycle to regenerate functional myocardium remains an aspirational goal. Understanding the molecular mechanisms controlling the CM cell cycle may unlock new strategies to achieve this goal. We and others have shown that contractility precludes cell cycle induction in CMs22,39,40,41, but the underlying mechanism is not clear. Ca2+ is a critical regulator of CM contractility and also plays a vital role in other cellular processes, including cell adhesion, gene transcription, metabolism, and survival3,4,5,6,7. Our previous study demonstrated that genes involved in CM contractility and Ca2+ cycling are downregulated during forced cell cycle induction using 4F22, suggesting an association between these processes. However, we and others have not yet defined the mechanisms behind this relationship. Our current study suggests that inhibition of Ca2+ influx through LTCC promotes cell cycle induction by deactivating calcineurin activity, which enhances cell cycle gene expression in CMs. Thus, inhibition of LTCC could be a putative target for developing new therapies to induce CM proliferation and regeneration.
Here, we demonstrate that reducing Ca2+ influx through inhibition of LTCC (nifedipine) or reducing the Ca2+ concentration in the media attenuates CM contractile function. Yet only nifedipine induced the CM cell cycle. These results are in line with a recent study that screened several drugs to assess the proliferation of human-induced pluripotent stem cell-derived CMs. They showed that LTCC blockers from multiple chemical classes are among the most potent drivers of proliferation8. In the present study, we incorporated more mature in vitro and in vivo cardiac models which is critical for the development of regenerative strategies, and focused on gaining mechanistic insights to enhance our understanding of how cardiac cell cycle dynamics are mediated by LTCC inhibition. Another study also demonstrated that the inactivation of the β-AR signaling, an upstream regulator of LTCC activity, increases CM division in neonatal mice40. Thus, the LTCC itself seems to be an important regulator of the response.
In our study we have uncovered how LTCC activity controls proliferation. Our single-cell RNAseq data from P1 NMCM demonstrated that RRAD, which is an endogenous inhibitor of LTCC, is highly expressed in spontaneously proliferating and primed CM populations. RRAD was originally identified in the skeletal muscle of patients with type 2 diabetes mellitus42,43. RRAD in CMs binds directly to LTCC β -subunits and controls LTCC current (ICa, L) in CMs10,11. Modulation of RRAD expression and its impact on cardiac Ca2+ handling has been extensively studied. Deficiency of RRAD function in CMs leads to an increased ICa, L33,34,35. Dominant negative suppression of RRAD (S105N) led to an increase in ICa, L and prolonged the action potential via upregulation of LTCC channel expression in the plasma membrane of guinea pig ventricular CMs44. Moreover, RRAD cardiac-specific KO hearts exhibited enhanced cytosolic Ca2+ flux, increased contractile function, elevated sarcoplasmic/endoplasmic reticulum calcium ATPase 2 (SERCA2a) expression, and faster lusitropy33. In contrast, RRAD overexpression inhibits the ICa,L in adult and embryonic ventricular myocytes11,12. RRAD has also been involved in regulating Ca2+ dependent signaling in the heart where it modulates cardiac hypertrophy through modulation of the calcium-calmodulin-dependent protein kinase II (CAMKII)45. Moreover, a recent study reports that RRAD expression is increased at the border zone following myocardial infarction in human hearts46 while other studies reported that RRAD protein levels fall in patients with end-stage non-ischemic heart failure (heart failure with reduced ejection fraction, HFrEF)34, and in a mouse model of cardiac hypertrophy45. RRAD thus plays an integral role in cardiac signaling and homeostasis.
The small molecule screen as well as the single cell transcriptomics data both suggested the role of LTCC-RRAD in regulating cell cycle induction. However, to avoid potential off-target effects of a small molecule47,48,49,50, we preferred to continue studying the role of LTCC in cell cycle induction through manipulating its activity using RRAD overexpression. The direct genetic manipulation of LTCC was not possible as genetic deletions of the LTCC α1C or the β2 encoding genes result in embryonic lethality with heart dysfunction51,52. In addition, genetic ablation of the LTCC complex may disrupt the function of proteins that physically interact with LTCC and result in an off-target effects53,54,55. Therefore, overexpression of RRAD, which explicitly inhibits ICa, L, enabled validation of the role of Ca2+ influx through LTCC on CM cell cycle induction. Given that CMs are prone to undergo binucleation, we specifically studied late cell cycle stages, including G2-M and cytokinesis, to confirm complete cell division. We used PHH3 expression as a marker for the G2-M phase and Aurora Kinase B to identify CMs that entered cytokinesis. RRAD overexpression in vitro (P7 NMCM) and ex-vivo (human heart slices) demonstrated that RRAD indeed promotes CM proliferation through mitosis and cytokinesis. Using MADM mice hearts, we demonstrated that RRAD overexpression induces complete CM cytokinesis and cell division in vivo as well. MADM mice are α-MHC-Cre::MADM-lineage-tracing mice that are widely used to prove complete cell division in vivo22,23,30,31,32. Using MADM mice hearts, we demonstrated that RRAD overexpression induces complete CM cytokinesis and cell division in vivo. RRAD adenovirus was injected directly into the heart at a minimum dose, and no mortality was observed during the current experiment.
Ca+2 influx through LTCC regulates several signaling pathways, including calcineurin activity14,15,16,17,54,56. We observed reduced calcineurin activity and nuclear localization of Hoxb13 following RRAD overexpression. It was recently reported that calcineurin is colocalized and interacts with LTCC37 and that calcineurin plays a role in CM cell cycle arrest7,13. Inducible CM-specific deletion of calcineurin B1 in adult CMs promotes mitotic entry, improves cardiac function, and reduces scar size after myocardial infarction. Moreover, a small molecule inhibitor for calcineurin, FK506, promotes CM proliferation. However, FK506 fails to improve cardiac function or reduce scar size after MI due to inhibition of vasculogenesis and blunting of the post-MI inflammatory response13. Calcineurin acts by dephosphorylating Hoxb13 at serine-204 causing translocation to the nucleus and leads to cell cycle arrest. Expression of both calcineurin and Hoxb13 are significantly higher in p7 postnatal CMs, which coincides with cell cycle arrest during development. These reported data, in combination with our current study, further establish the role of the calcineurin/Hoxb13 axis in regulating CM cell cycle activity.
Hoxb13 acts as a cofactor of Meis1, which is a three amino acid loop extension (TALE) family homeodomain transcription factor. Meis1 translocates to CM nuclei shortly after birth and mediates postnatal cell cycle arrest. Adult Meis1-Hoxb13 double-knockout hearts showed a significant increase in the CM mitosis and sarcomere disassembly, which improved left ventricular systolic function following myocardial infarction7. Our bulk RNA sequencing investigating the early transcriptional changes associated with LTCC inhibition by nifedipine also suggested sarcomere remodeling. We observed downregulation of genes responsible for cardiac structure, integrity, and sarcomere assembly, many of which are downstream transcriptional targets for Hoxb13/Meis17 (Supplementary Table 3). This suggested that the early transcriptional changes post LTCC inhibition were associated with downregulation of Hoxb13/Meis1 transcriptional program in CMs.
The role of RRAD in regulating LTCC activity and its effect on cardiac function has been discussed using RRAD Knock mouse models. The RRAD Knockout mice showed a significant increase in the LTCC activity which results in increasing cardiac contraction in healthy mice. Then following MI, RRAD Knockout mice had reduced mortality and contractile dysfunction. This resulted in less stress and a reduction in scar formation due to the reduction in the acute inflammatory response of neutrophil extravasation along with a decrease in inflammatory cytokine signaling57,58. Hence, activating the LTCC would be a target to prevent/protect against MI due to its hyper-contractility and anti-inflammatory response. Potentially, it could be effective after MI to increase function, but this had not yet been explored. In this manuscript we reported for the first time the effect of LTCC on regeneration and restoration of lost cardiomyocytes after MI rather than a protective effect. We extensively showed the effect of RRAD overexpression and how it led to LTCC inhibition, regulation of calcineurin activity and Hoxb13 nuclear translocation to induce CM proliferation.
The overexpression of RRAD after MI had no detrimental impact on cardiac function, potentially due to infection of only a fraction of the cardiomyocytes by the adenovirus. This aligns with potential translational strategies, where transient expression in a fraction of cardiomyocytes would be required. Our study is a proof-of-concept, clearly demonstrating that inhibition of LTCC is a putative cardiac regeneration strategy when combined with 2 F.
Nifedipine treatment to hCOs showed no significant enhancement in their cell cycle activity in non-CMs compared to the control group. The absence of cell cycle activation (Ki-67) in the non-CM population in the hCOs (NKX2.5 negative nuclei) suggests that nifedipine does not impact non-CM cell cycle activity despite LTCC expression in these cells albeit at a lower level59. In addition, RRAD overexpression on cardiac fibroblasts or myofibroblast did not show any significant activation of cell cycle. Although we infected the cardiomyocyte, the fibroblasts or myofibroblast with 1 MOI of the RRAD adenovirus for 72 h. Unlike cardiomyocytes, fibroblasts or myofibroblast are proliferating cells, so over time the adenovirus is diluted via proliferation. Therefore, the fold increase in expression in fibroblasts is likely to be lower than the cardiomyocytes over time.
Another publication60,61 showed that inhibition of LTCC activity in cardiac progenitor cells, and vascular smooth muscle cells exhibits an inhibitory effect on cell cycle activity. Our findings confirmed the unique role of Ca2+ signaling in the CMs due to the fact that Ca2+ is also involved in excitation contraction coupling in CMs as well as in signaling. This novel mechanism that we are reporting is very specific for the post-mitotic CMs as evidenced by the lack of response in the primary cardiac fibroblasts and the non-CMs within the same hCOs.
In conclusion, we demonstrate that pharmacological or genetic inhibition of Ca+2 influx through LTCC is an upstream regulator of the calcineurin/Hoxb13 axis and stimulates cell cycle activity in CMs in vitro and in vivo (Fig. 8). A novel combination of RRAD/CDK4/CCND is a promising approach in induce CM proliferation in vivo and improve cardiac function post MI.
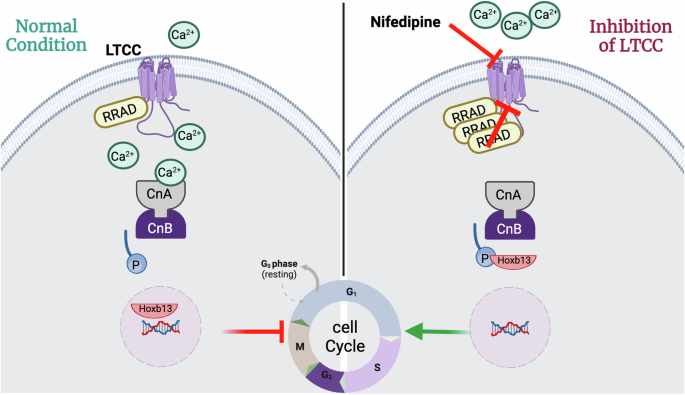
Schematic diagram of the mechanism by which LTCC inhibition by RRAD or nifedipine promotes CM proliferation.
One of the major limitations of altering intracellular Ca2+ levels is the clinical applicability of such an approach in treating ischemic heart failure in humans. Future work is needed to examine the effect of the transient expression of RRAD/CDK4/CCND on cardiac function and scar size after myocardial infarction. This will first need extensive optimization of a dose of RRAD overexpression that transiently inhibits the LTCC current without a major effect on the contractile function while simultaneously inducing CM proliferation for a short time. This could potentially be achieved through modified RNA delivery, which would be transient, and dose controlled. Future research is needed for further optimization of dosing and pharmacokinetics of different approaches to a genetically or pharmacologically inhibit LTCC in preclinical animal models and humans to develop new therapeutics for ischemic heart failure.
Methods
Human embryonic stem cells
Ethics approval for the use of the human embryonic stem cell (hESC) line Hes3 (female) (WiCell) was obtained from QIMR Berghofer’s Ethics Committee (2014000801 and P2385) and according to the declaration of Helsinki. Parents consented to obtain the human embryonic stem cells from the fetus. All work was performed per the National Health and Medical Research Council of Australia (NHMRC) regulations. hESCs were maintained on Matrigel-coated flasks (Cat#NUNC156367, Corning) in mTesR+ ([Cat#05825, Stem Cell Technologies) and passaged every 2-3 days using RelesR (Cat#05872, Stem Cell Technologies).
Cardiac differentiation
hESC was differentiated into cardiac cell types using previously published protocols18,62,63,64,65,66. This differentiation process generates multi-cellular cultures consisting of CMs ( ~ 70%) and stromal cells ( ~ 30%). hESC (seeded at 2 × 10⁴ cells/cm2) were prepared for differentiation by culturing in mTeSR-1 medium (Stem Cell Technologies) for 4 days. Differentiation into cardiac mesoderm was initiated by changing the culture media to RPMI B27- medium (RPMI1640 GlutaMAX (Cat#61870-036) + 2% B27 supplement without insulin (Cat#A1895601), 200 mM L-ascorbic acid 2-phosphate sesquimagnesium salt hydrate (Cat#A8960-5G, Sigma) and 1% Penicillin/ Streptomycin (Cat#10378-016) (all ThermoFisher Scientific unless otherwise indicated)) containing 5 ng/mL BMP-4 (Cat#RDS314BP050CF, RnD Systems), 9 ng/mL Activin A (Cat#RDS388AC050, RnD Systems), 5 ng/mL FGF-2 (Cat#RDS233FB025, RnD Systems) and 1 mM CHIR99021 (Cat#73042, Stem Cell Technologies) (day 0). Media was changed daily on days 1 and 2, after which specification into a hESC-CM/stromal cell mixture using RPMI B27- containing 5 mM IWP-4 (Cat#72554, Stem Cell Technologies) was induced (day 3). On day 6, the medium was changed to RPMI B27+ medium (RPMI1640 GlutaMAX + 2% B27 supplement with insulin (Cat#17504044), 200 mM L-ascorbic acid 2-phosphate sesquimagnesium salt hydrate and 1% Penicillin/Streptomycin) with medium exchange every 2–3 days for 7 days (until day 13). The differentiated cells were then cultured in RPMI B27+ medium until harvest on day 15 of the differentiation protocol. Cardiac cell types were released from the culture flask using 0.2% collagenase type I (Cat# C0130, Sigma) in 20% fetal bovine serum (FBS) in PBS (with Ca2+ and Mg2 + ) for 60 min at 37 °C, followed by 10 min in 0.25% trypsin-EDTA (Cat# 2500-072, ThermoFisher Scientific). Deactivation of trypsin-EDTA was performed using a-MEM GlutaMAX (Cat# 32561-037, ThermoFischer Scientifi), 10% FBS (Cat#10099-141, ThermoFischer Scientific), 200 mM L-ascorbic acid 2-phosphate sesquimagnesium salt hydrate, and 1% Penicillin/Streptomycin at equal volumes. Cells were then filtered using a 100 mm mesh cell strainer (BD Biosciences) and counted using a hemocytometer.
Heart Dyno hCO production
To produce hCOs, the cardiac cell types were seeded into heart dyno culture inserts18. These inserts were produced using standard SU-8 photolithography and PDMS molding practices. Each insert, with two PDMS poles that guide hCO formation, was glued into a well of a 96-well plate. hCOs were produced by mixing 5×10⁵ cells in base medium (a-MEM GlutaMAX (ThermoFisher Scientific), 10% fetal bovine serum (FBS) (ThermoFisher Scientific), 200 mM L-ascorbic acid 2-phosphate sesquimagnesium salt hydrate (Sigma) and 1% Penicillin/Streptomycin (ThermoFisher Scientific)) with bovine acid-solubilized collagen I (Cat# 01PA006, Devro, 2.6 mg/mL final concentration), which was salt balanced and pH neutralized with 10X DMEM (Cat#12100046, ThermoFisher Scientific) and 0.1 M NaOH, respectively, and Matrigel (Cat#FAL354277, 9% final concentration). The mixture and culture plate were kept on ice while 3.5 μL was seeded into each heart dyno insert, which had been coated with 3% bovine serum albumin (Cat#A9418, Sigma) in PBS. The 96-well plate was centrifuged for 10 sec at 100 × g before placing the plate in the incubator (37 °C, 5% CO2) for ~45 min to let the mixture gel. Subsequently, 150 μL base medium was added, and hCOs were cultured for 2 days, during which hCO condensation occurred. The medium was then changed to maturation medium (MM), which consists of DMEM without glucose, glutamine, and phenol red (Cat# A11430-01, ThermoFisher Scientific) supplemented with 4% B27- (without insulin) (ThermoFisher Scientific), 1% GlutaMAX (Cat# 3505-061, ThermoFisher Scientific), 200 mM L-ascorbic acid 2-phosphate sesquimagnesium salt hydrate and 1% Penicillin/Streptomycin (ThermoFisher Scientific), 1 mmol/L glucose and 100 mmol/L palmitic acid (Cat# P0500, Sigma) (conjugated to bovine serum albumin within B27 by incubating for 2 h at 37 °C) (media change every 2–3 days) to induce hCO maturation through induction of a metabolic switch to oxidative metabolism18. Following 7 days of maturation, the medium was changed to weaning medium (WM) (4% B27- insulin, 5.5 mM glucose, 1 nM insulin (Cat#12585014, Sigma), 200 mM L-ascorbic acid 2-phosphate sesquimagnesium salt hydrate, 1% penicillin/streptomycin, 1% GlutaMAX (100×), 33 mg/mL aprotinin (Cat# HY-P0017-500MG) and 10 mM palmitate (conjugated to bovine serum albumin in B27) in DMEM without glucose, glutamine and phenol red) to mimic the mature metabolic environment of the heart in vivo66. hCOs were cultured in WM for at least 7 days with media changes every 2–3 days until experimental treatments. All experimental treatments were performed for 48 h in WM, after which hCOs were fixed.
Functional analysis
Live videos of 10 s (50 frames per second) were obtained using the Leica Thunder microscope with climate control (37 °C, 5% CO2). From these videos, the deflection of the PDMS poles in the heart dyno insert can be measured using a custom-written MatLab script (MATLAB R2013a (Mathworks))18 which provides readouts of multiple functional parameters, including force, rate, activation, and relaxation time.
Immunocytochemistry for hCOs
hCOs were fixed in 1% paraformaldehyde for 1 h at room temperature and washed 3× with PBS. To stain the hCOs, they were incubated in blocking buffer (5% FBS and 0.2% Triton X-100 (T8787, Sigma) in PBS) for at least 2 h at 4 °C on a rocker. The hCOs were then incubated with the primary antibodies (Supplementary Table 1) overnight at 4 °C on a rocker. The next day, hCOs were washed with blocking buffer 2x for at least 2 h at 4 °C on a rocker before incubating with secondary antibodies (Supplementary Table 1) overnight at 4 °C on a rocker. hCOs were rewashed in blocking buffer (2X) for at least 2 h before imaging. hCOs were imaged while still in the heart dyno plate in either PBS or fructose–glycerol clearing solution (60% (vol/vol) glycerol (G2025, Sigma) and 2.5 M fructose (F0127, Sigma)). Whole hCO images were obtained using the Leica Thunder (5× or 20× magnification). For higher magnification, hCOs were mounted on slides in ProLong Glass mounting media (P36980, ThermoFisher Scientific). The Zeiss 780-NLO Point Scanning Confocal Microscope was used to obtain detailed images at 63× magnification. For initial screening purposes, whole hCO intensity was measured using custom batch processing files in MATLAB R2013a (Mathworks) to remove the background, calculate the image intensity, and export the batch data to an Excel (Microsoft) spreadsheet. To quantify Ki-67 or pHH3 positive CM nuclei, three random images were obtained per hCO. Ki-67 positive or PHH3 positive CM cells were manually quantified by counting the total number of nuclei that co-localized with α-actinin and the total number of Ki-67 or PHH3 positive nuclei. The numbers of the three images per tissue were combined to calculate the percentage of Ki-67 or PHH3 positive nuclei per hCO. Quantification of the number of CM nuclei (NKX2.5 + ) in hCOs was done on 6 merged 20× Tilescan images. These images were analyzed using a custom-built Strataquest application (version 7.1.1.129) from TissueGnostics.
Bulk RNA Sequencing
RNA extraction and library preparation
hCOs were treated with nifedipine or DMSO (vehicle control) for 8 h (n = 5 hCOs per condition). hCOs were washed with PBS, lysed, and stored at −80 degrees. RNA extraction was conducted using the NucleoMag 96 RNA kit (Macherey-Nagel) on the EpMotion 5075t. RNA was quantified using the Qubit RNA High Sensitivity Assay (Invitrogen). RNA integrity was assessed using the 4200 TapeStation with the High Sensitivity RNA ScreenTape kit (Agilent). Samples were normalized to ≤100 ng RNA using nuclease free water in a total of 25 µl. Poly(A)-enriched RNA libraries were prepared using the Illumina Stranded mRNA Prep, Ligation (96 Samples), and the IDT for Illumina RNA UD Indexes Set A (Integrated DNA Technologies). Libraries were quantified using the Quant-iT dsDNA broad range (BR) assay kit (Invitrogen). The quality of libraries was assessed using the 4200 TapeStation with the D1000 ScreenTape kit (Agilent). Single-end 100 bp sequencing was conducted on the NovaSeq 6000 (Illumina).
Read mapping and quantification
Basecalling and adapter trimming was completed on BaseSpace (Illumina). ‘FastQC’ (version 0.11.9) was run for quality control. Reads were aligned using ‘STAR’67 (version 2.7.9a) to the GRCh38 assembly with the gene, transcript, and exon features of the Ensembl (release 106) gene model. BAM files for each sample were merged using samtools (version 1.9)68. RSEM69(version 1.3.1) was used to quantify expression. Duplicate reads were marked using Picard MarkDuplicates in the GATK package (version 4.2.4.1). ‘RNA-SeQC‘70 (version 2.4.2) was used to compute quality control metrics. Org.Hs.eg.db (version 3.14.0) was used to annotate gene biotypes. All gene biotypes were kept for further analysis. GO term analysis was conducted using the ‘TF perturbations followed by expression’ database on https://maayanlab.cloud/Enrichr/.
Differential Expression Analysis
Differential expression analyzes were performed using edgeR71 (version 3.36.0) using the glmQLFit() and glmQLFTest() functions. Multiple testing correction was performed by applying the Benjamini-Hochberg method on the p-values to control the false discovery rate (FDR). Differentially expressed genes (DEGs) were determined using the cut-off FDR < 0.05. Volcano plots were generated using EnhancedVolcano (version 1.12.0) https://bioconductor.org/packages/devel/bioc/vignettes/EnhancedVolcano/inst/doc/EnhancedVolcano.html. clusterProfiler (version 4.2.2)72 was used for enrichment analysis of gene ontology (GO) terms, using the enrich GO function. Adjusted p-values were calculated by the BH method, and results were visualized using the dotplot function from enrichplot (version 1.14.2). https://yulab-smu.top/biomedical-knowledge-mining-book/
Preparation of P1 or P7 neonatal cardiomyocytes and fibroblast
Primary mouse cardiomyocytes were isolated from 1 day or 7-day-old C57/Bl6 mice. The P1 or P7 neonatal cardiomyocytes were isolated by the established protocol described in refs. 23,73 Briefly, neonatal pups were sacrificed, and hearts were isolated. The ventricular tissue was cut into small pieces and was digested by several rounds of 7-minute incubations in ADS buffer (0.68% NaCl (w/v), 0.476% HEPES (w/v), 0.012% NaH2PO4 (w/v), 0.1% glucose (w/v), 0.04% KCl (w/v), 0.01% MgSO4 (w/v), pH 7.35) containing 0.3 mg/ml collagenase A (Roche) and 0.6 mg/ml pancreatin (Sigma-Aldrich) at 37 °C with continuous shaking. 3 ml of Fetus bovine serum (FBS, Invitrogen) was added to each digestion. All the digested samples were pooled together, and cells were centrifuged and resuspended in a plating medium (68% DMEM, 17% medium 199, 10% horse serum, 5% FBS) (Invitrogen). CMs were separated from non-CM cells by plating the mixture on tissue culture plates for 1 h at 37 °C in 5% CO2. The suspended CMs were then plated on laminin-coated tissue culture plates and incubated overnight at 37 °C in 5% CO2 to allow cellular attachment. The following day, cells were washed with PBS, and the plating medium was replaced with maintenance medium (79.5% DMEM, 19.5% medium 199, 1% FBS (Invitrogen)) supplemented with 1% Antibiotic-Antimycotic (Invitrogen). The adherent cells is the fibroblast (non-cardiomyocyte). The cells were washed, counted and plated in 6 well plate (250 × 103 cells/well) to be treated with adenovirus.
Adenoviral transduction and drug Intervention
NMCM P7, P1 or cardiac fibroblast were transduced with adenovirus at the following MOI: LacZ and RRAD 1 MOI, 4 F (CDK1AF, CCNB1, CDK4, CCND1), 2 F (CDK4, CCND1), CCNA2 10 MOI each (vector biolabs); Adenoviruses were removed after 24 h and replaced with maintenance medium. Nifedipine (Sigma-Aldrich, N7634) was diluted to 1 mM in DMSO and then diluted to the required concentration in maintenance media.
2.4. Cloning and preparation of integrating lentivirus
Lentivirus backbone encoding shRNA clone against RRAD, and control clone for the shRNA and (Genecopoeia HSH060278) were used to produce the Lentivirus particles as explained in our previous publication22,50. In brief, HEK293 cells (5 × 10⁶) were transfected using FuGENE HD transfection reagent (Promega) along with 5 µg pMD2.g, 5 µg psPAX2 (Integrating lentivirus) (Addgene) and 10 µg of the expression pLenti vector encoding the gene of interest for 48 h. The media containing the virus were collected and filtered through a Nalgene syringe filter of 0.45 µm. The virus was mixed with a polybrene transfecting reagent (1 µg/ml) (Millipore Cat# 1003). The virus was then used to NMCM (100 TU/cell).
Single-Cell RNA-Sequencing Library Generation
NMCM P1 was isolated as described above and transduced with LacZ or 4 F for 24 h. The CM were then trypsinized and filtered using a 70 µM filter, resuspended in 1% B.S.A. in PBS, and counted immediately before library preparation. G.E.M. Generation and Barcoding were performed following the Chromium Single Cell 3’ Reagents Kits v3 Rev A User Guide with Chromium Single Cell” G.E.M., Library, and Gel Bead Kit v3 (10X Cat # 1000092). Briefly, the Chromium chip (Cat # 1000074) was loaded, and the Chromium Single Cell B program was selected. The chip was ejected immediately following the completion of the program. 100 µL of recovered G.E.M.s was slowly pipetted and transferred to tubes pre-cooled on ice. The G.E.M.s were then incubated for the R.T. reaction using a thermal cycler at 53 °C for 45 min, then 85 °C for 5 min, followed by a 4 °C hold. Samples were then stored at −20 °C overnight. All libraries were pooled and sequenced using the NovaSeq to a read depth of at least 50,000 reads per cell. The sequenced reads for each sample were mapped to the GRCh38 genome to generate the (gene-by-cell) count matrix using cell ranger count (Cell Ranger version 3.1.0 from 10x Genomics) with default parameters. The counts” matrices across the samples were aggregated using cellranger-aggr. The resulting files were processed in R using the package Seurat (version 3.1.3)74. All cells with at least 200 detected genes and less than 30% of reads from mitochondrial genes and all detected genes in at least 3 cells were used in the further analyzes. The remaining data were normalized using the “LogNormaliz” method. Principal Component Analysis for the subset of the 2000 most variable genes (Seurat function FindVariableFeatures) was then performed on the scaled data. The cells were clustered using the Louvain Algorithm with the resolution parameter value of 0.5 (Seurat function FindClusters) after determining the shared nearest neighbor graph using the first ten principal components (Seurat function FindNeighbors). The data were visualized using the UMAP algorithm with the first ten principal components as input (Seurat function RunUMAP). The subpopulations were labeled based on the distribution of expression of the cell cycle genes of interest. Differential analysis between all pairs of clusters was performed using the Wilcoxon rank-sum test to identify the differentially expressed genes (Seurat function FindMarkers).
Immunocytochemistry and EdU incorporation in NMCM P7/heart slices
NMCM were fixed in 4% formaldehyde for 20 min (Thermos Scientific Cat#28908). For human heart tissue, heart slices were fixed in 4% paraformaldehyde for 48 h. Fixed tissue was dehydrated in 10% sucrose for 1 h, followed by 20% sucrose for 1 h, and kept overnight in 30% sucrose at 4 °C. The dehydrated tissue was then processed in optimal cutting temperature compound (OCT compound) and gradually frozen in an isopentane/dry ice bath. OCT-embedded blocks were stored at −80 °C for 24 h. Sections (8 μm) were cut using a cryostat (Leica Inc.) and stored at -20 °C. To remove the OCT compound, the slides were heated for 5 min at 95 °C until the OCT compound melted. Slides were washed with 1 mL of PBS and incubated at RT for 15 min until the OCT compound was washed off. Fixed cells or tissue were washed three times with PBS. Next, the fixed cells/ heart slices were permeabilized with 0.1% Triton X-100 for 15 min (Millipore Cat# 55163804) and then blocked with 3% bovine serum albumin (BSA) in PBS for 60 min at RT (VWR Cat# 0332). The cells/ heart slices were then probed with primary antibody for 1.5 h (Supplementary Table 2). They were then washed three times with PBS and labeled with a secondary fluorescent antibody (Supplementary Table 2). Next, cells/tissue were washed three times with PBS and stained with DAPI 1 µg/ml (Biotium Cat# 40043) to stain the nucleus. For EDU detection, the cells were also treated with 5 µM 5-ethyl-2-deoxyuridine (EDU) for the course of the experiment, which will be incorporated into the newly synthesized DNA. After fixation, permeabilization, and blocking of the cells, the EDU incorporation was visualized using the Click it EDU-Alexa-Flour647 imaging kit (ThermoFisher, C10340). Imaging was conducted for the whole well (15000 cells per well in black-walled, glass bottom 96 well) using the high-content imaging instrument, Cytation 1. The percentage of colocalization of PHH3, EDU, Hoxb13 on nuclei and Troponin-T was quantified using Gen 5.05 software. Aurora Kinase B staining was imaged at 10X magnification using the high-content imaging instrument Keyence and was quantified using BZX800 software.
qRT-PCR
NMCM P7, human heart slices, fibroblast or myofibroblast or heart tissue were mixed with QlAzol lysis reagent (Qiagen Cat# 79306), then RNA was extracted following the miRNeasy micro kit protocol (Qiagen Cat# 217084). The concentration of the RNA was calculated using the Cytation 1 reader. 0.2 ug of each RNA sample was used for reverse transcription using a mixture of oligo(dT) and random hexamer primers (SuperScript IV VILO Master Mix, ThermoFisher Scientific Cat # 11756050). Real-time PCR analysis was conducted with TaqMan fast advanced master mix (ThermoFisher 4444557) and primers specific to mouse CDK1 (Thermofisher # 00772472), mouse CDK4 (Thermofisher # 00677718), mouse CCNB (Thermofisher # 03053893) mouse Ki-67 (Thermofisher # 01278617), mouse Arura A (Thermofisher # 01248177), mouse Arura B (Thermofisher # Mm01718146), mouse Rcan1 (Thermofisher # 01213406), alpha smooth muscle actin (Thermofisher # Mm007725412), Cacna1c (Thermofisher # Mm01188822), Cacna1c (Thermofisher # Mm01209927) and the expression was normalized to mouse GAPDH expression (Thermofisher # 99999915) using the Quant studio5 real-time PCR detection system (Applied Biosystems).
Western blot
Cells were lysed in RIPA buffer (VWR, N653) in the presence of a Protease and Phosphatase Inhibitor Cocktail (Thermofisher Scientific, 78440). The lysate was denatured at 95 °C for 5 min, after which they were loaded and separated on 4–12% Bis-Tris gel (Invitrogen, NW64120) and subsequently transferred onto PVDF membranes (Thermofisher scientific, # LC2002). The membrane was then blocked with 5% (w/v) dried milk in tris-buffered saline with 0.1% Tween 20 (TBST) for 1 h. Membranes were incubated with primary Rabbit polyclonal recombinant Anti-RRAD antibody (Thermos Fisher, PA5-36460) 1:1000 in 3% BSA) overnight at 4 °C, followed by three times wash with TBST. Membranes were then incubated with secondary antibodies (Goat anti-Rabbit IgG (H + L) Cross-Adsorbed Secondary Antibody), HRP (Thermo fisher # G-21234) 1:2500 in 5% milk) for 2 h at RT. The membrane was washed in TBST 3X. The expression was normalized to mouse GAPDH expression using Anti-GAPDH antibody [6C5] (Abcam # ab8245). Membrane proteins were detected and visualized using the ChemiDoc imaging system and analyzed using ImageJ software.
Co-immunoprecipitation
Adult mouse hearts (n = 3 for each) were collected and lysed in RIPA buffer (VWR, N653) in the presence of a Protease and Phosphatase Inhibitor Cocktail (Thermofisher Scientific, 78440). The Dynabeads™ Protein G Immunoprecipitation Kit was used following the manufacture protocol. In brief, 5 μg primary antibodies (Rabbit polyclonal recombinant Anti-RRAD antibody (Thermos Fisher, PA5-36460) or Negative control IgG were used for binding with 1.5 mg Dynabeads™ magnetic beads for 10 min at RT. Then Antibody-conjugated magnetic beads was washed with washing buffer. 20 μg of digested heart samples were incubated with the with gentle Antibody-conjugated magnetic beads with continuous rocking at 4 °C overnight. The antigen-magnetic bead-Antibody complex. Were then washed 3 times with washing buffer. To elute the antigen-antibody complex, 20 μL Elution Buffer and 10 μL of pre-mixed NuPAGE™ LDS Sample
Buffer and NuPAGE Sample Reducing Agent were added to the The antigen-magnetic bead-Antibody complex. Then the sample were heated for 10 min at 70 °C. The tubes were then placed on the magnet and the supernatant which contain the antigen-antibody complex were collected. The samples were loaded onto the gel. The membrane was probed against LTCC (ab283581), Cnb (ab303482), CnA (Sc17808) as explained above.
Membrane protein extraction
To isolate membrane protein form the cytoplasmic protein, Mem-PERTM Plus Membrane Protein Extraction Kit (thermos scientific #89842) was utilized following the manufacture protocol. NMCM P7 were trypsinised to detach from the plate. Then the cells were centrifuge at 500xg for 5 min at RT. The cells were washed 3 times with washing buffer and centrifuged at 500 xg for 5 min at RT after each wash. The pellet was then treated with permeabilization buffer and incubated at 4 °C for 10 min. The cell suspension was then centrifuged and the supernatant at 16000 xg for 15 min. The supernatant was transferred into new tube (cytosolic protein). A solubilization buffer will then be added to the pellet and incubated at 4 °C for 30 min then centrifuged at 16000 xg for 15 min (membranal proteins). 20μg protein was then used for western blot as explained above.
Cellular Calcineurin Phosphatase Activity Assay
NMCM P7 were plated in 96 well plates and transduced with LacZ or RRAD adenovirus for 72 h. Cellular calcineurin phosphatase activity was then assessed following the manufacture protocol (Abcam # ab139464). First, a serial dilution of phosphate standard was prepared to produce a standard curve. The cells were washed with dH2O to remove any traces of the media. The cells in 96 well plate were divided into 4 groups: background group, Okadiac acid treated group, EGTA treated group, and positive control group following the manufacturing protocol. Then, the plate was incubated for 30 min at 30 °C. The addition of malachite green reagent terminated the reaction and read on a microplate reader at OD 620 nm.
The standard curve was used to determine the amount of phosphate produced in each reaction. The calcineurin phosphatase activity was calculated as Calcineurin (PP2B) = Okadaic acid – (Okadaic acid + EGTA). The protein content in each well was also evaluated, and the calcineurin activity was calculated as ng phosphate per 1μg protein. The percentage of calcineurin activity in RRAD transduced NMCM P7 was calculated and compared to LacZ control NMCM P7 in each experiment.
Assessing intracellular calcium amplitude in CMs
CMs were plated on coverslips in 24 well plate and transduced with LacZ or RRAD adenoviruses for 72 h. The assessment of Ca2+transient was performed following the manufacturer’s protocol of Fluo-4 Direct™ Ca2+ Assay Kits (Invitrogen #F10471). CMs were loaded with Fluo-4 direct Ca2+ reagent and incubated for 30 min at 37 °C and 5% CO2. Fluo-4 fluorescence transients were recorded using keyance instrument settings appropriate for excitation at 494 nm and emission at 516 nm. All analyzes of Ca2+ transients were based on Ca2+ transients recorded from single cardiomyocytes and the Ca2+ transient’s amplitude was assessed as the average of 10 consecutive beats from each cell. Ca2+ amplitude was assessed following normalization to the basal florescence of each cell and represented as F/F0 using a custom written MatLab script (MATLAB R2013a (Mathworks))18.
Heart-slicing and culturing
Donor hearts not utilized for cardiac transplantation were obtained through the United Network for Organ Sharing (UNOS). Ethics approval for the use of the human hearts was obtained from Baylor College of Medicine Institutional Review Board (H-53940) and according to the declaration of Helsinki. All human heart donors have signed up for organ tissue donation programs within the USA during their life, and informed consent from the next of kin was obtained after death for all donors in the study. Slicing and culturing of 300 μm thick heart tissue slices were established in our lab and performed as previously described29,75,76. Tissue slices were maintained in a refined oxygenated growth medium (Medium 199, 1x ITS supplement, 10% FBS, 5 ng/mL VEGF, 10 ng/mL FGF-basic, and 2x Antibiotic-Antimycotic (Invitrogen), which was changed 3 times/day. LacZ or RRAD (0.2 × 10⁷ PFU) adenoviruses were added to the culture medium on the day of slicing. 48 h post-transduction, slices were transduced with CDK4, CCND (2 F) adenoviruses (1 × 10⁷ PFU each) and incubated for 48 h with media changes 3 times/day. Tissue slices were then processed for further analysis.
Myofibroblast activation to myofibroblast
Cardiac fibroblasts (10 × 105 cells) were plated in 24 well tissue culture plates and incubated overnight at 37 °C in 5% CO2 to allow cellular attachment. The cardiac fibroblasts were treated with 5 ng/ml transforming growth factor β2 recombinant mouse (TGF-β2) (R&D Systems #7346-B2) for 24 h then transduced with LacZ or RRAD Adenovirus for 72 h. The cells we then collected for RNA isolation or fixed for immunostaining as descried above.
Animal experiments
Animal studies were performed following the University of Louisville animal and Baylor College of Medicine use guidelines, and the protocols were approved by the Institutional Animal Care and Use Committee (IACUC) and were accredited by the Association for Assessment and Accreditation of Laboratory Animal Care.
MADM mice experiment
For lineage tracing, we used mosaic analysis with double markers (MADM). Transgenic mice were developed as described previously22,23. Male and female 12 weeks old were randomly selected to be injected with 20 μl containing LacZ (0.5 × 10⁷ PFU), RRAD 0.5×10⁷ PFU), 2 F (5 × 10⁷ PFU each), and 2 F + RRAD adenoviruses intramyocardially using a 30-gauge needle. The injections were made at the outer ventricular wall and the septum as two injections 10 µL each. 24 h after injection, mice received Tamoxifen (40 mg/kg I.P.) for three days (Sigma Aldrich T5648). 6 days after injection, mice were anesthetized to a surgical plane of anesthesia with 2% isoflurane, and the chest wall was opened underneath the sternum upward for 0.5 cm; then the heart was excised following the IACUC protocol. The hearts were harvested for pathology study. The mice sergeant was blinded to all administered viruses. MADM mice frozen hearts were sectioned longitudinally into 180–210 sections (3 sections per slide, collect one and throw away 2) 8 µm thick. The frozen sections were fixed, permeabilized, and blocked as described in the Immunocytochemistry and immunohistochemistry section, then stained with Dapi 1 µg/ml (Biotium Cat# 40043) to stain the nucleus. The coverslips were mounted with Vectashield antifading medium (vector labs Cat# H-1000) onto slides and visualized using the Keyence BZ9000 imaging system (10X magnification to the whole left ventricle). The percentage of single-colored cardiomyocytes from the total labeled cardiomyocytes was calculated using B.Z. Analyzer software. Individuals who analyzed the results were blinded to the treatment applied to each animal.
Myocardial Infarction in mice
All the surgeries were performed as described previously23. In brief adult (about 12 weeks old) male ICR mice were anesthetized with isoflurane inhalation 2%. After opening the chest through a left thoracotomy, the left anterior descending coronary artery (LAD) was ligated at the lower 1/3rd using an 8-0 prolene suture. Rectal temperature was carefully monitored and maintained around 37 °C throughout the experiment. Successful performance of coronary occlusion and reperfusion was verified by visual inspection. Mice received perioperative, and postoperative analgesia for 5 days (Meloxicam 2 mg/Kg/day). Seven days after LAD ligation, the cardiac functions were evaluated by echocardiography while the mice are sedated with isoflurane inhalation 2%. Afterwards, mice were randomly injected intramyocardially with the treatment/ control adenoviruses. Surgeon was blinded to the treatment administered. At injection time, the chest reopened through left thoracotomy, mice were randomly selected to be injected with 20 ul of LacZ, RRAD, 2 F, or 2 F + RRAD adenovirus (RRAD 0.5 ×10⁷ PFU, and CDK4, and CCND 5×10⁷ PFU each) intramyocardially using a 30-gauge needle. The injections were made at the border between infarcted and non-infarcted myocardium. Mice received perioperative, and postoperative analgesia for 5 days (Meloxicam 2 mg/Kg/day). One month after virus treatment, echocardiography was repeated under sedation, then mice were anesthetized to a surgical plane of anesthesia with 2% isoflurane, and the chest wall was opened underneath the sternum upward for 0.5 cm; then the heart was excised following the IACUC protocol. The hearts were harvested for pathology study. Hearts were fixed then embedded in OCT, mice frozen hearts were sectioned Longitudinally into 100–120 sections (4 sections per slide collect one and throw away one) 8 µm thick. The frozen sections were stained using Mason Trichrome staining then imaged using Keyence BZ9000 imaging system (4X magnification to the whole left ventricle). The percentage of blue-colored scar tissue to the red-colored myocardium using ImageJ software. Individuals who analyzed the results were blinded to the treatment applied in each animal.
Echocardiography
Cardiac function was assessed by echocardiography one week after MI (before virus injection), and then four weeks after virus injection. Animals were sedated lightly with isoflurane, placed on the imaging table in the supine position, and prepared for imaging using the Vevo 2100 Imaging System (Visual Sonics) equipped with a 25-MHz transducer. Parasternal long axis, parasternal short axis, and apical images including B mode and M mode images were acquired. Vevo LAB 3.2.6 was used to analyze the LV functional parameters, including the end-diastolic and end-systolic diameters, volume, stroke volume, fractional shortening, and ejection fraction. Imaging and calculations were done by an individual who was blinded to the treatment, and the code was broken after all data was acquired
Statistical Analyzes
For all assays, power analyzes were performed to choose the group sizes, which will provide >80% power to detect a 10% absolute change in the parameter with 5% Types I error rate. The Kolmogorov-Smirnov (K-S) test for normality was conducted. Then, differences between the two groups were examined for statistical significance with unpaired Student t-tests or Mann–Withney test. However, to compare data consisting of more than two groups, we performed one- or Two-way ANOVA tests followed by Dunnett’s post-test multiple comparisons to get the corrected p-value. A value of P < 0.05 was regarded as significant, and error bars indicate standard deviation (SD).


Responses