PIK3CA mutation fortifies molecular determinants for immune signaling in vascular cancers
Introduction
Angiosarcoma is an aggressive soft tissue sarcoma that forms malignant endothelium. Irregular vascular formation establishes an inflamed local tumor tissue, possibly due to leaky vessels, blockage of normal blood flow, and excessive hemorrhage [1]. Angiosarcomas are extremely rare with ~1000 or fewer patients per year in the United States [2]. Hemangiosarcoma, a histologically identical form of angiosarcoma in animals, naturally develops in companion dogs. Unlike in humans, hemangiosarcomas are common vascular malignancy in dogs with more than 50,000 cases annually [3]. Canine hemangiosarcoma shares clinical and morphological features as well as pathogenesis with human angiosarcoma, serving as a natural cancer model [4,5,6,7,8]. Human patients with angiosarcoma have a 40% five-year survival rate, with half having a median overall survival of 16 months [9]. Similarly, clinical outcomes for dogs with hemangiosarcoma are unfavorable, with an average life expectancy of 6 months or less, especially when the tumor occurs in internal organs, ruptures, or metastasizes [10, 11].
The hallmark of angiosarcoma involves the creation of distorted vascular spaces by malignant cells. These spaces harbor a diverse array of blood and immune components, where a controlled scavenging system is necessary for tumor maintenance. In this context, the ability of angiosarcoma cells to control the hemato-endothelial system emerges as pivotal to their pathogenic significance [12]. At the molecular level, recurrent mutations are found in TP53, and genes involved in phosphatidylinositol 3-kinase (PI3K) pathway such as PIK3CA, PIK3R1, and PTEN in both human angiosarcoma and canine hemangiosarcoma [13,14,15,16,17]. PIK3CA is a one of the most frequent cross-species oncogenic mutations, and approximately 20% of human patients and 30% of dogs exhibit PIK3CA mutations [13, 15,16,17,18,19]. The PI3K/AKT/mammalian target of rapamycin (mTOR) pathway is broadly activated in these vascular tumors [15, 20, 21]. PIK3CA mutations are known to functionally activate the PI3K pathway, promoting angiogenic signaling, cell survival, and proliferation [21,22,23]; thus, PI3K-α has been regarded as an effective therapeutic target. Yet, the functional and molecular consequences of PIK3CA mutations remain incompletely known in vascular cancers.
Here, we used CRISPR/Cas9 gene editing to introduce PIK3CA H1047R hotspot mutation in hemangiosarcoma cell lines to establish experimental models of vascular cancer carrying this mutation. Our data showed that PIK3CA H1047R mutation promotes cytokine and chemokine secretion in hemangiosarcoma cells. We also identified distinct molecular signatures of PIK3CA-mutant cells, revealing potential mechanisms of resistance to the FDA-approved, PI3K-α-specific inhibitor, alpelisib (BYL719). This study demonstrates that PIK3CA mutations induce a molecular switch that facilitates immune and metabolic reprogramming, potentially contributing to resistance to PI3K inhibition. Furthermore, we propose experimental models of rare vascular cancer carrying PIK3CA mutations through a comparative oncology study using comprehensive molecular profiling.
Methods
Cell lines and reagents
DHSA-1426 and COSB hemangiosarcoma cell lines were maintained as described previously [12, 24]. The cells were maintained in Ham’s F12 medium supplemented with 10% fetal bovine serum, 1% HEPES, 0.05 mg/ml Endothelial Cell Growth Supplement (BD, Franklin Lakes, NJ), 100 µg/ml Primocin (InvivoGen, San Diego, CA), and 0.01 mg/ml heparin at 37 °C in a humidified 5% CO2 atmosphere. Mycoplasma contamination was tested regularly using Polymerase Chain Reaction (PCR) amplification of cell lysates. Cell lines were authenticated using CellCheckTM Canine STR profiling test (IDEXX BioAnalytics, Columbia, MO). The PI3K-α inhibitor alpelisib, the pan-PI3K inhibitor ZSTK474, and doxorubicin were purchased from Cayman Chemical (Ann Arbor, MI).
Generation of PIK3CA H1047R mutant hemangiosarcoma cells
An H1047R mutation in the PIK3CA gene was induced in the DHSA-1426 and COSB cell lines using CRISPR/Cas9 gene editing technology. An Alt-R modified 82-nucleotide single-stranded oligo DNA nucleotide (ssODN) for HDR donor template was synthesized from IDT (5′-C*A*AGAGGCTTTGGAATATTTCATGAAACAAATGAACGACGCCCGTCATGGTGGCTGGACAACAAAAATGGATTGGATCTT*C*C-3′) (Coralville, IA). Sense-stranded sgRNA was designed and purchased from Synthego (5′-AUGAAUGAUGCACAUCAUGG-3′) (Redwood City, CA). CleanCap Cas9 mRNA (TriLink, San Diego, CA) was introduced into the cells with ssODN and sgRNA for single-base substitution. Engineered cells with homozygous PIK3CA mutations were screened through single-cell clonal selection and confirmed by Sanger sequencing. Genome editing reagents and the engineered cell lines were provided by the University of Minnesota Genome Engineering Shared Resource. A short tandem repeat marker analysis was performed to confirm the origin of the engineered daughter cell clones.
Real-time quantitative reverse transcription PCR (qRT-PCR)
Cells were washed in phosphate buffered saline (PBS) and total RNAs were extracted using TRIzol™ Reagent (Thermo Fisher Scientific, Waltham, MA) and RNeasy Mini Kit (Qiagen, Hilden, Germany). Complementary DNA was synthesized with a PrimeScript RT Master Mix (Takara, Kusatsu, Shiga, Japan). Gene expression analysis was performed using Power SYBR™ Green PCR Master Mix (Thermo Fisher Scientific) and Quanti-Studio3 (Thermo Fisher Scientific). Relative fold change of gene expression was calculated by ΔΔCt method. Primer sequences used in this study are following: IL6 forward (5′-GGCTACTGCTTTCCCTACCC-3′), IL6 reverse (5′-TTTTCTGCCAGTGCCTCTTT-3′), CXCL8 forward (5′-TGGCAGCTTTTGTCCTTTCT-3′), CXCL8 reverse (5′-GGGCCACTGTCAATCACTCT-3′), IL6R forward (5′-TGCTGCAGAATCTTGTGGAC-3′), IL6R reverse (5′-CATGCTCAGGGGACTCTTTC-3′), CXCR2 forward (5′-GCAAAGAGTACCTGCCCAAG-3′), and CXCR2 reverse (5′-GACTGTGAACAGCCAGTGGA-3′).
Immunoblotting
Cells were washed in PBS and lysed with RIPA Lysis and Extraction Buffer containing Halt Protease and Phosphatase Inhibitor Cocktail (Thermo Fisher Scientific), and then quantified using Pierce BCA Protein Assay Kit (Thermo Fisher Scientific). Equal amounts of total protein from the cell lysates were mixed with NuPAGE LDS Sample Buffer (Thermo Fisher Scientific) containing 2.5% 2-Mercaptoethanol (MilliporeSigma, Burlington, MA). Lysates were heated to 95 °C for 5 min. Thirty µg of the protein samples were loaded for SDS-PAGE and transferred to a PVDF membrane (MilliporeSigma). Membranes were blocked for 1.5 h with 5% BSA in Tris-buffered saline with 0.1% Tween 20 solution (TBS-T) at room temperature. Membranes were washed with TBS-T and incubated with primary antibody overnight at 4 °C in 5% BSA in TBS-T. Membranes were washed and incubated with the appropriate HRP-conjugated secondary antibody in 5% skim milk for 1 h at room temperature. Membranes were developed using Pierce ECL Western Blotting Substrate (Thermo Fisher Scientific). Primary antibodies against phospho-AKT (Ser473) (#4060), AKT (#9272), phospho-ERK1/2 (Thr202/Tyr204) (#4370), ERK1/2 (#4695), phospho-STAT3 (Tyr705) (#9145), STAT3 (#4904), phospho-S6 ribosomal protein (Ser235/236) (#4856), p70 S6K (#2708), and γH2AX (Ser139) (#9718) were used (Cell Signaling Technology, Danvers, MA). Antibodies against β-actin (MA191339, Thermo Fisher Scientific) or RPA32 (#52448, Cell Signaling Technology) were used as housekeeping controls.
Multiplex cytokine and chemokine ELISA
5 × 10⁵ cells were plated in 24-well plates and incubated in complete culture medium for 24 h treated with 10 µM of DMSO, alpelisib, and ZSTK474. Cell-free supernatants were collected and analyzed using MILLIPLEX® Canine Cytokine/Chemokine Magnetic Bead Panel (MilliporeSigma) according to the manufacturer’s instructions to determine levels of GM-CSF, IFNγ, IL-2, IL-6, IL-7, IL-8, IL-10, IL-15, IL-18, IP10, KC-like (CXCL-1), MCP-1, and TNFα. Cytokine and chemokine signals were analyzed on a Luminex 200 system with BioPlex Manager 6.0 software. All the experiments were performed in duplicate.
Cell growth inhibition assay
Cells were seeded at a density of 5000 cells per well in a 96-well culture plate. Cells were incubated in humidified CO2 incubator for one day, then inhibitors were treated at indicated concentrations. Cell viability was assessed three days later using CellTiter 96™ AQueous One Solution Cell Proliferation Assay (Promega, Madison, WI) according to the manufacturer’s protocol. Absorbance was measured at 490 nm on a Varioskan LUX Multimode Microplate Reader (Thermo Fisher Scientific). SynergyFinder, a web-based application, was used to calculate the Bliss independence, highest single agent, Loewe additivity, and zero interaction potency scores to determine the drug combination effect between alpelisib and doxorubicin [25].
Tube formation assay
Angiogenic capacity was assessed using a Matrigel-based tube formation assay. Briefly, 300 µL of growth factor-reduced Matrigel (Corning, Corning, NY) was added to each well of a pre-chilled 24-well plate and allowed to solidify at 37 °C for 30 min. DHSA-1426 cells were seeded onto the Matrigel at a density of 1.2 × 10⁵ cells per well in complete growth medium. After 4 h of incubation at 37 °C in a 5% CO2 incubator, tube formation was observed and imaged using a microscope. All the experiments were performed in triplicate.
Bulk RNA-sequencing (RNA-seq)
Total RNA was isolated from cell pellets using a RNeasy Micro Kit (Qiagen). Amplification and sequencing were completed at the University of Minnesota Genomics Center (UMGC). Paired-end RNA-seq data with mate-pair distance of 150 bp in FASTQ format were imported and processed using the nf-core/RNAseq pipeline (version 3.10.1) for quality control, trimming, alignment, and producing a gene expression matrix. Differentially expressed gene (DEG) analysis was conducted and visualized with the DESeq2 and the EnhancedVolcano R/Bioconductor packages. For the Gene Ontology (GO) enrichment and the Kyoto Encyclopedia of Genes and Genomes (KEGG) pathway analysis, the clusterProfiler R/Bioconductor package was employed. For the pre-ranked Gene Set Enrichment Analysis (GSEA), the fgsea R/Bioconductor package was performed against the MSigDB collections (version 2023.1.Hs). Heatmaps and hierarchical clustering based on average linkage were visualized using R programming language (version 4.3.2.).
Assay for transposase-accessible chromatin using sequencing (ATAC-seq)
0.5 × 10⁵ cells were harvested and washed with cold PBS. Cells were lysed with 50 µL of ice-cold lysis buffer (10 mM Tris pH 7.4, 10 mM NaCl, 3 mM MgCl2, and 0.1% Igepal CA-630) and centrifugated at 500 × g for 10 min, followed by 2 pulses up to 7000 g to ensure all cells were pelleted. For a DNA fragmentation, a Nextera DNA Library Preparation Kit (Illumina) was used according to the manufacturer’s protocol. Briefly, nuclei pellets were resuspended in a transposition reaction mixture prepared by adding 2.5 µL of TDE1 transposase into 47.5 µL TD buffer and incubated at 37 °C for 30 min. After incubation, DNA was purified immediately using MinElute PCR purification kit (Qiagen). The purified DNA was sequenced at the UMGC using an Illumina sequencer. Raw FASTQ files were processed using the ENCODE ATAC-seq pipeline for quality check, trimming, alignment, filtering, signal generation, and peak calling [26]. Differential binding site analysis, peak annotation, and data visualization were performed using the DiffBind, the ChIPseeker, and the profileplyr R/Bioconductor packages. To compare and visualize the peak signals on specific genome loci, the bigwig files containing the mean signal of each clone were loaded with the canFam6 genome on the Integrative Genomic Viewer web browser.
Single-cell RNA-seq
DHSA-1426 wild-type (WT) and C35 mutant cells were treated for 24 h with either 10 µM alpelisib or vehicle (10 µM DMSO). Cells were harvested and washed in PBS and resuspended in Ham’s-F12 supplemented with 5% FBS. The cells were passed through a 40 µm cell strainer to remove any larger cell aggregates that would clog the microfluidic system or lead to background noise due to cell popping. Single-cell RNA-seq was performed using the 10x Chromium 3’ GEX system according to the manufactures instructions. 10,000 cells per sample and 80,000 reads per cell were captured. The UMGC performed sequencing, and data was analyzed using Cell Ranger software (10x Genomics) and Seurat (version 4.3.0) R package. Pseudo-temporal single-cell trajectory analysis was done using Monocle 3 R/Bioconductor package.
Metabolomics profiling
Cells were washed three times with ice-cold PBS and immediately added dry ice-cold liquid chromatography-mass spectrometry (LC-MS) grade methanol for quenching and extraction. Global metabolomics profiling was performed on a Thermo Q-Exactive Oribtrap mass spectrometer with Dionex UHPLC and autosampler at the Southeast Center for Integrated Metabolomics at the University of Florida as described previously [27]. All samples were analyzed in positive and negative heated electrospray ionization with a mass resolution of 35,000. Separation was achieved on an Avantor ACE EXCEL 2 C18-PFP 100 × 2.1 mm, 2 µm column with mobile phase A as 0.1% formic acid in water and mobile phase B as acetonitrile. The flow rate was 350 µL/min with a column temperature of 25 °C. Sample volume of 4 µL was injected for negative ions and 2 µL for positive ions. Data from positive and negative ion modes were subjected to statistical analyses. MZmine software (version 3.4) was used to identify features, deisotope, align features, and perform gap filling to fill in any features that may have been missed in the first alignment algorithm [28]. The data was searched against our internal metabolite library database and known metabolites were mapped to KEGG IDs. For quality control and data preprocessing, MetaboAnalystR R package was used. Briefly, blank feature filtering was performed using inner-quartile range filtering method. Missing data were imputed by k-nearest neighbor imputation. Peak intensities were normalized sample-wise using sum normalization followed by log (base 10) transformation. Normalized peak intensities were visualized using the Python Seaborn package (version 3.11.6).
Seahorse real-time cell metabolic assay
A Seahorse XFe96 Extracellular Flux Analyzer (Agilent Technologies, Wilmington, DE) was used to measure the extracellular acidification rate (ECAR) and the oxygen consumption rate (OCR) of our cells using the Seahorse Glycolytic Rate Assay and Mito Stress Test kits, respectively, as described previously [29]. DHSA-1426 WT, C8, and C35 cell lines were plated in XFe96/XF Pro Cell Culture Microplates with 100 μL of medium at cell densities of 20,000 or 40,000 cells/well the day prior to the assay to achieve an appropriate confluence level of approximately 80%. Sensor cartridges were pre-incubated for the same length of time in sterile water in a non-CO2 incubator. On the day of the assay, the culture medium was removed from the cell culture plate and the cells washed with PBS. After washing, 180 µL of Assay Medium containing Seahorse XF base medium supplemented with 10 mM glucose, 1 mM L-glutamine, and 1 mM sodium pyruvate was added to the cells. Plates were incubated for 1 h at 37 °C in a non-CO2 incubator prior to the assay. The Assay Medium was used to reconstitute the Seahorse kit reagents according to the manufacturer’s instructions. For the Glycolytic Rate Assay, three initial measurements of basal ECAR were taken followed by sequential injections of rotenone and antimycin A (0.5 μM) and 2-deoxyglucose (50 mM). For the Mitochondria Stress test, three basal OCR measurements were taken followed by sequential injections of oligomycin (1 μM), FCCP (1 μM), and rotenone and antimycin A (1 μM). Three measurements of ECAR and OCR were recorded after every injection for the Glycolytic Rate Assay and the Mito Stress Test, respectively. After completion of the assays, Hoechst dye (5 µM) was injected into each well to fluorescently label cells for automated cell counting. Following cell counting, ECAR and OCR values were normalized to the cell count for each well.
Tumor xenograft
Xenograft experiments were conducted with some modifications as established previously [12, 30]. Female immunodeficient mice (beige/nude/xid) at 4 weeks of age were used (Charles River Laboratories, Wilmington, MA). Fifteen mice were divided into three groups (WT, C8, and C35), and five million cells per mouse were injected subcutaneously in the right flank. The animals were monitored daily for a duration of 8 weeks post-inoculation. Tumor volume was calculated once a week using the formula (length × width2/2), measured with a caliper.
Statistical analysis
Statistical significance was calculated by GraphPad Prism (version 10.1.0) software and R programming (version 4.3.2.) Significance was determined using the one-way ANOVA for the three group comparison and the Dunnett’s test for multiple comparisons. p-values < 0.05 was considered statistically significant (* < 0.05, ** < 0.01, *** < 0.001, and **** < 0.0001).
Ethics approval and consent to participate
All animal housing, handling, and euthanasia procedures were conducted in compliance with the guidelines and approval of the University of Minnesota Institutional Animal Care and Use Committee (protocol 2102-38880 A). No human subjects or specimens were used in this study.
Results
Activating PIK3CA H1047R mutation is inducible in hemangiosarcoma cells
We first confirmed the occurrence of mutations in key genes involved in the PI3K pathway in human angiosarcomas and canine hemangiosarcomas. PI3K-related mutations were observed in approximately 37% of human angiosarcoma and up to 40% of canine hemangiosarcomas (Fig. S1A) [13, 15,16,17, 20]. PIK3CA mutations were identified in kinase domains in both species, activating the convergent PI3K/AKT pathway, despite their variable mutational signatures (Figs. 1A and S1B) [15]. To determine functional consequences of PIK3CA mutations, we established two homozygous PIK3CA H1047R mutant clones (C8 and C35) and a PIK3CA WT clone from DHSA-1426 hemangiosarcoma cells (Fig. 1B). Additionally, one homozygous PIK3CA H1047R mutant clone (hereafter referred to as COSB-H1047R) was generated from COSB hemangiosarcoma cells (Fig. S2). The two mutant DHSA-1426 cells showed increased phosphorylation of proteins downstream of PI3K (Fig. S3A). The COSB-H1047R exhibited only marginal increase of phosphorylation of S6K, indicating persistent activation of PI3K pathway without the PIK3CA hotspot mutations (Fig. S3B). Since PIK3CA H1047R mutation could change cell shape and polarity [31], we then examined the morphological appearance of the isogenic cells (Fig. 1C). The WT cells revealed virtually identical growth patterns to their parental DHSA-1426 cells, forming tube-like structures. In contrast, the mutant cells exhibited incomplete tubular structures and displayed a more pleomorphic appearance: the mutant C8 cells grew individually and contained noticeable subpopulations of small-sized round cells forming clumps, while the mutant C35 cells included an increased number of small round cells with a loss of shape. No significant change was found in the cell growth rates between the mutant and WT cells, although the mutant C8 cells appeared to grow slower than the others (Fig. 1D). We also observed distinct global transcriptomic profiles between the mutant and WT cells (Fig. 1E).
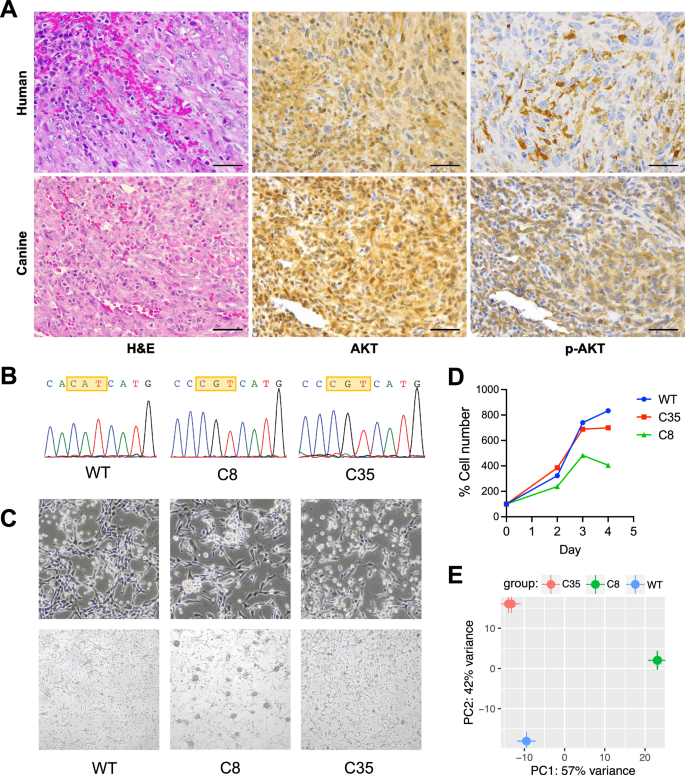
A Representative histopathological images from canine hemangiosarcoma and human angiosarcoma patients. H&E staining (left); immunohistochemistry with AKT antibody (middle) and phosphor-AKT antibody (right). B A homogeneous PIK3CA H1047R mutation was confirmed by Sanger sequencing analysis of the PIK3CA gene in wildtype (WT) and two different PIK3CA H1047R knock-in clones from DHSA-1426 hemangiosarcoma cells. C Representative live cell morphology was obtained by capturing bright field images at 20× (upper) and 10× (lower) magnifications. D Growth rates of the WT and PIK3CA-mutant cells were visualized by plotting the absolute cell numbers at days two, three, and four after seeding the same number of cells at day zero. E Genetic variation among three cells was assessed by analyzing the principal components of gene expression profiles obtained from bulk RNA-seq.
PIK3CA mutations regulate molecular programs associated with immune functions
To identify molecular pathways associated with PIK3CA mutations, we first analyzed bulk RNA-seq data generated from 74 primary canine hemangiosarcoma tissues with PIK3CA mutations (n = 16) and without mutations (n = 58) [15]. Our DEG analysis showed that genes associated with immune response and PI3K signaling were significantly enriched in primary hemangiosarcoma tissues harboring PIK3CA mutations (Fig. S4A). We then analyzed bulk RNA-seq data of isogenic PIK3CA-mutant DHSA-1426 hemangiosarcoma cells. Our analysis identified DEGs associated with immune regulation and reactive tissue microenvironment (Fig. 2A, B). Similar pathways involved in the immune response were also identified in COSB-H1047R cells (Fig. S4B). We also found that four out of the 13 cytokines/chemokines in the cytokine array were secreted more in the mutant cells than in the WT (Fig. 2C). GM-CSF, MCP-1, and CXCL8 (IL-8) were augmented in both C8 and C35 mutant cells, and IL-6 was enriched in C35 with minimal change in C8 cells. The expression patterns for the CXCL8 and IL6 genes aligned with their respective protein secretion (Fig. 2D). The IL-8 receptor gene, CXCR2 was up-regulated in the mutant cells, albeit to a greater extent in C35 than in C8 cells, while the IL-6 receptor gene, IL6R was down-regulated in both mutant cell lines (Fig. 2E). Phosphorylation of signal transducer and activator of transcription 3 (STAT3), which is activated by IL-6 and CXCL8 cytokines, was increased in C35, whereas it was decreased in C8 cells (Fig. 2F).
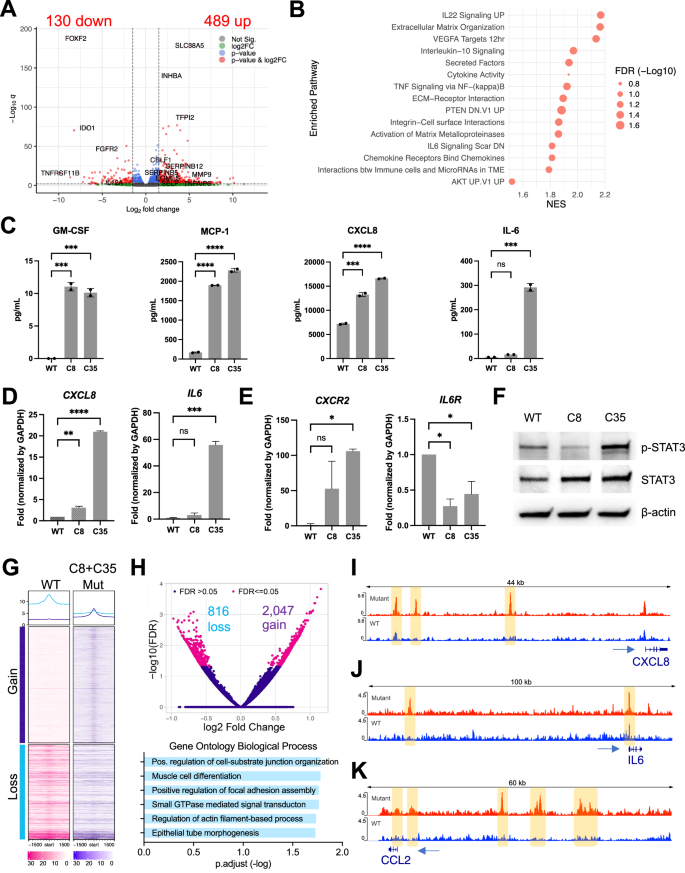
A Transcriptome analysis was performed using bulk RNA-seq to compare gene expression between WT and PIK3CA-mutant (C35 and C8) cells. The volcano plot shows differentially expressed genes (DEGs) (red dots) with absolute log fold change above 1.5 (indicated by vertical dot lines) and an adjusted p-value (q) below 0.01 (indicated by horizontal dot line). Genes associated with the immune system are denoted with their respective gene names. B Pre-ranked gene set enrichment analysis (GSEA) was performed using fgsea R package. Dot plot shows the normalized enrichment score (NES) and false discovery rate (FDR)-corrected adjusted p-value of enriched pathways. C ELISA analysis for secretion of GM-CSF, CXCL8, MCP-1, and IL-6 from the cell culture supernatants. D Real-Time Quantitative Reverse Transcription PCR (qRT-PCR) results showed that IL6 and CXCL8 genes, E along with their corresponding receptors, were expressed at basal levels. F Immunoblotting shows the phosphorylation and expression levels of STAT3 in lysates from isogenic DHSA-1426 cells without stimulation. β-actin was used as a loading control. The data presented are representative of three independent experiments. G Heatmap represents the normalized mean of ATAC-seq signals in WT (n = 4) and PIK3CA-mutant (C35, n = 6 and C8, n = 2) cells. Peaks are centered in ±1.5 kb windows. Gain and loss indicate differentially bound sites (DBS) based on their FDR below 0.05. H Volcano plot visualizes log fold change and FDR values of DBS (magenta dots; upper). Gene Ontology (GO) Biological Process (BP) analysis of the nearest genes around DBS (lower). Visualization of different peak intensities in the enhancer region of CXCL8 (I), IL6 (J), and CCL2 (K) genes. Statistical significance was determined by one-way ANOVA and Dunnett’s multiple comparison test; ns: not significant, *: p < 0.05, **: p < 0.01, ***: p < 0.001, ****: p < 0.0001.
Subsequently, we performed ATAC-seq analysis to determine whether chromatin accessibility contributes to the transcriptional regulation in PIK3CA-mutant cells. Our analysis revealed that the mutant C8 and C35 cells exhibited distinct patterns of chromatin accessibility in transcription start site (TSS) across the genome compared to the WT cells, as shown in the global heatmap (Fig. 2G). We identified 2,863 differentially bound sites (DBS) between the mutant and WT cells (2,047 gained and 816 lost; FDR ≤ 0.05), and Gene Ontology Biological Process (GOBP) analysis with adjacent genes to DBS revealed cell-substrate junction organization, focal adhesion assembly, and actin filament-based process (Fig. 2H). This finding provides molecular insights into the distinct cellular morphology observed in the mutant cells, shown in Fig. 1C. We also identified different peak intensities in the promoter regions of CXCL8, IL6, and CCL2 genes, encoding immune cytokines enriched in the mutant cells (Fig. 2I−K). We further conducted single-cell RNA-seq analysis to confirm our findings on modulation of PI3K-mediated immune signaling and endothelial morphogenesis. Our marker gene expression analysis identified distinct single-cell clusters enriched with angiogenic (CAV1, PDPN, FGFR2, and FLT1) and immune-related genes in the C35 mutant cells (Fig. S5), which showed higher levels of IL-6 and IL-8 secretion and increased phosphorylation of STAT3 as shown in Fig. 2C–F.
Collectively, our findings suggest that PIK3CA mutations establish the molecular program that regulates secretory immune molecules in vascular cancers.
PI3K inhibition intervenes in molecular processes regulated by PIK3CA mutation
Next, we confirmed that the PI3K inhibitor abrogated phosphorylation of AKT and ribosomal protein S6 in both mutant and WT cells (Fig. 3A). Inhibition of PI3K also reduced cell proliferation (Figs. 3B, S6A). Specifically, the mutant C35 cells were more sensitive to both alpelisib, a PI3K-α inhibitor (mean IC50 = 5.47 µM), and ZSTK474, a pan-PI3K inhibitor (mean IC50 = 7.69 µM) compared to the WT cells (mean IC50 = 21.93 µM for alpelisib; 13.83 µM for ZSTK474). In contrast, the response of the mutant C8 cells to alpelisib (mean IC50 = 24.06 µM) was comparable to that of the WT, while they showed greater resistance to ZSTK474 (mean IC50 = 54.08 µM). A significant difference in the sensitivity to alpelisib was not observed between the COSB-H1047R mutant and COSB WT cells (Fig. S6B).
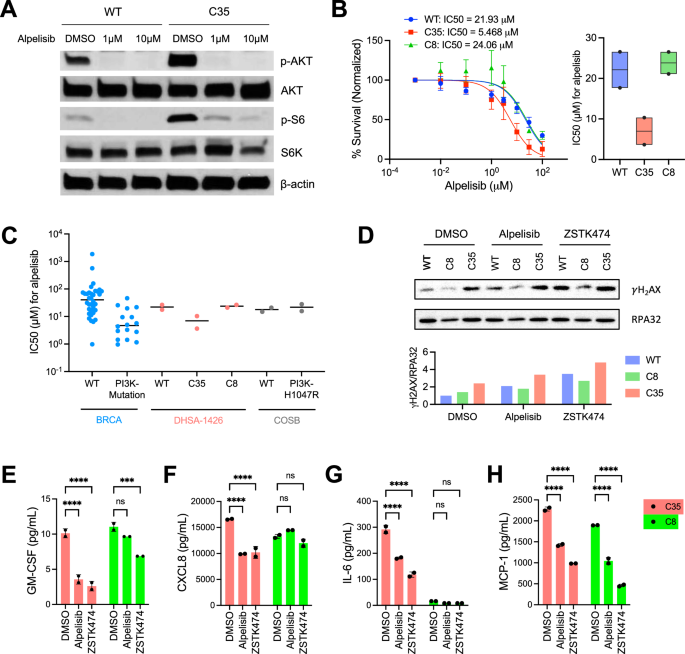
A Immunoblotting shows the phosphorylation of AKT and S6 in lysates from WT and C35 cells treated with alpelisib at 1 μM or 10 μM for 24 h. β-actin was used as a loading control. The data presented are representative of two independent experiments. B WT and PIK3CA-mutant DHSA-1426 cells were treated with increasing concentrations of alpelisib for 72 h. Cell viability was measured using the CellTiter 96™ AQueous One Solution Cell Proliferation Assay. Data were compiled from two independent experiments. Error bars indicate mean ± SD. The IC50 was calculated using non-linear regression method (left). The boxplot shows the IC50 data from each individual experiment (black point) and their mean value (horizontal black line, right). C The alpelisib sensitivity data across human breast invasive carcinoma (BRCA) cell lines were obtained from the Genomics of Drug Sensitivity in Cancer (GDSC) database (version 2 and release 8.4). Each dot represents an individual cell line for BRCA cell lines and a biological replicate of the experiment for DHSA-1426 and COSB cell lines. The horizontal black bars indicate the median values. D Immunoblotting analysis shows γH2AX and RPA32 status in WT and PIK3CA-mutant DHSA-1426 cells treated with alpelisib and ZSTK474. Bar plots indicate the signal intensity of γH2AX normalized with RPA32 expression. ELISA analysis shows secreted GM-CSF (E), CXCL8 (F), IL-6 (G), and MCP-1 (H) from cell culture supernatants after treatment with 10 μM of the indicated drugs. Statistical significance was determined by two-tailed unpaired t-tests; ns: not significant, *: p < 0.05, **: p < 0.01, ***: p < 0.001, ****: p < 0.0001.
Further, we analyzed the IC50 values in a panel of human breast invasive carcinoma (BRCA) cell lines treated with alpelisib, including PI3KCA-mutant (n = 16) and PI3KCA-WT (n = 34) [32]. The IC50 values for hemangiosarcoma cells treated with alpelisib were within a comparable range to those of the BRCA cell lines (Fig. 3C). The mutant C35 hemangiosarcoma cells showed similar IC50 values to PIK3CA-mutant BRCA cell lines. Conversely, the IC50 values in the WT and the mutant C8 cells were similar to those of PIK3CA-WT BRCA cell lines on a logarithmic scale.
Subsequently, we examined γH2AX phosphorylation status, a marker for DNA damage-mediated apoptosis, to determine if the PI3K inhibitors induce cell death. The C35 exhibited higher γH2AX levels compared to WT and C8 upon treatment with both inhibitors, alpelisib and ZSTK474 (Fig. 3D). We also found that treatment with both inhibitors decreased cytokine secretion of GM-CSF, CXCL8, IL-6, and MCP-1 by the C35 cells (Fig. 3E–H). The inhibitors led to only marginal inhibition of secretory GM-CSF, CXCL8, and IL-6 from the C8 cells, with a significant decrease in MCP-1 secretion. These results suggest that PI3K-α specific inhibition adjusts or possibly mitigates the functional effects of PIK3CA mutation mediated at least partly, through a DNA damage mechanism and immune regulation.
PIK3CA-mutant hemangiosarcoma cells alter metabolic pathways associated with HIF-1α
We next sought to determine the potential mechanisms contributing to the distinct drug responses between the mutant C8 and C35 cells (Figs. 3B, S6A). Our bulk RNA-seq analysis identified a total of 1,222 DEGs (608 up-regulated and 614 down-regulated genes; adjusted p < 0.01; |log2 fold change| > 1.5) associated with the hypoxia-inducible factor (HIF)-1 and glycolysis pathway in the C8 compared to the C35 cells (Figs. 4A, S7A, B). Integrated with ATAC-seq data, the promoter region of the HIF1A was more accessible in C8 compared to C35 cells, along with the increased gene expression (Fig. 4B, C), suggesting that the transcription factor HIF-1α regulates energy metabolism in C8 cells. These findings demonstrate that distinct gene signatures reflect the phenotypic differences between C8 and C35. Genes involved glucose metabolism such as HK2, PGK1, SLC2A1, PFKL, SLC16A1, PDK1, and LDHA were highly expressed in C8 cells. In contrast, the expression of genes related to amino acid metabolisms such as SLC family amino acids transporters, MARS1, and CARS1 was decreased in C8 cells (Fig. 4B). Metabolic analysis showed that the ECAR was higher in C8 compared to C35, while both mutant cell lines exhibited increased glycolytic activity compared to WT overall (Fig. 4D). In addition, the C35 cells exhibited a higher OCR than the other cells (Fig. 4E–I). These data suggest that C8 cells rely more heavily on glucose metabolism (i.e., glycolysis) compared to the C35 and WT cells. In contrast, the C35 cells exhibited a higher mitochondrial respiratory capacity, which may be used to generate additional ATP in response to acute cellular stress.
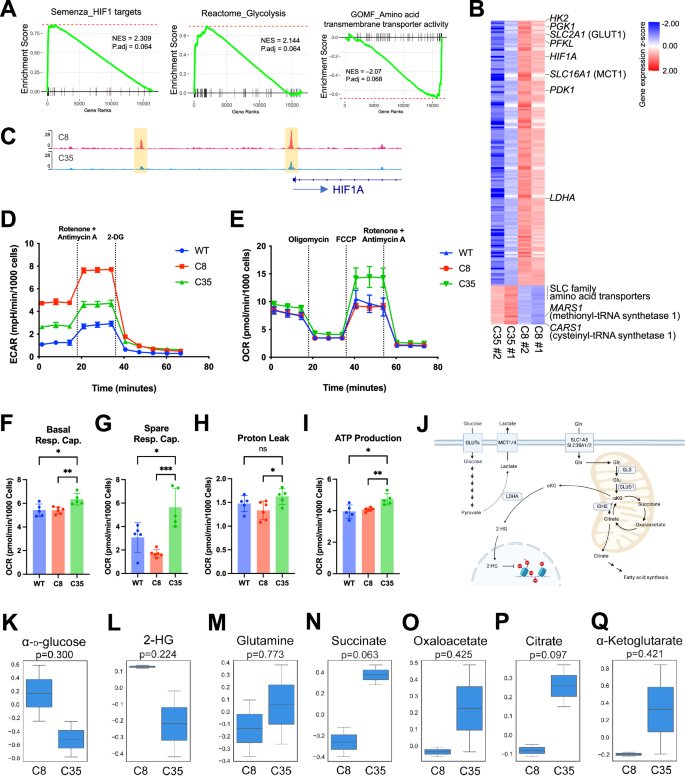
A Plots depict enrichment scores generated by fgsea analysis with a pre-ranked gene list based on Wald statistics from DEG analysis. NES and adjusted p-value were determined with 1000 permutations. B Heatmap shows the relative expression of genes associated with the enriched pathways (A) between C35 and C8 cells (red = up-regulated; blue = down-regulated). Data matrix was transformed using z-scores. A total of 172 genes are displayed. C Plot visualizes chromatin accessibility track across the HIF1A loci in C8 and C35 cells. D Analysis of glycolytic activity using a Seahorse XF Glycolytic Rate assay. E Analysis of mitochondrial metabolic activity using a Seahorse XF Cell Mito Stress assay. Oxygen consumption rate (OCR) among WT, C8, and C35 were shown as basal respiration capacity (F), spare respiration capacity (G), proton leak (H), and ATP production. I The Seahorse XF assays are representative of two independent experiments. J Schematic diagram shows key metabolites and pathways in C8 (glycolytic) and C35 (mitochondrial respiration) cells. K–Q The cellular metabolite levels in growing C8 and C35 cells were detected using a mass spectrometry-based metabolomics assay. Box plots show the mean normalized peak intensity from two biological replicates. Statistical significance was determined by two-tailed unpaired t-test.
Since our transcriptomic and metabolic analyses revealed altered glucose and amino acid metabolism in PIK3CA-mutant cells, we quantified key metabolites in these pathways using LC-MS (Fig. 4J). We observed an increase in α-D-glucose in C8 cells, indicating a higher level of cellular glucose uptake associated with the up-regulation of SLC2A1 gene (GLUT1 glucose transporter) (Fig. 4K). The genes encoding key enzymes in glycolysis including HK2, PFKL, ENO1/2, ALDOA, and PGK1 were up-regulated in C8 cells, as presented in Fig. 4B; however, none of the associated metabolites were detected in our in-house MS peak database. Moreover, despite the higher glycolytic rate observed in the C8 compared to C35, the cellular lactate levels were comparable between the two mutant cells (Fig. 4G). Consistent with the increased expression of the LDHA gene (Fig. 4B), which converts α-ketoglutarate into 2-HG under hypoxic conditions, we found higher levels of 2-hydroxyglutarate (2-HG) in C8 compared to C35 cells (Fig. 4L).
Next, we identified distinct metabolic features in C35 cells, potentially associated with mitochondrial metabolism, particularly the tricarboxylic acid (TCA) cycle. Our data suggest increased uptake of glutamine (Gln) by C35 cells (Fig. 4M) based on the elevated gene expression of glutamine transporters (SLC38A1, SLC38A2, SLC38A5, and SLC7A11) and glutamate dehydrogenase (GLUD1), which allows glutamate to enter the TCA cycle by converting it to α-ketoglutarate (Figs. 4B, S7C, D). Higher concentrations of metabolites of the TCA cycle, including succinate, oxaloacetate, citrate, and α-ketoglutarate were identified in C35 cells (Fig. 4N–Q), which aligns with the higher mitochondrial activity.
Molecular and phenotypic alterations contribute to alpelisib resistance in PIK3CA-mutant cells
Since distinct morphology and alpelisib resistance were observed between the mutant and WT cells, we characterized their cancer stem-like properties. We first examined the expression of angiogenic and vasculogenic genes, as hemangiosarcoma cells maintain vessel-forming capacity. C8 cells showed enrichment in VEGFA, KDR, FGF2, PDGFB, and ADM genes, while down-regulating PECAM1, compared to C35 and WT cells. FLT1 expression was also higher in C8 cells compared to C35, though it was lower than in WT (Fig. 5A). This enrichment was not associated with tube-forming capacity in C8 and WT, but C35 cells showed a reduction in tube formation, possibly due to a decrease in the expression of FGF, PDGF, and VEGF ligands and their receptors (Fig. 5B). We then found accelerated tumor growth in one mouse transplanted with the mutant C8 cells, which commenced at 6 weeks after inoculation (Fig. 5C, D). This tumor reached a volume of up to 1500 mm3 at 8 weeks, while all other mice displayed suppressed tumor growth, with volumes ranging from 100 to 160 mm3 when sacrificed. Next, we evaluated representative genes associated with chemoresistance (Fig. 5E). Both the mutant C8 and C35 increased the expression of ABCB4 gene by 12-fold than WT. The expression of ABCG2 gene was 5 times higher in C8 cells compared to WT and C35. ABCB1 gene was increased in C8 and WT, whereas the C35 cells showed lower expression. Furthermore, we treated the cells with doxorubicin, used as the standard of care for both human and canine vascular sarcomas. The mutant C8 cells showed the greatest resistance in response to doxorubicin, which was 3-fold higher IC50 value (mean IC50 = 1.36 µM) than those of WT and C35 (mean IC50 = 0.35 µM and 0.40 µM, respectively). The cell survival rate was 53.1% in C8 compared to 32.6% in C35 and 32.4% in WT at 1 µM of doxorubicin treatment (Fig. 5F). We also observed a greater synergistic effect in the mutant C8 cells compared to the others when treating with both alpelisib and doxorubicin (Figs. 5G, S8). Although clonal PIK3CA-mutant C8 cells demonstrate the cancer stemness properties and the phenotypic consequences that promote alpelisib resistance involving multiple ABC transporters [33, 34], none of pluripotent and self-renewal associated genes such as SOX2, MYC, KLF4, and BMI1 were significantly changed in the C8 cells (Fig. 5H).
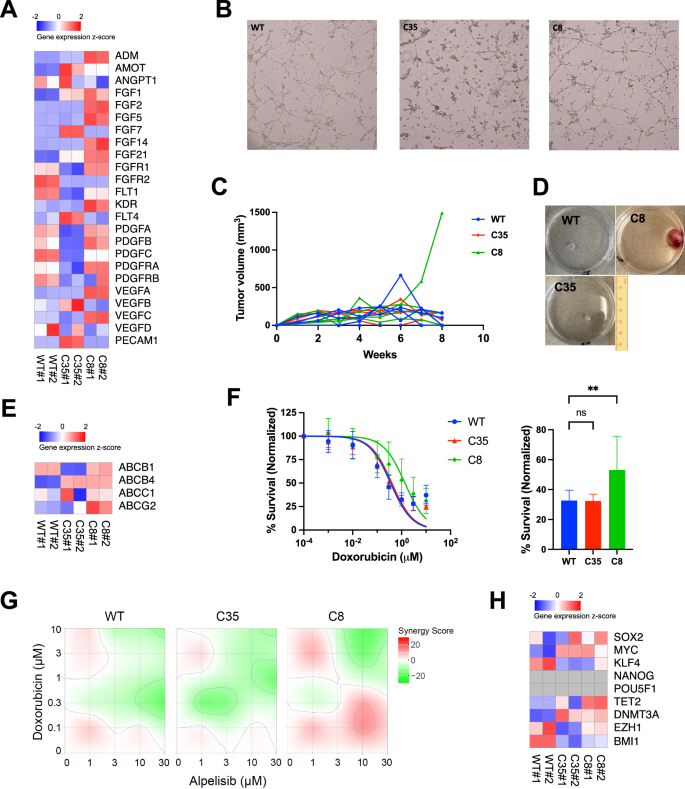
A Heatmap shows the expression level of designated genes in WT and PIK3CA-mutant DHSA-1426 cells. Normalized counts from RNA-seq were scaled by z-score. B Angiogenesis potential in WT and PIK3CA-mutant DHSA-1426 cells were measured using tube formation assay. Data show the cells grown four h after seeding on the 3-dimensional culture matrix. The presented data are representative of three independent experiments. C, D In vivo tumor formation potential was evaluated by inoculating 5 × 10⁶ cells into a 4-week-old female BNX mouse. C The plot shows the change in tumor volume measured weekly. Each line represents an individual mouse. D Representative images show various sizes of primary tumors grown after the tumor size reached allowable limits. The C8 image was obtained from the individual with the largest tumor growth. E Heatmap shows the expression of multidrug-resistant genes in WT and PIK3CA-mutant DHSA-1426 cells. Normalized counts from RNA-seq were scaled by z-score. F WT and PIK3CA-mutant DHSA-1426 cells were treated with increasing concentrations of doxorubicin for 72 h. Cell viability was measured using the CellTiter 96™ AQueous One Solution Cell Proliferation Assay. Data were compiled from two independent experiments. Error bars indicate mean ± SD. The IC50 was calculated using non-linear regression method. Bar plot shows percent survival at 1 μM doxorubicin. Statistical significance was determined by one-way ANOVA and Dunnett’s multiple comparison test; ns: not significant, *: p < 0.05, **: p < 0.01, ***: p < 0.001, ****: p < 0.0001. G Heatmaps show the Bliss synergy score for combinations of the drugs alpelisib and doxorubicin. Cell viability was measured using the CellTiter 96™ AQueous One Solution Cell Proliferation Assay. Synergy scores were determined using the SynergyFinder application. H Heatmap shows the expression of pluripotent and self-renewal genes in WT and PIK3CA-mutant DHSA-1426 cells. Normalized counts from RNA-seq were scaled by z-score.
Feedback activation of MAPK confers alpelisib resistance to PIK3CA-mutant cells
The mutant C35 cells were the most sensitive to alpelisib among the hemangiosarcoma cell lines (Fig. 3B). However, their IC50 values were approximately 10 times higher than that of the most sensitive group of breast cancer cell lines indicating a considerable level of resistance to alpelisib. To determine potential mechanisms of partial resistance in C35 cells, we generated single-cell RNA-sequencing data. Using t-SNE dimensionality reduction, we identified 11 distinct single-cell clusters in the mutant C35 cells treated with alpelisib and DMSO control (Fig. 6A). Among the clusters, two single-cell subsets (cluster 0 and 5) showed increased cell numbers after treating alpelisib, indicating the presence of drug-resistant subpopulation (Fig. 6A, B). A phylogenetic tree depicted a similarity between the two clusters based on gene signatures (Fig. 6C). These cell subsets were primarily associated with the PI3K-Akt signaling, Rap1 GTPase signaling, MAPK signaling, and cAMP signaling (Figs. 6D, S9). Marker gene identification analysis revealed that cluster 0 increased the expression of genes involved in G protein (GNAI1, VAV3, and GNG11), adenylyl cyclase (PDE4D), and calcium signaling pathways (RYR3 and CAMK2D) (Figs. 6E, S10). The anti-apoptotic gene BCL2 was also enriched in cluster 0. In cluster 5, genes associated with TGF-beta pathway (TGFB2, and TGFBR2) and cAMP signaling (PDE7B) were up-regulated (Figs. 6F, S10).
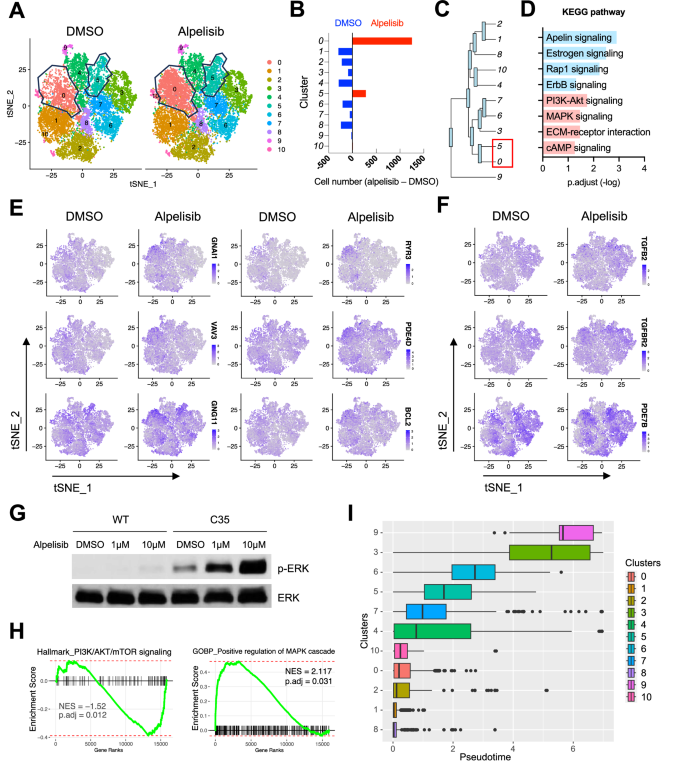
A tSNE plots visualize distinct single-cell clusters in C35 cells treated with 10 μM of alpelisib and DMSO control for 24 h. Polygon plots indicate sub-clusters with increased cell numbers following alpelisib treatment. B Bar plots depict the difference in cell numbers between groups treated with alpelisib and DMSO across clusters. C Phylogenic tree indicates the gene expression similarity. The length of branches represents the degree of difference between connected cell clusters. D Bar plot illustrates significant Kyoto Encyclopedia of Genes and Genomes (KEGG) pathways from marker genes identified in cluster 0 (blue) and cluster 5 (pink). Feature plots show differentially expressed marker genes identified in cluster 0 (E) and cluster 5 (F). G Representative immunoblotting data show dose-dependent feedback activation of phosphorylated ERK upon alpelisib treatment for 24 h in WT and C35 cells. H Enrichment plots from fgsea analysis performed with a pre-ranked gene list from the PIK3CA-mutant COSB-H1047R cells treated with alpelisib and DMSO. Gene rank was determined by Wald statistics using DESeq2 software. NES and adjusted p-value are calculated with 1000 permutations. I Boxplot shows single-cell trajectories in each cluster by assuming pseudotime from transcriptome analysis. Cluster 1, the most sensitive cluster to alpelisib, was set as a root cluster for temporal gene expression analysis in an arbitrary manner. Vertical bars indicate median pseudotime.
Since the marker gene analysis indicated MAPK pathway as one of potential resistant mechanisms, we examined functional activation of ERK. Both alpelisib and ZSTK474 enhanced phosphorylation of ERK in the mutant C35 cells (Figs. 6G, S11A), suggesting a potential compensatory mechanism mediated by MAPK signaling in response to PI3K inhibition. Another bulk RNA-seq dataset from COSB-H1047R cells also revealed that alpelisib treatment enriched genes associated with positive regulation of MAPK cascade, TGF-beta signaling, and KRAS targets, while showing negative gene enrichment of PI3K/AKT/mTOR signaling (Figs. 6H, S11B). The activation of MAPK/ERK pathway in response to alpelisib was observed in MCF10A cells harboring the PIK3CA H1047R (Fig. S11C). Further, the pseudo-temporal trajectory of single-cell clusters revealed no significant association between the order of trajectory and drug sensitivity (Figs. 6I, S12), suggesting the co-existence of drug-resistant cells in the whole cell population in prior to alpelisib treatment. Taken together, our data demonstrate the identification of single-cell subsets of PIK3CA-mutant cells that are resistant to PI3K-α inhibition, potentially through activation of multiple signaling pathways.
Discussion
Angiosarcoma is a rare form of soft tissue sarcoma. Its biology and key molecular drivers for pathogenesis are underrepresented in cancer research, leading to limited therapeutic intervention. Major research efforts on PIK3CA mutations have focused on elucidating their roles for cellular transformation and identifying new pharmacologic targets in downstream pathways [35, 36]. In this study, we demonstrate potential mechanisms through which oncogenic PIK3CA governs malignant endothelial functions in angiosarcoma.
Oncogenes may convey molecular signals that foster the tumor immune niche, beyond their role in driving malignant cellular transformation. Recently, a comprehensive omics study revealed functional networks linking genomic alterations with immune profiles [37]. This connection is partly attributed to neoantigens generated by tumor mutations, subsequently eliciting immune reactions. Such an association may also be applicable for genomically complex sarcomas like angiosarcoma and osteosarcoma [14, 38, 39]. However, molecular convergence specific to a certain condition may contribute to the lack of immunogenicity found in some tumors, despite their presentation of catastrophic genomes that potentially produce excessive foreign proteins or neoantigens [15, 40]. Our data showed that PIK3CA mutations enriched proinflammatory and chemotactic cytokines, which play a pivotal role in pro-tumor immunity [41]. In this context, driver oncogenes may amplify specific molecular pathways, fostering a discrete immune milieu that masks the products induced by a complex genome [15, 42, 43]. In angiosarcomas, distinct molecular subtypes were identified based on mutational and immune profiles, potentially mediated by PI3K, which underpin diverse clinical features and outcomes [14, 44, 45]. In addition, oncogenic PIK3CA appears to influence global epigenetic machinery and subsequent transcriptional activities, involving the regulation of focal adhesion kinase, as determined in breast cancer cells [46]. Likewise, our data showed that activating PIK3CA in hemangiosarcoma cells established accessible chromatin regions associated with cell adhesion and structural organization, as well as immune functions. These findings provide insights into the molecular convergence induced by oncogenic PIK3CA involving immune signaling, which is potentially conserved across ontogenetically distinct tumors [47].
Emerging evidence demonstrates that the dynamics of molecular signals emitted from activating mutations determine cell fate [36, 48]. A semantic review has argued that signal intensity and duration likely play a deterministic role in activating mutations, as conceptualized by “by-the-numbers scenarios” [36]. This was exemplified by the rare co-occurrence of strong activating mutations in PIK3CA and PTEN, and the lack of correlation between RAS driver mutations and their downstream signaling activity. This view aligns with our previous observations in angiosarcomas, which suggest a cross-species mechanism [15]. Specifically, angiosarcomas exhibited largely mutually exclusive patterns of key driver mutations such as TP53, PIK3CA, and RAS across both human and canine species [13,14,15,16,17, 19, 49, 50]. Multiple fusion genes were also identified in these tumors, particularly those that co-occurred with driver mutations and were associated with the enrichment of an angiogenic molecular program [15]. Although they are likely non-pathogenic or passenger mutations, it is plausible that these fusions may modulate the signal strength of activating mutations, thereby contributing to the observed molecular convergence in angiosarcomas that sustains a high level of PI3K signaling [15]. In the present study, activation of PI3K signaling was noticeable in malignant cells without PIK3CA mutations; this signaling was augmented in DHSA-1426 cells with the mutations. Curiously but not surprisingly, no discernible increase in PI3K signaling was found in COSB cells with PIK3CA mutations. One possible explanation for this difference in pathway activation could be the distinct molecular features imprinted by their original tumor sites: DHSA-1426 was derived from a splenic tumor, and COSB originated from a subcutaneous tumor. Another non-mutually exclusive possibility is that the mutations are likely to reprogram the molecular nature of the cells provoking signaling that establishes distinct immune and metabolic signatures, as addressed in molecular subtypes of angiosarcomas in both humans and canines [14, 19, 51].
Our findings from two mutant isogenic cell lines could further delineate the signaling effect. Despite the enhanced immune signaling in both mutant lines, they exhibited noticeable molecular and functional differences: C8 cells were more angiogenic and chemo-resistant, but less inflammatory than C35. C8 cells up-regulated ABC transporter genes, potentially promoting resistance to alpelisib and doxorubicin [33, 34, 52, 53]. PECAM1 gene encoding CD31 endothelial marker was decreased in C8 cells, despite the abundance of other angiogenic genes. This finding supports previous study showing that low CD31 expression appears to promote in vivo tumorigenicity and doxorubicin resistance in human angiosarcomas [54]. Metabolically, C8 cells were more glycolytic and less dependent on aerobic metabolism possibly mediated by HIF-1α, suggesting that they are better equipped for survival and proliferation under hypoxic conditions. Furthermore, our study identified drug-resistant single-cell subsets in C35, activating calcium signaling, adenylyl cyclase, G protein, and TGF-beta pathways. These pathways complement PI3K by transmitting signals to the MAPK downstream pathway, and our results also demonstrate the compensatory activation of ERK upon treatment of PI3K inhibitor. These findings suggest combined inhibition of MEK and PI3K/mTOR could have a synergistic effect on angiosarcoma [55]. However, these pathways involve a myriad of downstream signaling molecules, and our study poses limitations due to the lack of measurement of signaling dynamics. As PI3K signaling is elicited by its multifaceted nature and may impact phenotypic variances [56,57,58], future studies will be warranted to document the temporal and spatial dynamics of signaling related to activating PIK3CA, particularly in the context of vascular malignancy.
Alpelisib, a selective PI3K-α inhibitor, has shown clinical benefits for patients with hormone receptor-negative advanced breast cancer and vascular malformations harboring PIK3CA mutations [59, 60]. The vascular malformations also included TEK mutations that activate TIE2 signaling [60]. Given the crucial roles of PI3K and TIE2 signaling in vascular functions, alpelisib could be considered a promising therapeutic option for vascular malignancies. In this regard, our study could provide cell line models to evaluate its mechanism of action in angiosarcomas, pending further clinical evaluation. However, recurrent TEK mutations have not been identified in angiosarcomas yet, despite the occurrence of other mutations involved in TIE2 signaling and vasculogenesis, such as those in KDR, FLT4, and PCLG1 [61,62,63]. Thus, a careful study design and clinical assessment of the selective inhibitor based on an enhanced understanding of angiosarcoma pathology is required.
In conclusion, our work unveils the molecular and functional consequences of oncogenic PIK3CA in rare vascular cancers, shedding light on cross-species mechanisms of malignant vasculogenesis. We demonstrate that activating PIK3CA mutations not only regulates the PI3K pathway but also establish a distinct molecular program that enriches immune cytokines. Our study will help facilitate the development of novel therapeutic approaches personalized for rare angiosarcoma patients through molecular profiling.
Responses