Plasma concentrations of venetoclax and Pharmacogenetics correlated with drug efficacy in treatment naive leukemia patients: a retrospective study

Introduction
Acute myeloid leukemia(AML) is a malignant disorder of the bone marrow which is characterized by the clonal expansion and differentiation arrest of myeloid progenitor cells [1]. The incidence of AML increases with age, with a median age at diagnosis of 68 years reported in US [2]. Elderly patients were more prone to be intolerant to the traditional “3 + 7” intensive chemotherapy, making targeted therapy particularly important in AML treatment.
Venetoclax (VEN) was the world’s first approved oral B-cell lymphoma/leukemia (BCL-2) inhibitor targeting the tumor cell apoptosis pathway, which significantly improved the prognosis of elderly acute myeloid leukemia (AML) patients (≥60 years of age) [3]. Due to its desired efficacy and selectivity, VEN is currently recommended in combination with demethylating agents (HMAs) or low-dose cytarabine (LDAC) as the standard of care for unfit AML patients according to the latest NCCN guidelines [4]. Moreover, the efficacy of VEN-based regimens was varied in the treatment of other hematological tumors is currently being further explored in clinical trials [5,6,7,8,9,10].
However, studies have found VEN exposure is significantly associated with its efficacy, some Asian patients were prone to have higher exposure, which possessed risks of adverse events [11]. According to the drug label, VEN was given with a fixed dose despite ages, races, etc. As AML was more frequent in elderly patients, it is of urgent need to figure out the relationship of appropriate therapeutic concentration and drug efficacy, so as to optimize the targeted therapy.
It was reported that VEN was mainly metabolized by CYP3A4/3A5 and was a substrate of P-glycoprotein (P-gp). It was known that CYP3A4/3A5 played a crucial role in drug metabolism, and single nucleotide polymorphism (SNPs) of these genes may contribute to inter-individual viability of drug exposure [12, 13]. The distribution of CYP3A4/3A5 SNPs was varied among different races, which eventually led to the varied exposure [14]. It was reported Asian patients showed higher exposure than non-Asians, indicating the influences of different pharmaco-genetic backgrounds and more safety concerns should be paid in Asian patients [15]. Besides, CYP3A4/3A5 strong inhibitors, triazoles, were frequently co-administered in leukemia patients for anti-fungal prophylaxis due to myelosuppression. It was suggested that the dosage of VEN should be reduced at least 50% when co-administered with triazoles [16]. Nevertheless, it was reported that the genotype of CYP3A5 would significantly influence the interaction between triazoles and CYP3A5 substrate [17]. Consequently, pharmacogenomic information was important and urgently needed to be determined in VEN precise medication.
Nowadays, therapeutic drug monitoring (TDM) has been recognized as an essential tool for optimizing individualized therapy in immunosuppressive as well as oncology patients, it could reflect drug exposure with limited sampling. Pharmacokinetic guided oral anticancer agents, which also take accounts of pharmacogenetic variabilities, were proved to be effective in previous reports [18, 19]. VEN was recommended to be administered orally after meal, which could increase the bioavailability of the drug. Besides, the median Tmax of VEN after meal was 6 h, so we chose C0h(C0) and C6h(C6) as the sampling time [20]. Although efforts have been made to elucidate the important role of VEN concentration in regimen optimization in recent studies [21, 22], it is still needed to explore the accurate relationship between VEN therapeutic concentration and efficacy, especially in Asian AML patients. Herein, we report the efficacy of VEN concentration as well as its key co-factors in treating naive AML patients using real-world data.
Materials and methods
Study design
The technical route of this study is shown in Supplementary Figure S1. The clinical sample estimation was calculated by PASS 11.0 which set α = 0.05, β = 0.2 (AUC0 = 06, AUC1 = 0.85).
Clinical data
Our study retrospectively analyzed the clinical data of 54 treatment naive AML patients who chose to be treated with VEN combined therapy at first affiliated hospital of Nanchang University from March 2022 to March 2024. We collected basic demographic data, including gender, age, height, and weight, alongside routine blood, liver, and kidney function tests, such as platelets, neutrophils, hemoglobin, leukocytes, albumin, aspartate aminotransferase, alanine aminotransferase, creatinine, total bilirubin, direct bilirubin and so on. In addition, combined medications taken (e.g., posaconazole, voriconazole) were also gathered. Clinical information was obtained from outpatient and inpatient electronic medical records. Diagnosis was based on the 2017 edition of the WHO Classification of Tumors of Haematopoietic and Lymphoid Tissues diagnostic criteria [23]. All patients had their diagnosis confirmed by molecular biology, cytogenetics, leukemia flow immunophenotyping, and bone marrow cytomorphology. Patients were risk stratified according to the 2022 European Leukemia Net (ELN 2022) criteria [24], they were classified into good, moderate, and poor prognosis groups based on the results of cytogenetic/molecular genetic indicators. VEN was taken orally at a frequency of qd after meal according to the drug label. To ensure the concentration of VEN achieve steady state, the concentrations were tested at least 7 days after treatment initiation. Informed consents were obtained from the patients before the study.
Quantification of VEN for therapeutic drug monitoring by UPLC-MS/MS method
The calculated sample size was 36 (18 responsive patients and 18 non-responsive patients). The stable trough(C0) and 6h plasma concentration(C6) were collected after 7 days of VEN combined therapy. Blood samples were collected in 3–5 ml ethylenediaminetetraacetic acid potassium salt(EDTA-K2) tubes after day 7 at steady state, just before the next administration and 6 h after drug administration. The blood was centrifuged at 3500 × g for 10 min to separate the plasma and then stored in a −80 °C fridge before analysis. All samples were pretreated with protein precipitation. VEN assay Kit, which contained VEN internal standard(IS) and quality control working solution, sample release agents were purchased from Pro-solution technology Co. Ltd(20201039). AB Sciex Triple Quad 4500MD mass spectrometer was used to detect and analyze as reported [25]. VEN weight-dose corrected trough and 6 h plasma concentration were calculated from C0/(dose/body weight) and C6/(dose/body weight), noted as C0/D and C6/D respectively.
Pharmacogenomic Genotype testing
Three single nucleotide polymorphisms (SNPs) of CYP3A4 rs4646437, CYP3A5 rs776746, and ABCB1 rs1045642, which had a high frequency of variation in Asian populations, were selected for testing [26]. Peripheral venous blood from patients frozen in a −80 °C refrigerator was removed and thawed. Genomic DNA extraction was performed using the Tiangen Blood Genomic DNA Extraction Kit. Digoxin staining solution was taken, processed by centrifugation, 4 μL of the extracted DNA sample was added, centrifuged for 15 s to allow the liquid to collect at the bottom of the tube. And the patients’ genotypes were detected by fluorescent staining in situ hybridization using a multi-channel quantitative fluorescence analyzer, as we previously reported [27].
Assessment of efficacy
Bone marrow aspiration is performed between day 14 to day 28 of the chemotherapy interval to assess the efficacy of chemotherapy. The efficacy is assessed according to the 2022 ELN criteria [24]. The main indexes of therapeutic efficacy evaluation include: ① Complete remission (CR): bone marrow blasts <5%; absence of circulating blasts and blasts with Auer rods; absence of extramedullary disease; ANC ≥ 1.0 × 10⁹/L; platelet count ≥100 × 109/L. ② Partial remission (PR): all hematologic criteria of CR; decrease of bone marrow blast percentage to 5% to 25%; and decrease of pretreatment bone marrow blast percentage by at least 50% ③ No remission: no CR or PR after induction therapy The overall response rate (ORR) is defined as the proportion of patients achieving CR and PR after treatment.
Statistical analysis
Descriptive statistics were reported using either median and range for continuous data or mean ± standard deviation. Two-sample independent t-tests were conducted to compare means between two groups. Receiver operating characteristic (ROC) curves were plotted to determine optimal cut-off values for continuous variables. Hardy-Weinberg equilibrium (HWE) was assessed using chi-square tests. Statistical analyses were performed using IBM SPSS Statistics 25.0. LASSO-logistic regression were used to screen the key elements that impact the chemotherapy response. Nomogram and ROC curve were made by R package(4.2.0). The resulting plots were drawn using GraphPad Prism 9.4.1 software. Two-sided tests were used and statistical significance was considered at p < 0.05.
Results
The characteristics of patients
The study was accomplished at the First Affiliated Hospital of Nanchang University. A total of 54 treatment naive patients who underwent VEN-based chemotherapy and monitored VEN blood concentration were included. VEN blood concentration was collected and monitored at least 7 days after VEN administration, which guaranteed the steady state of VEN exposure [21]. The trough concentration C0 and C6 concentration were monitored. The baseline characteristics of these 54 treatment naive patients with AML/MDS were presented in Table 1.
Correlation between VEN blood concentration and efficacy
LC-MS/MS method to determine the VEN concentration was established successfully(Supplementary Fig. S2). A total of 76 C0 and 91 C6 measurements were taken, revealing a median C0 of 0.879 μg/mL (range: 0.051–6.163) and a median C6 of 1.85 μg/mL (range: 0.186–12.199). The patients were classified into three groups based on their efficacy assessment according to 2022 ELN guidelines: complete response (CR), partial response (PR), and non-response (NR). N represented the number of VEN blood concentration monitored. According to Table 1, patients included in this study underwent two category chemotherapy: (1) VEN combined with azacitadine(VA), and VA based chemotherapy ; (2) VEN + X chemotherapy, X indicates other chemotherapeutic agents. We introduced dose-corrected concentration to avoid the influence of confounding factors, such as body weight and dosage.
We compared the relationship of different chemotherapy regimens and different stratification with efficacy and VEN concentration. According to our results, there was no correlation between efficacy and VEN C/D in all patients or in patients on the VA-based regimen. However, VEN C6/D was correlated with the efficacy in patients with good/moderate prognosis(Fig. 1D, p = 0.006). Patients with response to chemotherapy presented with higher C6/D (0.847 ± 0.896 μg/ml.kg.mg−1 vs 0.333 ± 0.164 μg/ml.kg.mg−1). We also built a receiver operating characteristic (ROC) curve, a cut-off value of 0.2868 μg/ml.kg.mg-1.(area under the curve [AUC] = 0.7097, p = 0.1081), and suggest further study should be made to figure out the rationale ranges (Fig. 1E).

A VEN C0/D and efficacy in patients with poor prognosis(p = 0.745). B VEN C6/D and efficacy in patients with poor prognosis(p = 0.824). C VEN C0/D in patients with good and moderate prognosis(p = 0.531). D VEN C6/D in patients with good and moderate prognosis(p = 0.006). E ROC curves based on C6/D and disease remission.CR complete remission, PR partial remission, NR non-remission. C0/D and C6/D were calculated from C0/(dose/body weight) and C6/(dose/body weight).
Effect of triazoles on VEN blood concentrations
VEN was reported as the substrate of cytochrome P450 enzymes (CYP3A4 and CYP3A5). Triazole antifungals, which are known as CYP3A enzyme strong inhibitors, could increase the Cmax and AUC0-24 of VEN by 7.1-fold and 8.8-fold, respectively [28]. It was suggested in the VEN drug label that the dosage of VEN should be reduced at least 50% when co-administered with triazoles [16]. Of the 54 enrolled patients, 25 received concomitant triazole therapy, with posaconazole being administered to 9 and voriconazole to 16. Within this subgroup, a dosage adjustment to 100 mg was necessary for 7 patients (77.8%) on posaconazole and for 8 patients (50%) on voriconazole. The combination of triazoles significantly increased the C0/D and C6/D of VEN in all patients and VA-based patients. (Fig. 2). Among a total of 54 patients, those coadministered with triazoles experienced an 8.18-fold increase in the C0/D value and a 3.88-fold increase in the C6/D value of VEN (Supplementary Table S1), compared to patients not receiving triazoles. In a subgroup of 38 patients who underwent chemotherapy based on the VA regimen, the C0/D value of VEN was elevated by 6.84 times and the C6/D value by 3.6 times in those coadministered with triazoles, in comparison to those not on triazoles(Supplementary Table S2).
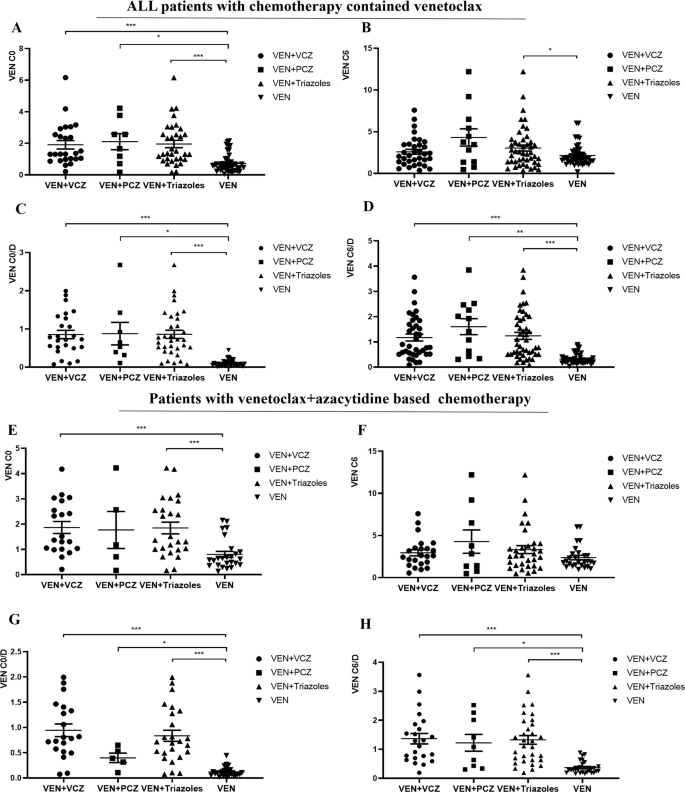
Influences of triazoles on VEN C0(A) and C6(B) as well as C0/D(C), C6/D(D) in all the patients included in this study; Influences of triazoles on VEN C0(E) and C6(F) as well as C0/D(G), C6/D(H) in patients with venetoclax+azacitidine based chemotherapy. C0/D and C6/D were calculated from C0/(dose/body weight) and C6/(dose/body weight).*,p < 0.05; **,p < 0.01; ***,p < 0.001.
Effects of SNPs on VEN blood concentrations
VEN mainly metabolized by cytochrome P450 enzymes (CYP3A4 and CYP3A5) and is also a substrate of ABCB1 [ref. 29]. As the distribution of SNPs (single nucleotide polymorphisms, SNPs) differed among races, a fixed dose may reflect varied efficacy and toxicity in different populations. Based on this, we also tested and analyzed genotypes of the above three genes, CYP3A5 rs776746, ABCB1 rs1045642, and CYP3A4 rs4646437. According to our results, only CYP3A5 rs776746 and ABCB1 rs1045642 was found to be significantly associated with VEN C/D(Fig. 3). The Hardy-Weinberg equilibrium test also was made to ensure the population included in our study achieve genetic balance(Supplementary Tables S3, 4).
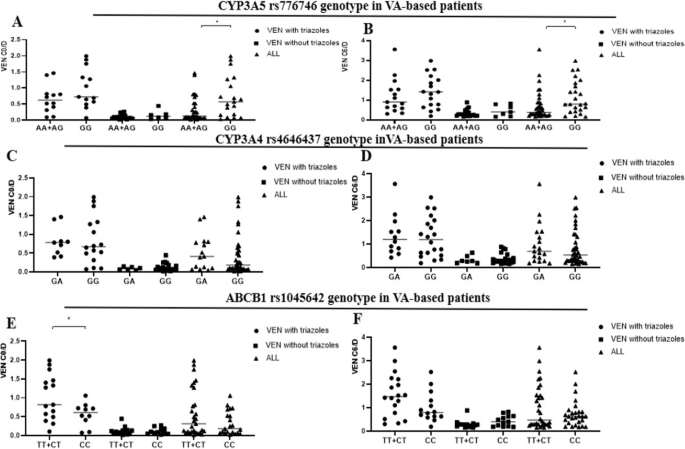
The influence of CYP3A5 rs776746(A, B), CYP3A4 rs4646437(C, D), and ABCB1 rs1045642 genotypes(E, F) on the exposure of VEN in patients with VA-based chemotherapy regimens, *p < 0.05.
The relationship between the genotype of CYP3A5 rs776746, ABCB1 rs1045642, and CYP3A4 rs4646437, and VEN C0/D and C6/D in the subgroup treated with the VA-based chemotherapy regimen was shown in Fig. 3. The GG genotypes of CYP3A5 rs776746 revealed higher C0/D and C6/D than the AA + AG genotype in patients treated with VA regimen (Fig. 3A, B), with statistically significant differences (p = 0.019 and p = 0.032). When it comes to ABCB1 rs1045642, TT + CT genotypes demonstrated a statistically significant higher C0/D when VEN was co-administered with triazoles in the overall patient group on the VA regimen (p = 0.023) (Fig. 3E). No significant differences were observed in VEN C0/D and C6/D between patients with varied CYP3A4 rs4646437 genotypes (Fig. 3C, D).
Multivariate analysis and LASSO regression to screen the core elements may influence drug response
As mentioned above, the efficacy of target chemotherapy in unfit AML was crucial in clinic, we firstly made univariate analysis (Table 2). According to our results, chemotherapy regimens, ABCB1 genotype, neutrophils and platelet counts, hemoglobin, neutrophils percentages have significant correlation with chemo-response. Then LASSO-logistic regression was employed to screen the factors, excluding collinearity issues, prognostic risk stratification, chemotherapy regimens, platelet counts and neutrophil percentages were identified as the risk factors that may influence the response of chemotherapy (Fig. 4A, B).
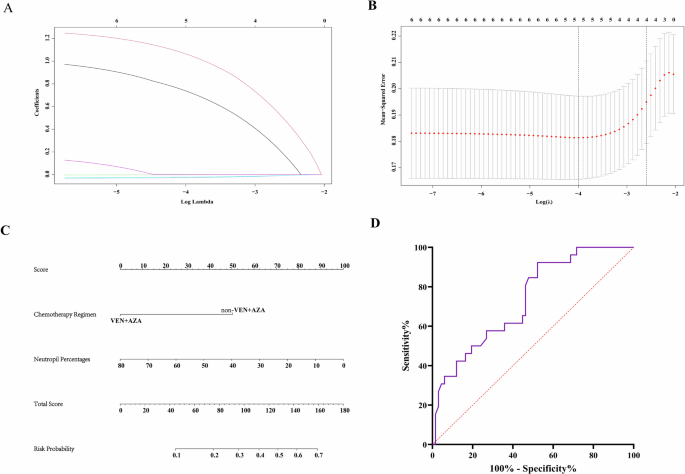
A LASSO-COX regression of the 5 key elements. B Cross-validation for the tuning parameter (λ) selection in the LASSO regression. C Nomogram to predict the response probability in AML patients treated with venetoclax. D ROC curve to evaluate efficiency of nomogram(AUC = 0.733, p = 0.001).
We then set the chemotherapy response as the dependent variable, further analyzed the risk factors that may have impacts. Finally, chemotherapy regimens, neutrophils percentages were identified as the independent risk factors. Based on the above results, nomogram and ROC curve (AUC = 0.733, p = 0.001, specificity = 0.478, sensitivity = 0.923) were made and further validated the results, which indicate non-VA based chemotherapy and high neutrophil percentage may have higher risk of treatment failure (Fig. 4C, D).
Discussion
Venetoclax was the first approved Bcl-2 inhibitor by FDA and showed more rational efficacy and selectivity than traditional chemotherapy [3, 10]. Treatment failure due to insufficient drug exposure may hinder its efficacy. In this study, we enrolled 54 treatment naive unfit AML patients who underwent VEN combination chemotherapy, and found C6/D of VEN correlated with efficacy, especially in patients with good and moderate prognosis stratification, which correlated with previously reported results [21, 22]. Triazoles were known to be strong inhibitors of CYP3A4/3A5 enzymes, and VEN was recommended to reduce the dosage of at least 1/3 in the drug label [16, 30]. However, the C0/D and C6/D were still higher when combined with voriconazole or posaconazole. CYP3A5 rs776746 genotype was found to be correlated with C0/D and C6/D in VA-based regimens. Through LASSO-logistic regression and nomogram analysis, ELN prognostic stratification and neutrophil percentages were determined as the critical elements that may predict drug response. Consequently, our results confirmed that ELN stratification was applicable in these treatment naive unfit AML patients. C6/D level may correlate with drug response, especially in good and moderate stratification patients, co-administered with triazoles or carried by AA/AG CYP3A5 rs776746 should be paid more attention in order to attain sustainable efficacy with limited toxicity.
In this study, there were some variations in the dosage and treatment duration of VEN among leukemia patients, which attributed to personalized approach to therapy. It was reported overexposure to VEN was associated with prolonged-duration of neutropenia in Asian patients with AML [31], which was also in accordance with our research. In clinical practice, dosage would be tailored mostly due to increased toxicity. Previous pharmacokinetic analysis indicated that Chinese subjects were prone to reach higher VEN concentrations than non-Asians [31, 32], which also suggested more precise administration were needed.
As mentioned above, it was observed that Asian patients had a higher relative bioavailability compared to non-Asian patients, resulting in a mean elevated steady-state area under the concentration-time curve (AUC) of ~67% [33]. Another study on VEN therapeutic drug monitoring revealed that patients with smaller body surface areas tended to have higher VEN blood concentration [15]. According to our results, 45 patients completed the first course of treatment with VEN for 28 days, 2 patients for 21 days, and 7 patients for 14 days, respectively. Notably, among the 45 patients who underwent the 28-day course, 36 patients had their VEN dosage escalated to 400 mg. The average duration of the 400 mg dosage was 18.8 days (18.8 ± 9.4), which is shorter than the standard treatment duration of 26 days.
Besides, triazoles were usually applied in AML patients for antifungal prophylactic or target therapy, which indicate moderate to severe drug-to-drug interactions. It was recommended a dose reduction to 70 mg when combination with posaconazole, and 100 mg when combined with other strong CYP3A4 inhibitors [16]. Similarly, in Japan, the recommended dose of VEN for maintenance therapy is 50 mg in combination with voriconazole and interestingly, the mean plasma concentration was 0.73 μg/mL, similar to the steady-state plasma concentration of 400 mg VEN (0.808 ± 0.593 μg/mL) reported in a Japanese Phase 1/2 study [34]. According to our results, VEN concentration(C0 and C6) was significantly higher in the group of patients with triazoles co-administration despite VEN dose reduction(Supplementary Tables S5, 6). Above all, VEN concentration monitoring was crucial and of great importance for Asian patients, especially when co-administered with triazole drugs.
Additionally, VEN mainly metabolized by cytochrome P450 enzymes (CYP3A4 and CYP3A5) and is also a substrate of ABCB1 [ref. 29]. It was known that this mode of metabolism would be significantly affected by drugs and food [35], especially when VEN is used together with potent or moderately potent CYP3A or P-gp inhibitors. Such inhibitors could alter the exposure of drugs, such as peak blood concentration (Cmax) and area under the concentration-time curve from 0 to infinity (AUC0-INF) of VEN. Triazole antifungals, which are known as CYP3A enzyme inhibitors, were reported to increase the Cmax and AUC0-24 of VEN by 7.1-fold and 8.8-fold, respectively [28]. Since VEN is an oral small molecule targeted drug, its blood concentration during oral administration exhibits high individual variability. To mitigate the influence of these factors, monitored blood concentration can help to adjust the optimal dosage of VEN. Study has found when VEN combined with voriconazole, the peak concentration of VEN can be increased to the same level as the higher VEN dosage group, suggesting a potential interaction between the two drugs [36]. Our study further disclosed that, out of a total cohort of 54 patients, those co-administered with triazoles demonstrated a significant increase in the C0/D value by 8.18-fold and in the C6/D value by 3.88-fold for venetoclax (VEN), in comparison to patients not receiving triazoles.
It was widely accepted that gene polymorphism plays a significant role in individual differences, with pharmacological and pharmacogenomic studies indicating that 20–95% of variations in drug disposition and effects are attributed to genetic factors [26]. Notably, CYP3A4/5 gene polymorphism can influence VEN metabolism, and one recently discovered single nucleotide polymorphism (SNP) site is CYP3A5 rs776746. Additionally, the most extensively studied SNP site to date is CYP3A5*3, which exhibits a mutation rate as high as 65% in the Chinese population. Our study results indicated that among patients undergoing chemotherapy with the VA-based regimen, those with the CYP3A5 rs776746 GG genotype exhibited significantly higher C0/D and C6/D values compared to patients with the AA + AG genotypes. This finding suggested that patients with the AA + AG genotypes may require a higher dose of VEN to achieve appropriate blood concentration levels. It is worth noting that VEN is primarily metabolized by the CYP3A4 enzyme, and coincidentally, voriconazole and posaconazole, strong inhibitors of the same enzyme, significantly increased the plasma concentration of VEN.
Meanwhile, we also found a significant correlation between ABCB1 rs1045642 and the pharmacokinetic parameter C0/D of VEN. ABCB1 is responsible for encoding P-glycoprotein (P-gp), a transmembrane efflux pump that utilizes cellular energy to transport a broad range of substrate drugs out of cells, consequently diminishing their intracellular concentrations. Given that VEN is recognized as a substrate for P-gp [29], the genetic variability within the ABCB1 gene could potentially modulate the plasma levels of VEN. ABCB1 was widely expressed on the surface of intestinal epithelial cells as well as liver cells [37]. It was presumed ABCB1 rs1045642 carried C > T mutation may reduce the intracellular concentration of VEN, which ultimately reduce the drug exposure.
This study had some limitations. Firstly, though C6/D were found to be correlated with response rate, the concentration ranges still hard to establish mainly due to limited sampling; Secondly, CYP3A5 and ABCB1 genotypes may be a critical factor that influenced drug exposure, but only chemotherapy regimens and neutrophil percentages were ultimately found to be correlated with response rate through LASSO-logistic regression, which may due to limited sample size. Besides, only limited CYP3A5, CYP3A4, and ABCB1 genotypes were taken into consideration, which may be not sufficient to predict the VEN concentration. Other genotypes that may influence the co-administered drugs (such as CDA, MTHFR influence azacitidine, CYP2C19 influences voriconazole, etc.) [38, 39] should be taken into consideration in future work. Therefore, a large-scale preliminary study should be conducted to further verify the results and explore more potential genotypes so as to construct a rational regimen for patients with triazoles co-administration or carried varied CYP3A5/ABCB1 genotypes.
Conclusions
Consequently, this study extensively evaluated and analyzed the relationship between VEN concentration and chemotherapy response in treatment naive AML patients. We also compared and evaluated factors that may influence VEN concentration. Finally, we explored VEN concentration as one of the dependent factors and confirmed that ELN stratification was applicable in these treatment naive unfit AML patients. We found C6/D level may correlate with drug response, especially in good and moderate stratification patients, co-administered with triazoles or carried by GG CYP3A5 rs776746 and TT/CT ABCB1 rs1045642 should be paid more attention in order to attain sustainable efficacy with limited toxicity.

Responses