Pluvial flood impacts and policyholder responses throughout the United States
Introduction
Flooding poses a major threat worldwide, leading to loss of life, property damage, and high recovery costs1,2. It is one of the most disastrous types of natural hazards globally2. Not only are flood events historically disastrous, but flooding is becoming more common and extreme as a result of climate change and land use change3,4,5,6,7. Climate change is leading to increased heavy precipitation intensity and frequency3,4, which has been shown to be linked with spatially changing flood patterns8,9. The relative flood impacts of climate change are compounded with land use changes such as increased urbanization and impervious cover, both of which contribute to increased flood risk5. While coastal flooding from storm surges and inland river flooding are well-known flood types, pluvial floods resulting from intense rainfall overwhelming drainage capacity in areas with or without stormwater infrastructure are also a significant source of flood damage, especially in urban areas10,11,12,13,14.
Assessing and forecasting flood risk is becoming increasingly important as urban development expands and extreme rainfall events become more common with climate change13,15,16. This is especially important for tasks such as developing flood prevention infrastructure or establishing insurance requirements (for property and life) to mitigate damages for residents. However, pluvial floods are particularly challenging to analyze and predict due to their localized nature and complex interactions with ground elevations, drainage infrastructure, and precipitation patterns10,12,17. Although the literature has highlighted numerous approaches that can be employed to assess flood risk, such as utilizing historical flood data10,18,19,20,21,22,23, employing modeling techniques17,24,25,26, or more recently, using satellite imagery data27, these methods are limited by the accuracy of spatial and temporal data, as well as their ability to assess damages. This leads to difficulties in quantifying the actual impacts caused by flooding.
In recent years, with the proliferation of data availability, particularly the availability of flood damage-related information collected and published by insurance companies/agencies such as the National Flood Insurance Program (NFIP) in the U.S., large-scale flood risk assessments have become more feasible. Specifically, the NFIP provides federal flood insurance to property owners. Flood Insurance Rate Maps (FIRMs) produced by the Federal Emergency Management Agency (FEMA) delineate Special Flood Hazard Areas (SFHAs) representing the 100-year floodplain28,29. Properties outside SFHAs (also referred to as “non SFHA” or “outside the 100-year flood zone” throughout this study) are those assessed by FEMA to have less than a 1% chance to flood annually. Property owners can only purchase NFIP coverage if their community has a FIRM. Additionally, properties inside the SFHA are required to purchase flood insurance if they have federally backed-mortgages. Historically, FIRMs have focused on riverine and coastal flood risks as primary types, with limited consideration of pluvial flood risk outside of designated ponding zones29,30.
The use of NFIP claims data to assess flood damage has been employed in many previous studies; however, in most of them, pluvial floods were not the primary focus of analysis or were not considered a significant driver of damage19,20,21,22,23. Two studies have been conducted that highlight pluvial floods10,26. Blessing et al.26 used a subset of NFIP claims data to analyze flood damage around Houston, Texas, emphasizing the role of pluvial floods in property damages located outside the FEMA-designated 100-year flood zones. The study by Tonn and Czajkowski10 was more extensive, covering the contiguous United States (CONUS), but focused only on comparing the differences (in terms of claims and damages) between pluvial and fluvial floods. No studies have investigated the spatial distribution of pluvial flood damage and the factors influencing varying degrees of pluvial flood impacts. More specifically, there is a clear lack of information regarding the relationship between regional hydrometeorological trends and pluvial flood patterns for CONUS.
In general, the number of claims and damages is contingent upon the number of insurance policies. That is, the number of flood claims cannot exceed the number of insured households covered by insurance companies. It is noteworthy that not all households are mandated to purchase flood insurance, particularly those situated outside SFHAs28. Previous work has reported for the U.S. that only 1% of flood damage occurring outside the mapped SFHAs is insured31, despite estimates of 14–50% of all NFIP damages occurring outside the SFHA20,31. Another study found 75% of insured losses occurred outside the SFHA for an 11-year period in Houston, Texas26, highlighting the heterogeneity of flood loss for properties outside the SFHA. Other investigations have also found that relatively few people possess flood insurance if their property lies outside SFHAs32,33. Additionally, newer residential structures outside the 100-year flood zone experience more flood damage than older residential structures outside the 100-year flood zone, indicating that people living outside SFHAs may be complacent in their flood risk assessment20. Although recent efforts, such as FEMA’s Risk Rating 2.0, have begun accounting for pluvial flood risk when determining insurance premiums34, the underlying FIRMs remain unchanged, leaving many properties susceptible to pluvial floods still mapped outside high-risk zones. With the impact of pluvial floods considered to be an increasing trend in the last decade11, it is necessary to investigate the perception and response of property owners to their pluvial flood risk. Understanding this connection between property owners and their pluvial flood risk can highlight the effectiveness of different community engagement activities or policies regarding flood insurance for increasing flood risk awareness and insurance participation. This is especially important in situations where they are not mandated to purchase flood insurance because the property lies outside the SFHA. There are also many properties inside the SFHA without flood insurance because properties without federally backed-mortgages are not required to purchase flood insurance. It should be noted that the tendency to acquire flood insurance not only reflects individuals’ awareness of potential resilience enhancement and vulnerability reduction, but also evaluates the effectiveness of relevant authorities’ management and highlights the necessity for actions to mitigate pluvial flood damage35,36,37. However, this remains an open knowledge gap as this aspect has not been explored in previous studies.
To address understanding the distribution of regional patterns of pluvial flood impacts and drivers, as well as the response of property owners to pluvial floods, our study takes a novel approach by leveraging a subset of publicly available NFIP claims for non SFHA properties in conjunction with U.S. Geological Survey (USGS) streamflow records to distinguish insurance claims arising from pluvial flood drivers. NFIP policies data and nationwide precipitation data are also incorporated to characterize the regional patterns of pluvial flood impacts and corresponding flood insurance take-up across CONUS, which ultimately showcases the need for improved pluvial flood risk considerations in flood management strategies.
It is important to note our methodology analyzes a subset of all flood insurance claims that limits the generalizability of our results for the entire CONUS. Specifically, we assess a subset of NFIP claims and policies for non-SFHA properties only throughout this study (Supplementary Fig. 1, see Methods). This leaves out a significant proportion of properties that have experienced damage due to flood events, including properties inside the SFHA, properties covered through private insurers, and non-SFHA properties we did not analyze due to insufficient USGS data.
Results
Pluvial flood impacts
We generally define pluvial floods as those that are sourced by rainfall water that overwhelms the surface or belowground drainage capacity of the area (with or without stormwater infrastructure). In the study, this general, process-based definition is placed in the context of the NFIP claims data set. Specifically, we consider claims for non-SFHA properties (i.e., recorded to be outside of the 100-year flood zone based on information submitted with the claims, see Methods) to be caused by pluvial floods if they occur inside a USGS watershed where the flow was less than a 100-year event for the three days spanning the claim’s listed date of loss (the day before, the day of, and the day after). Flow events of equal or greater than a 100-year flow event magnitude (hereinafter “100-yr + ”) cannot be assumed to be caused by pluvial floods. This narrower, claim-based definition is consistent with the general process-based definition. We exclude claims that are for properties located within the 100-year flood zone because these properties are susceptible to flooding that occurs as a result of flow events below the 100-year return period, preventing us from distinguishing if these claims were caused by pluvial floods.
Based on above, for each claim analyzed, we designated a claim to be caused by one of the following: a pluvial flood or a “100-yr + ” flood. With the availability of data described, we were able to analyze 216,994 of the original 704,131 non SFHA claims.
The analysis of NFIP claims originating from properties located outside SFHAs reveals that the majority of these insurance claims are attributed to pluvial flood drivers (Fig. 1). We found that 87.1% of the claims analyzed for this subset of non-SFHA properties over the period of 1978–2021 are classified to be due to pluvial floods. The remaining 12.9% of claims analyzed cannot be unambiguously associated with a specific type of flood event (and thus are referred to as “100-yr+ events”).
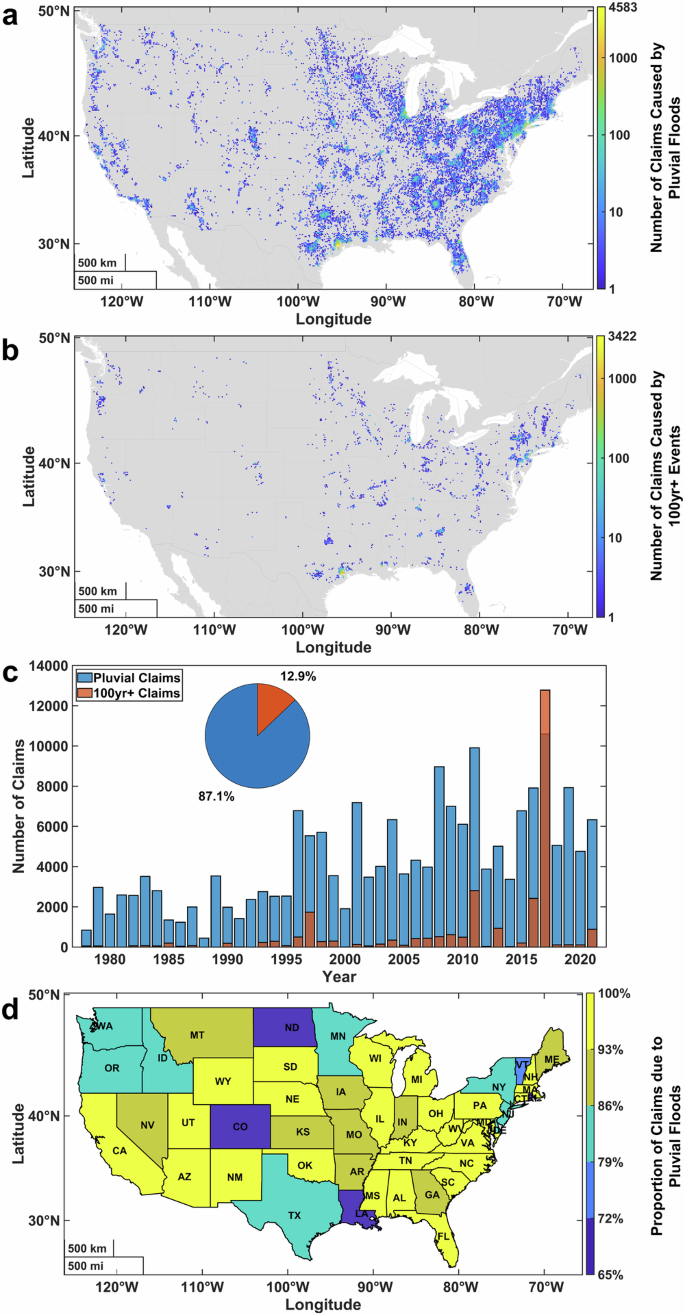
a-b Location and density of claims estimated to be caused by pluvial flood (a) and 100-yr+ flood (b) events, where the location of each insurance claim is rounded to 1 decimal point by the NFIP. c Time series of the annual number of claims estimated to be caused by pluvial and 100-yr+ flood events (the bars are not stacked). The pie-chart insert shows the percentages of all claims analyzed that are due to pluvial flood or 100-yr+ flood events. d Map of pluvial floods’ contribution to the total number of claims analyzed for each state. All illustrated data represents non-SFHA claims from the period 1978–2021 inside a USGS watershed with sufficient streamflow records for our analysis.
While we found the majority of non SFHA claims analyzed are a result of pluvial floods, we are working with the assumption that the SFHAs are adequately mapped. In reality, many FIRMs are outdated and contain inaccuracies that often underrepresent the 100-year flood plain38. However, a sensitivity analysis reveals that using a 50-year in place of a 100-year discharge threshold results in 82.2% of the claims analyzed still being due to pluvial floods (Supplementary Table 1), indicating that our results are robust even if the mapped SFHA is inaccurately small. We also discovered that many non-SFHA flood claims occur even for events below the 1-year return period. Specifically, 68.6% of the claims analyzed are determined to be caused by pluvial floods when using the 1-year discharge threshold.
When claims are aggregated by state, the median percentage of claims analyzed over 49 States (CONUS and Washington D.C.) that were classified as pluvial events is 93.2%, (coefficient of variation of 9.4%). The minimum and maximum percentages of pluvial claims are 67.4% (Rhode Island) and 100% (Washington D.C.), respectively. Notably, the Pacific Northwest states of Washington, Oregon, and Idaho exhibit a relatively higher percentage of claims caused by 100-yr+ flood events (Fig. 1d). North Dakota and Minnesota also experience a larger proportion of claims resulting from 100-yr+ flood events, primarily due to the significant 1997 Red River flood, which generated numerous claims from areas outside SFHAs. Similarly, Colorado’s 2013 massive flood event contributed to a higher proportion of claims associated with 100-yr+ flood events in that state. Some coastal states along the Gulf of Mexico and the Atlantic Ocean, influenced by tropical cyclones, are among the other states with a higher percentage of claims from 100-yr+ events.
To assess the extent of damage associated with each flood claim, we calculate the ratio of the total amount paid on the claim to the total amount covered by the insured claim (see Methods). Claims with damage percentages greater than 0% and less than or equal to 100% are included in the analysis. The results indicated that pluvial flood claims incur a median damage of 9.4%, substantially less than the median damage of 31.7% caused by 100-yr+ flood events. This translates to a median monetary damage of $9,508 per claim for property damages due to pluvial floods and $51,250 per claim for property damages due to 100-yr+ flood events. However, the total amount paid on all pluvial claims analyzed is greater than 100-yr+ claims since the majority of claims analyzed are due to pluvial floods. The total amount paid is 4.0 and 2.3 billion dollars for insurance claims from 1978–2021 due to pluvial floods and 100-yr+ events, respectively. Damages due to pluvial claims are highly skewed to the right, with the exception of claims incurring 100% damage (Fig. 2a). The damages due to 100-yr+ events have a larger proportion of 100% damage claims than pluvial claims, which is expected since these events are assumed to be more severe than pluvial floods. The monetary distribution of the $4 billion paid for pluvial claims is also skewed, where 50% of this total is due to the occurrence of about 9% of the largest pluvial claim payouts. For the claims caused by 100-yr+ events, 50% of the $2.3 billion paid is due to about 15% of the largest 100-yr+ claim payouts. These distributions appear to indicate the emergence of areas of acute pluvial flood impacts for the largest events, as opposed to ubiquitous niches of pluvial flood occurrences.
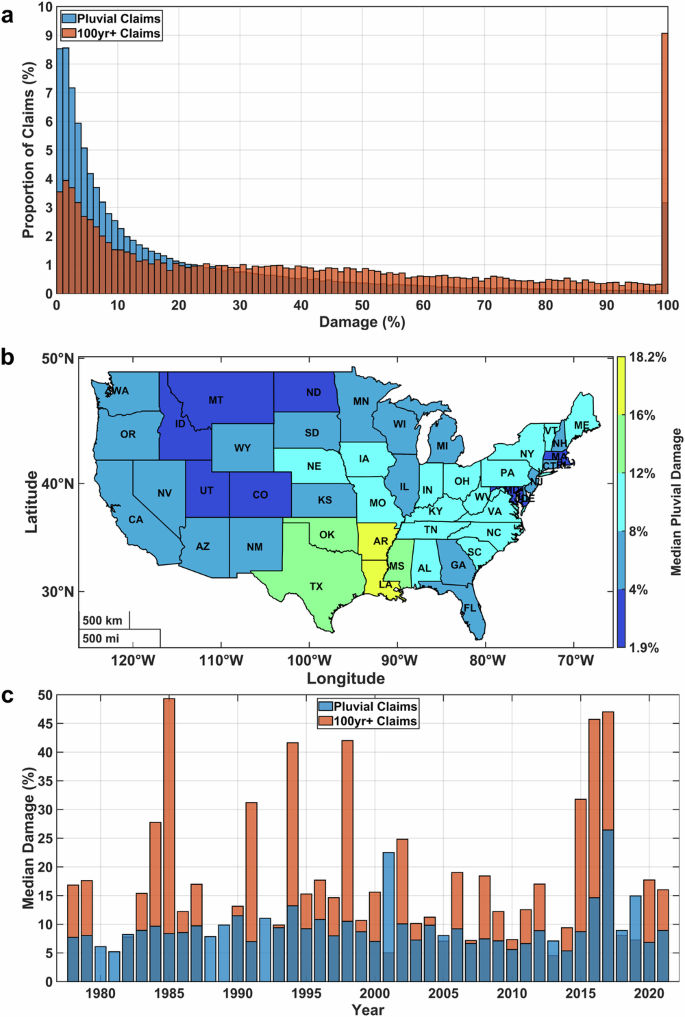
a Distribution of the damage percents for claims caused by both pluvial and 100-yr+ events. b Median damage percent each state incurred due to pluvial floods. c Time series of the relative damage caused by pluvial and 100 yr+ flood events. The bars in a and c are not stacked. All subplots represent insurance claims zoned outside the SFHA from 1978–2021 for CONUS.
Furthermore, the analysis revealed distinct geographic patterns in the severity of pluvial flood damages across the contiguous United States. Individual states experienced a median pluvial flood damage of 7.4% (coefficient of variation of 46.7%). The largest pluvial flood damages occurred in Louisiana (18.2% median damage), while the least pluvial damages were observed in North Dakota (1.9% median damage). A distinct geographic pattern emerged, with five southern states (Oklahoma, Texas, Arkansas, Louisiana, and Mississippi) experiencing the greatest pluvial flood damages in the contiguous United States. States in the western half of the U.S. generally incurred less pluvial flood damage than states in the eastern half, with a few exceptions along the East Coast (Fig. 2b). These geographic trends remained consistent when analyzing claims for building damage percentages alone (Supplementary Fig. 2).
The analysis did not uncover any significant temporal trends in the yearly median damage percentages caused by pluvial floods for the contiguous U.S. from 1978 to 2021 (Fig. 2c). During this period, pluvial floods resulted in a relatively consistent yearly median damage of 8.7% (coefficient of variation of 41.9%) and an insignificant trend in median pluvial flood damage (Mann-Kendall test, see Methods). Additionally, the majority of individual states exhibited insignificant trends in yearly pluvial flood damages (Supplementary Fig. 3). However, two states, Mississippi and Texas, experienced significant increases in pluvial flood damages since 1978 (Supplementary Fig. 3).
Decreasing uptake in insurance for properties outside the SFHA
Analysis of all non-SFHA policies from 2010 to 2021 reveals that the majority of states in the contiguous United States experienced a significant decrease in active policies for properties outside the SFHA from 2010 to 2021. Specifically, 25 out of the 49 states analyzed (51.0%) exhibit a significant decline in the number of monthly active non-SFHA policies during this period. In contrast, only 16 states (32.7%) recorded a significant increase in active policies, while the remaining 8 states (16.3%) did not exhibit any significant trend (Fig. 3a & Supplementary Fig. 4).
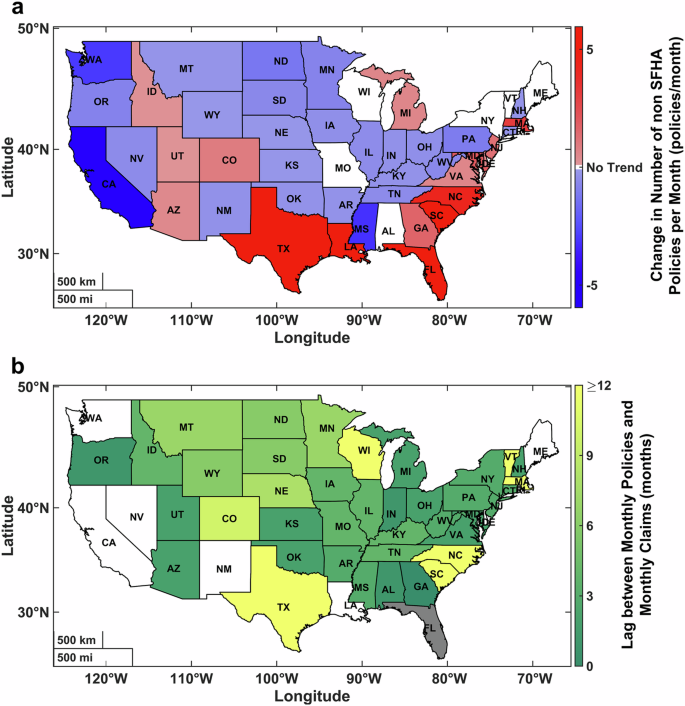
a Trends in the number of all active non-SFHA policies, aggregated monthly from January 2010 to December 2021, at the state level. Blue and red represents states with significant decreases and increases ((p < ,)0.05) in active monthly policies, respectively, according to the Mann-Kendall test. White color indicates insignificant trends ((pge ,)0.05) in the number of active monthly policies for a state. b Lag time determined for the statistically significant cross-correlation between the monthly time series of pluvial claims and monthly time series of the active policies, aggregated by state. Grey states are those with an insignificant correlation for the lag time between claims and policies. White states have a negative lag time. The policies analyzed in b have coordinates inside a USGS watershed boundary with streamflow data during the year(s) the policies were active (meaning these policies had the potential to result in a claim caused by a pluvial flood in our analysis).
Notably, a geographic pattern emerged, with many states along the East and Gulf Coasts experiencing a significant increase in active non-SFHA policies between 35.5 (Texas) and 0.4 (Delaware) policies per month from 2010 to 2021. Additionally, the mountain states of Idaho, Utah, Colorado, and Arizona formed a distinct regional cluster with increasing numbers of active policies.
To analyze the potential impact of pluvial flood events on insurance policy uptake following an event, NFIP policies issued for locations outside SFHAs have been identified. Similar to the methodology employed for determining pluvial flood claims, a subset of these policies located within USGS watershed boundaries with available streamflow data during the policy’s effective period are considered eligible for potential pluvial flood claims (see Methods). Of the original 25,808,013 non-SFHA policies available, we determined 8,120,166 of these policies met these listed requirements.
Using these eligible non-SFHA policies and the claims determined to be caused by pluvial floods, the cross-correlation was calculated to assess the lag time between the monthly time series of pluvial claims and monthly time series of eligible non-SFHA policies for each state (Fig. 3b). Of the 49 states analyzed, two states (Florida and Rhode Island) had insignificant correlations between these time series ((pge 0.05)). Seven states have lag times less than 0 months (California, Delaware, Louisiana, Maine, New Mexico, Nevada, and Washington). Of the other 40 states with significant lag times greater than or equal to 0 months, indicating these states see a response in policies following the time series of pluvial claims, the overall median lag time is 3 months (coefficient of variation of 1.1 months). For 31 of these states, the lag period is between 0 and 6 months.
Regional variations in the relationships between precipitation and pluvial flood claims
The analysis of precipitation patterns leading up to pluvial floods revealed spatially distinct relationships between 5-day cumulative precipitation totals and the number of pluvial claims per state across the contiguous United States from 1979 to 2021. All CONUS states exhibited an increase in pluvial flood claims with the 5-day cumulative precipitation preceding a pluvial event (Fig. 4a). However, the magnitude and variability of this relationship differed significantly across the United States.
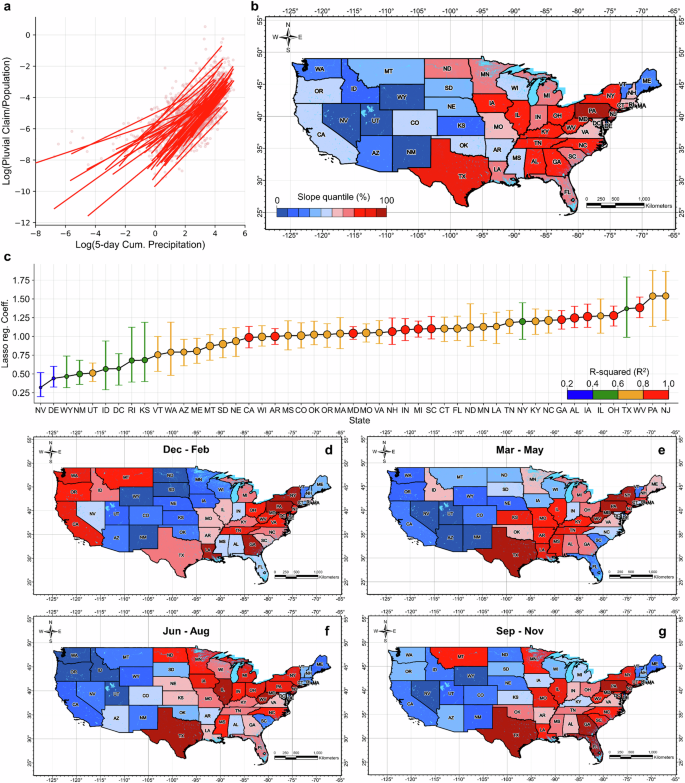
Pluvial claim sensitivity to precipitation across CONUS from 1979 to 2021. The total number of pluvial claims divided by the total population of each state ((y)) and the preceding 5-day cumulative precipitation matching the date of claim occurrence ((x)) are calculated annually40. a The regression lines for each state, calculated by Lasso regression with the mean intercept ((bar{alpha })) and slope ((bar{beta })), are determined through bootstrapping methods repeated 1000 times ((y=bar{beta }x+bar{alpha })). Slope values (bar{beta }) for all states, representing the claim sensitivity to precipitation, are statistically significant according to the t-test for the slope of regression line ((p < ,)0.05). b The slope quantiles from 0 to 100 are divided into ten equal intervals and mapped spatially at the state-level for CONUS. c The slope values for each state are sorted in ascending order for CONUS. The values of the coefficient of determination (({R}^{2})) are depicted by the size and color of the circle, and the whisker bounds indicate the 5th to 95th percentile of bootstrapped slope values. d-g Sensitivity of pluvial claims to 5-day cumulative precipitation broken into four seasonal groups. The slope quantile legends for d–g are the same as in b.
The analysis employed Lasso regression to quantify the relationship between precipitation and pluvial flood claims (L1 regularization is used to avoid overfitting even with small sample sizes). Precipitation for each state is taken by averaging hourly precipitation values to calculate daily mean total precipitation (see Methods). The state of Nevada exhibited the lowest Lasso regression coefficient of 0.319, indicating a relatively weak association between precipitation and pluvial flood claims. In contrast, the state of New Jersey displayed the highest coefficient of 1.540, suggesting a stronger positive relationship between these variables (Fig. 4b&c).
Notably, a distinct geographic pattern emerged from the analysis, revealing a stronger relationship between precipitation causing pluvial floods and the number of pluvial claims in the eastern region of the United States compared to the western region (Fig. 4b). This finding suggests that, for a given amount of precipitation, the eastern United States experiences a higher number of pluvial flood claims per state population than the western region.
To further investigate potential seasonal variations, the analysis grouped the cumulative precipitation and pluvial claims data into four seasons. While the eastern part of CONUS exhibited a consistent relationship between precipitation and pluvial claims across seasons, many western states displayed stronger precipitation-pluvial claim trends during the winter season (Fig. 4d–g), consistent with wetter conditions of the ground and the period of occurrences of “atmospheric rivers”39. Interestingly, the range of Lasso regression coefficients did not vary substantially among seasons, with values ranging from approximately 0 to 1.5 for all four seasons, similar to the range observed at the annual scale of analysis (Supplementary Fig. 5).
These findings highlight the regional variations in the relationship between precipitation and pluvial flood claims across CONUS. The eastern region exhibited a stronger positive association between precipitation amounts and the number of pluvial claims per state population, suggesting a higher sensitivity to intense rainfall events. Conversely, the western region demonstrated a weaker overall relationship, with some states exhibiting stronger precipitation-pluvial claim trends during the winter season.
Discussion
This study presents a novel approach to distinguishing and quantifying the impacts of pluvial floods across the contiguous United States by leveraging publicly available NFIP claims data in conjunction with USGS streamflow records. Our analysis reveals almost 90% of the examined non-SFHA claims were induced by pluvial floods (i.e., when streamflow in the watershed containing claim locations did not exceed its 100-year return period magnitude). This finding is notably higher than previous estimates that reported 60% of non-tropical cyclone claims and 74% of tropical cyclone claims as being attributed to pluvial floods based on the cause of loss indicator (neighborhood surveying and publicly available information are examples of how the cause of loss can be determined)10. However, this previous study also noted that pluvial claims occur more frequently outside SFHAs, and pluvial flood risk is often not considered in SFHA delineation10, lending credence to our higher estimate, given our exclusive focus on non-SFHA claims. This discrepancy underscores the potential limitations of relying solely on the cause of loss indicator and highlights the value of the novel methodology developed in this study to provide a more comprehensive assessment of pluvial flood impacts.
The analysis of the data reveals the identification of distinct regional patterns in pluvial flood damages across the contiguous United States. The five southern states near or bordering the Gulf of Mexico (Oklahoma, Texas, Arkansas, Louisiana, and Mississippi) exhibited the highest median pluvial flood damage percentages, while the western region generally experienced lower damages.
We conjecture that such regional disparities are driven by the sensitivity of pluvial claims to precipitation amounts. Our findings reveal a stronger positive relationship between precipitation amounts and the number of pluvial claims per state population in the eastern region compared to the western region. This discrepancy suggests that, for a given precipitation event, the eastern United States experiences a higher density of pluvial flood claims, potentially indicating a greater concentration of people living in or having insurance coverage in areas at risk of pluvial floods, or infrastructure that is less equipped to handle such events. Higher land-surface wetness conditions in these states preceding precipitation events can be another compounding factor. Conversely, drier conditions in western states might also influence these regional differences, though this has not been explored.
As precipitation patterns continue to shift due to climate change, and with significant portions of the United States projected to experience increased flood damages18, understanding the relationship between precipitation and pluvial flood impacts becomes increasingly crucial. Our study’s identification of regional variations in this relationship provides valuable insights for insurance companies, regional planners, and individuals involved in assessing and mitigating pluvial flood risk. Areas with a stronger association between precipitation and pluvial floods may require more robust drainage infrastructure and targeted preparedness measures to mitigate the impacts of intense rainfall events. Conversely, regions with a weaker overall relationship may benefit from enhanced risk communication efforts and tailored management approaches that account for seasonal variations in precipitation patterns.
A notable finding of this study is the concerning trend of stagnant or declining flood insurance uptake for properties outside SFHAs, despite the prevalence and impacts of pluvial floods demonstrated by our claims analysis. Most states exhibited a significant decrease in active non-SFHA policies from 2010 to 2021. This trend may be partially attributed to the lack of pluvial flood considerations in current Flood Insurance Rate Maps (FIRMs), which could provide property owners with a false sense of security regarding their flood risk. Moreover, changes to FIRMs change the number of properties mapped inside and outside the SFHA. The trends in flood insurance uptake we assessed may be influenced by the magnitude of these mapped changes, which is an area of further research to be explored. Furthermore, flood insurance purchased through private insurers, data on which were not available for this study, may impact the trends in NFIP policies purchased40.
Additionally, our analysis revealed that the majority of states see a short-term response in non-SFHA policies within six months of pluvial claims occurring in the state. While policyholders do seem to react to pluvial events with temporary surges in non-SFHA policy purchases, these temporary interests in flood insurance do not last as can be seen with Fig. 3a. This aligns with previous research indicating that flood insurance take-up tends to increase immediately after a flood event but subsequently returns to baseline levels41,42. The persistent underrepresentation of pluvial flood risk and the lack of adequate risk communication strategies contribute to the low adoption of flood insurance for properties outside SFHAs. Additionally, when compound events occur, driven by multiple types of flooding, focus may often be taken away from the impacts of pluvial floods, whose genesis mechanisms and spatial locations are still to be fully understood. Our findings underscore the need for novel and targeted approaches to raise awareness among property owners about the potential risks they face from pluvial floods, bridging the existing insurance coverage gaps.
This study contributes to the growing body of work that has revealed remarkably low flood insurance policy coverage for non-SFHAs, where this coverage is actually decreasing in many states. Two of the primary reasons for the lack of policy growth is that flood risk information outside the SFHA is limited, and the purchase of flood insurance is not mandated. It is evident that the NFIP has grappled with low participation rates for properties located outside the SFHA, despite the reality that many of these areas face considerable flood risk31,32,33. Clearly, it is impractical to compel property owners to purchase flood insurance in the absence of legal requirements or useful information about flood risk that warrants their attention. In this context, we discuss factors influencing the voluntary purchase of flood insurance by homeowners, including (1) active and continuing outreach and education about flood risk and flood insurance; and (2) sufficient disposable income among property owners to afford flood coverage.
Firstly, our findings highlight the importance of sustained risk communication and outreach efforts by local communities. By leveraging channels such as community meetings or engagement with real estate and insurance agents, communities can raise awareness about flood risk probabilities, the benefits of insurance, and the availability of relatively affordable Preferred Risk Policies. However, the effectiveness of such campaigns is contingent on dedicated staffing and funding resources. Moreover, risk communication resonates better when delivered by trusted local voices rather than state or federal authorities43. Finally, affordability remains a significant barrier, with lower-income households often unable to bear the costs of flood insurance premiums, even for discounted policies44. As risk-based pricing reforms are implemented, financial assistance programs may be crucial to ensuring equitable access to flood insurance, thereby enhancing overall community resilience.
While our study offers valuable insights, it is essential to acknowledge the limitations and assumptions inherent in our methodology. Our assumption that non-SFHA claims from watersheds without 100-year or greater events were caused by pluvial floods may have led to some misclassifications. For example, the used discharge records may be non-representative of what happened if claim locations were sufficiently far from the gauge location. We also used daily average discharge records to determine dates of 100-yr+ flood events, but instantaneous discharge records would be more accurate because instantaneous flows often exceed daily averages. Additionally, our inability to distinguish whether non-SFHA claims resulting from 100-yr+ events were caused by pluvial floods can potentially underestimate extreme pluvial events. Furthermore, significant differences in insurance coverage and flood exposure exist between properties zoned inside the SFHA and those zoned outside the SFHA; therefore, the behavior of pluvial flood impacts studied here may not translate to areas inside the SFHA. We also assumed each flood claim’s flood zone designation is appropriate, but outdated and inaccurate FIRMs could have led to some properties being zoned incorrectly. The 100-year flood zones in these FIRMs could also be inaccurately small for compound flood events. Finally, we used state-averaged precipitation values, which may not accurately represent significant spatial variations in rainfall in larger states. Despite these limitations, our novel method for distinguishing pluvial flood claims provides important information for better understanding pluvial flood impacts in the United States. Moreover, as updated versions of the NFIP claims, policies, and USGS datasets become available, further analysis can be conducted to enhance our understanding of pluvial flood impacts and refine our methodological approach.
Methods
Datasets
Flood insurance data were collected from two OpenFEMA datasets: FIMA (Federal Insurance and Mitigation Administration) NFIP Redacted Claims and FIMA NFIP Redacted Policies45,46. The redacted claims dataset analyzed (retrieved 11/15/2022) contains information on 2,570,089 NFIP insurance claims. Relevant attributes for this study include policyCount, dateOfLoss, floodZone, latitude, longitude, amountPaidOnBuildingClaim, amountPaidOnContentsClaim, state, totalBuildingInsuranceCoverage, totalContentsInsuranceCoverage, and id. Claims range in date from 08/31/1970 to 04/14/2022. However, the claims dataset appears incomplete prior to 1978 and after 2021, leading us to only include claims listed from 1978–2021 in the analysis. The redacted policies dataset used (retrieved 2/14/2023) has data for 60,113,882 NFIP insurance policies. This policy dataset spans 2009–2022, with the 2009 and 2022 years seemingly incomplete. This led us to only analyze 2010–2021 for the policy data. The relevant fields analyzed from this dataset are floodZone, latitude, longitude, policyCount, policyEffectiveDate, and policyTerminationDate. Latitudes and longitudes for both the claims and policies dataset are rounded to 1 decimal place by the NFIP to preserve privacy.
The hydrologic data used were USGS station streamflow data and watershed information for the contiguous United States. 19,031 watershed boundaries were taken from the USGS NHDPlus dataset47. These watershed boundaries are delineated within 15 percent of the areas corresponding to the National Water Information System’s reported basin areas. Each watershed boundary polygon includes a USGS stream gauge identification number. Averaged daily streamflow data for all stations with watershed boundaries were retrieved from the USGS streamflow dataset48. To be consistent with the NFIP claims’ time span, USGS stations were only included if there was recorded streamflow data since 1978.
Precipitation data were taken from the North American Land Data Assimilation System project phase 2 (NLDAS-2)49,50. The NLDAS-2 dataset provided hourly total precipitation for the contiguous U.S. at a 0.125-degree spatial resolution from 1979 to 2021. We used each state’s spatial range to estimate the hourly precipitation for each state and then averaged these hourly values to calculate the daily mean total precipitation for each state.
Log-Pearson Type III analysis to determine 100-yr+ flow events
Using the described streamflow data, a log-Pearson Type III analysis was conducted for each USGS station to determine when and which stations experienced a 100-yr or greater flow event (referred to as “100-yr + ”)51. First, a 100-yr discharge threshold was calculated for each station with
where (log left({Q}_{100}right)) is the log of the 100-yr flow event, (overline{log (Q)}) is the average log of the annual flow peaks, (K) is the frequency factor for each station, and (sigma) is the standard deviation of the log of the annual flow peaks52,53. Frequency factors were taken from Table 7.7 of Haan54 for the 100-yr recurrence interval and the skewness of the log of each station’s annual flow peaks, rounded to a single decimal place. Years without a positive annual maximum flow were removed from the analysis, and stations that had less than 10 annual maximum flows or a skewness outside -3 and 3 were omitted55. From this analysis, there were 9060 USGS gauges with sufficient data. The areas of these 9060 gauges ranges from 0.2 km2 to 1.1 × 10⁶ km2 with a median area of 445.0 km2. After running these gauges through the described log-Pearson Type III analysis, we found 1798 gauges experienced at least one 100-yr+ event since 1978 for a total of 5848 100-yr+ recorded events since 1978 across the contiguous U.S. This large number of 100-yr+ flow events is due to some gauges having consecutive days of 100-yr+ flows as well as many gauges experiencing the same 100-yr+ event due to their proximity to each other. In other words, the 5848 100-yr+ events we have determined are not 5848 unique events, but rather the total number of times the analyzed gauges reported a 100-yr+ event.
Estimating claims and policies subject to pluvial floods
Once we determined when 100-yr+ events occurred and for which gauges, we used the NFIP claims dataset to estimate which claims were caused by pluvial floods. We first took only claims with a flood zone of “X”, “B”, or “C” since these claims are zoned for outside the 100-yr flood zone, and therefore are estimated to be caused by pluvial floods for flow events less than the 100-yr flow. For example, a 50-year flow event created by a river overtopping its banks should not reach the properties zoned for outside the 100-year flood zone, meaning it is a pluvial flood damaging these properties. Of the 2,570,089 original NFIP claims, 704,131 of them were for properties outside the SFHA. These non-SFHA claims were then filtered by whether their reported latitude and longitude were inside a USGS watershed boundary with sufficient streamflow data for the earlier described log-Pearson III analysis. In order to estimate the flow conditions for the date an insurance claim was filed, there needed to be a daily discharge measurement for at least one of the gauges which a claim fell into that corresponded to the claim’s reported date of loss. After this analysis, the original 2,570,089 NFIP claims were reduced to 217,815 claims with sufficient USGS watershed and streamflow data to conduct our analysis. In other words, (1) the claim is located inside at least one USGS watershed, (2) the corresponding watershed has sufficient streamflow data to estimate the 100-yr flow threshold, and (3) the corresponding watershed has a streamflow measurement for the claim’s listed date of loss. We also removed 234 of the remaining claims with a listed state outside the contiguous U.S., which meant these claims had incorrect latitude, longitude, and/or state information. Finally, 587 claims with a date of loss listed before 1978 or after 2021 were removed due to these timeframes having incomplete data. From all this preprocessing, we end up with 216,994 claims that we used to analyze pluvial floods in the U.S.
Using the 100-yr+ events determined from the log-Pearson III analysis and this new dataset of claims with sufficient information for our analysis, we found 27,885 of these claims occurred inside a USGS gauge watershed with a 100-yr+ event on the day before, of, or after the claim’s reported date of loss, implying these 27,885 claims were due to a 100-yr+ event and cannot be assumed to be caused by a pluvial flood. This leaves 189,109 claims from 1978–2021 that we determined are due to pluvial floods. A sensitivity analysis was also conducted to quantify how perturbations to the described methodology influenced the number of claims caused by pluvial floods (see Supplementary Material).
A new dataset for NFIP policies that might incur a pluvial flood claim was also developed. For this we took the 25,808,013 NFIP policies outside SFHAs from 2010–2021 and used the location and start and end dates the policy was effective. The latitude and longitude of each policy was used to determine if the policy was within any watershed boundaries. Then for any watersheds in which a policy was located in, the year(s) the policy was effective was compared with the years of the streamflow data for these corresponding watershed(s). If a policy was in at least one watershed with streamflow data for the year(s) the policy was effective, then it was added to our dataset of NFIP policies with the potential to result in a claim that we could determine was caused by a pluvial flood. Of the original 25,808,013 non-SFHA policies in the NFIP dataset, we found 8,120,166 of these policies met the requirements described to result in a non-SFHA claim that we could perform our statistical analysis on.
Across the contiguous U.S., there were 704,131 claims listed as being outside the SFHA in the NFIP claims dataset. With the available USGS data used in this study, we were able to analyze 216,994 of these non-SFHA claims. Or in other words, we retained 30.8% of the original non-SFHA, contiguous U.S. NFIP claims in our analysis. Claim retention at the state level varied from 4.3% (Louisiana) to 99.8% (South Dakota), with a median retention of 61.1% (Supplementary Fig. 1). Our method mainly struggles to retain the claims in states bordering the coast, with the least retention occurring in Louisiana and Florida, but captures most of the claims for inland states. The inland states that contradict this are Missouri and Arkansas, which we believe is due to a lack of USGS watershed data for the Mississippi River (Supplementary Fig. 6), and Utah. Oregon, Georgia, and New Hampshire also stand out as coastal states that we are able to retain the majority of their original non SFHA claims in our analysis.
Determining damage percents from insurance claims
We characterized flood damage associated with an insurance claim as the total amount paid on the claim divided by the total amount covered by the claim. The total amount paid on the claim was calculated by adding the amountPaidOnBuildingClaim and amountPaidOnContentsClaim entries for each claim. The total amount covered by each claim was the sum of the totalBuildingInsuranceCoverage and totalContentsInsuranceCoverage fields. If a claim was missing or zero for the amount paid or covered for contents, then only the building damage was used for the claim. Likewise, only the contents damage was used for a claim if the amount paid or covered for the building was missing or zero. We only considered claims with damage percents greater than 0% and less than or equal to 100%. 168,385 of the 216,994 claims analyzed had sufficient information and a damage percent within this range for our analysis.
It should be noted that NFIP policies have a maximum coverage of $250,000 for buildings and $100,000 for contents for residential properties, and a $500,000 maximum limit for buildings and $500,000 for contents for non-residential properties41. Therefore, it is possible that some claims with damage percents of 100% actually incurred more damage than what was covered by the policy.
Mann-Kendall test for assessing significance of temporal trends
In order to statistically test if a temporal series of data is significantly increasing or decreasing, the Mann-Kendall test was used56,57,58. The Mann-Kendall test determines if there is a temporal trend in a time series and rejects the null hypothesis by taking the signs of the differences between earlier and later data and analyzing if there are consistent increases or decreases. This test is used because it is non-parametric and does not assume any distribution for the data. Additionally, missing data is allowed in this test, which is useful when assessing pluvial damage trends at the state level. For our study, all Mann-Kendall tests were two-tailed and had an alpha level of 0.05, indicating a significant increase or decrease of a time series for p-values less than 0.05.

Responses