Policy interactions make achieving carbon neutrality in China more challenging
The policy problem
As the largest CO2 emitter and the second largest economy in the world, the achievement of China’s carbon neutrality is crucial for the 1.5 °C target of the Paris Agreement. China has proposed a range of mitigation policies to meet its dual carbon targets (peaking CO2 emissions before 2030 and attaining carbon neutrality by 2060), including the deployment of non-fossil energy, the electrification of end-use sectors, the improvement of energy efficiency and market-based measures such as carbon pricing. However, the effectiveness of these policies is heavily influenced by their trade-offs and synergies. It remains unclear how these interactions will affect the overall achievement of China’s carbon neutrality. Understanding the potential impacts and mechanisms of policy interactions is critical for policymakers to formulate cost-efficient policy portfolios.
The findings
We find that interactions between mitigation policies in China would reduce the percentage of scenarios achieving carbon neutrality by 2060 by 84%, and delay the years in which these scenarios are achieved by 5–6 years. This decline is driven by how different policies influence each other’s implementation space: complementary policies expand it, while competitive policies constrain it. Among all mitigation polices, the combination of carbon pricing and renewable energy exhibits trade-off effects on both mitigation and economic outcomes. Conversely, the combination of renewable energy and the electrification of end uses demonstrates synergistic effects, benefiting both economic and mitigation impacts. These findings imply that rather than merely increasing policy intensity to achieve carbon neutrality, policymakers should prudently design mitigation portfolios to maximize synergies and minimize trade-offs. Promoting the joint implementation of renewable energy and electrification polices is an effective measure to reduce carbon emissions in China.
The study
We established a comprehensive policy portfolio area toward 2060, consisting of 1,295 scenarios based on 4 different types of aggregated mitigation strategy (carbon pricing, energy efficiency, renewable energy and electrification of end uses). Meanwhile, we developed a dynamic computable general equilibrium model of China (CEEGE model) to assess the impacts on emissions reductions, economic costs of mitigation and mitigation efficiency under different policy combinations. All scenarios were simulated and compared under two different assumptions: an actual simultaneous-implementation assumption (ASIA), in which the simulation results are obtained by implementing mitigation policies simultaneously; and an idealized simple-superposition assumption (ISSA), in which the simulation results are obtained by aggregating the results of separately implemented mitigation policies. By comparing the emissions reduction effects of all scenarios under the two assumptions, we specifically demonstrate the importance of policy interactions for achieving carbon neutrality (Fig. 1).
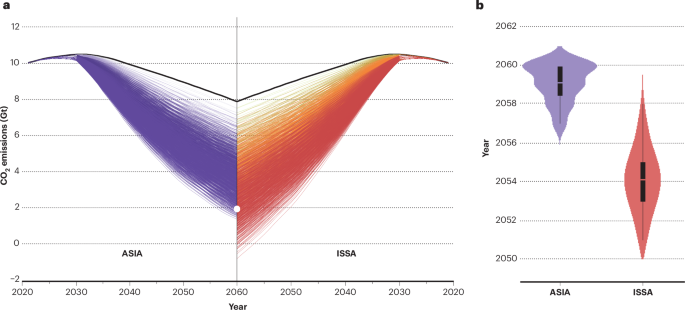
a, Policy interactions will reduce the percentage of scenarios achieving carbon neutrality from 23.5% (ISSA) to 3.7% (ASIA). The colour from light to dark reflects the increasing number of policies combined. The black line represents emissions under the baseline scenario. The white dot represents the residual CO2 emissions allowed (2 GtCO2) to achieve the carbon neutrality target considering the carbon sequestration capacity of carbon capture and storage technology and forest systems. The sample size is 1,295, including all policy scenarios. b, The average year achieving carbon neutrality will be postponed from 2054 (ISSA) to 2059 (ASIA). The width of the density map shows the frequency of the data distribution, and the box plot shows the first quartile, mean value and third quartile of all the results, and the maximum and minimum values are denoted with whiskers. The sample size is 48, including policy scenarios achieving carbon neutrality under ASIA. Figure adapted from Y. Liu et al. Nat. Clim. Change https://doi.org/10.1038/s41558-024-02237-2 (2025), Springer Nature Ltd.
Responses