Population-level gut microbiome and its associations with environmental factors and metabolic disorders in Southwest China
Introduction
Human gut microbiota is shaped by host and environmental factors1. Population-level studies on the gut microbiome have presented the factors in genetics, exposome, lifestyle, diet, diseases, and medications that correlate with the shifts in the microbiome composition and functionality2,3,4,5. The microbiota variation is affected by numerous host and environmental factors, such as geography, age, sex, and stool consistency4,6,7. Such influence of factors diversify in populations, and are essential for identification of robust disease microbiome markers, so as to contribute to translation of gut microbiome findings into potential clinical practice.
Extensive evidence from observation studies and animal experiments have revealed that the gut microbiome is closely involved in the potential pathogenesis of various common metabolic disorders, such as obesity, type 2 diabetes mellitus (T2DM), non-alcoholic fatty liver disease (NAFLD), and cardio-metabolic disease (CMD)8,9. However, the association of metabolic disorders and disease microbiome markers are affected by host and environmental factors4,9. The influence of population-specified factors that significantly affect the microbiota variations should be taken into account when verifying disease microbiome markers for diagnostic and clinical practice in new populations.
China has a huge population with various factors, such as lifestyle, diet, socioeconomic status and natural environmental conditions. Several population-level studies based on 16S ribosomal RNA (rRNA) gene sequencing have described that the Chinese gut microbiota variations are associated with study regions7 and staple food type10,11. Previous studies on gut microbiome were mainly among the population in coastal areas of China7,12, and the people living in Southwest China have distinct socioeconomic status, geography, diet, behavior, and lifestyle13, but the information in regard to gut microbiome composition and related factors in this area is still limited.
Based on a large-scale cohort in Southwestern China, the China Multi-Ethnic Cohort (CMEC)13, a microbiome project, CMEC Microbiome Project (CMP) was founded for two most populous cities in this region: Chengdu (~20 million) and Chongqing (~30 million). We enrolled participants from the general population of these two cities and collected blood and stool samples. We conducted microbiome analysis using metagenome sequencing of stool samples and explored the composition and function of the gut microbiome. We collected comprehensive host and environmental factors to evaluate their impact on microbiota variation. We described microbial taxa and functional pathways in association with metabolic diseases. Such information is expected to help with potential clinical translational research regarding gut microbiome for metabolic diseases.
Results
Overview of cohort and study participants
The CMEC is a community population-based prospective observational study launched in 2017 and aimed to understand non-communicable diseases (NCDs) prevalence, risk factors and associated conditions in Southwest China13. A total of 99,556 participants aged 30–79 years from five provinces of Southwest China provided detailed and comprehensive information on demographics, socioeconomics, lifestyles, health-related histories, medical examinations, and clinical laboratory tests13.
To characterize the composition and function of gut microbiota and identify its links with metabolic diseases, the CMP was established in 2020 and recruited participants from the first follow-up stage of the cohort between July and December. More than 1600 Han participants from the cities of Chengdu and Chongqing donated stool, oral, and blood samples after extensive questionnaire investigations, medical examinations, and clinical laboratory tests. Finally, paired-end metagenomic shotgun sequencing (MGS) was performed on stool samples from 921 participants without antibiotics used in the previous month before fecal donation (aged 31–81 years, 50.05% male, 55.8% from Chengdu; Fig. 1a and Supplementary Table 1). In total, we obtained 293 intrinsic and exogenous factors covering 32 self-reported diseases, 24 anthropometric parameters, 34 health conditions, 9 demographics data, 39 lifestyles, 59 blood and uric measurements, and 97 diet factors from participants and an average of 11.05 ± 1.07 Gb of microbiota data from stool samples (Fig. 1a and Supplementary Table 2A, B).
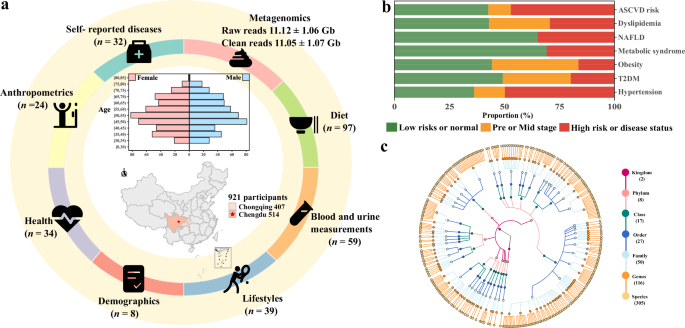
a The CMP assessed 316 exogenous and host intrinsic factors in 921 participants, including 32 self-reported diseases, 24 anthropometric parameters, 34 health factors, 8 demographics, 39 lifestyles, 59 blood and uric measurements, and 97 diet factors. The data were collected through questionnaires or clinical measurements. b The distribution of metabolic disorders in the population. c The taxonomic tree of 305 species (including 304 bacteria and 1 eukaryote) with a prevalence ≥5%. Each colored circle represents a taxonomic entity, and different colors indicate different taxonomy levels. From the inner to outer circles, the taxonomic levels range from kingdoms to species.
Seven metabolic disorders were integrated from self-reported questionnaires, anthropometric, and clinical laboratory tests, including hypertension, T2DM, obesity, metabolic syndrome (Mets), NAFLD, dyslipidemia, and 10-year arteriosclerotic cardiovascular disease (ASCVD) risk (Supplementary Table 2C). Metabolic disorders exhibited varied structure of proportions among the participants (Fig. 1b). Within the participants, the most common metabolic disorder was hypertension (14.0 and 49.8% for stages 1 and 2, respectively), followed by 10-year ASCVD risk, consisting of 47% high-risk and 10.2% moderate risk; and relatively rare diseases included T2DM (19.9%) and obesity (16.4%) (Supplementary Table 2D). Correlation between disorders was low except for multi-indicator diseases, such as the associations between 10-year ASCVD risk and stage 2 hypertension (Spearman r = 0.53, P value <2.2e-16), T2DM (Spearman r = 0.50, P value <2.2e-16) (Supplementary Table 2E).
Overview of gut microbiome composition and function in Southwest China
Microbiome sequence reads were processed by MetaPhlAn3 and HUMAnN 3 to characterize the composition and function of the microbiome. A total of 1571 taxa (3 kingdoms, 15 phyla, 30 classes, 54 orders, 113 families, 305 genera, and 1051 species), 10,091 Kyoto Encyclopedia of Genes and Genomes (KEGG) Orthologies (KOs), 633 MetaCyc pathways, and 1627 carbohydrate-active enzymes (CAZymes) were identified (Supplementary Fig. 1 and Supplementary Table 3A–D). Additionally, we identified a total of 2,831 antibiotic resistance genes (ARGs) across different databases: 627 in the CARD database, 677 in the NCBI database, 634 in the ResFinder database, 547 in the ARG-ANNOT database, and 346 in the MEGARes database (Supplementary Table 3E).
We applied species accumulation models to study the accumulation of microbial features when the number of samples increases and estimated that ~62% of samples were able to characterize at least 90% of microbial features (Supplementary Fig. 2). The rarefaction and extrapolation sampling curve predicted the total number of species in the participants under triple the current sample size to be 1280 (standard error = 57) with 363 genera (standard error = 26.8), 652 pathways (standard error = 15.6), and 10,489 KOs (standard error = 84) (Supplementary Fig. 3). Indicating that increased sample size to triple will allow for an additional excavation of at least 20% species.
Overall, we identified 525 taxa (2 kingdoms, 8 phyla, 17 classes, 27 orders, 50 families, 116 genera, and 305 species) and 430 pathways with a prevalence of ≥5% (Fig. 1c). Gut microbiota composition was highly variable across the population and with structural differences between the results of cohorts from different countries or territories3,4,7,10. In our research, Firmicutes dominated the taxonomic composition with an average relative abundance of 42.29% (range: 0.48–97.46%), followed by Bacteroidetes (range: 0.00–94.60%), Proteobacteria (range: 0.00–99.32%), Actinobacteria (range: 0.00–92.69%), and Verrucomicrobia (range: 0.00–24.58%) (Fig. 2a and Supplementary Table 3A). The interindividual microbial functional profile was relatively stable. The pathways of amino acid biosynthesis had the highest relative abundance at 18.57% in the MetaCyc pathways (range: 12.86–29.37%), followed by nucleoside and nucleotide biosynthesis pathways (range: 7.73–22.98%), cofactor, carrier, and vitamin biosynthesis (range: 8.00–17.80%), cell structure biosynthesis pathways (range: 3.44–12.34%), and fatty acid and lipid biosynthesis pathways (range: 2.63–15.15%) (Fig. 2b and Supplementary Table 3B).
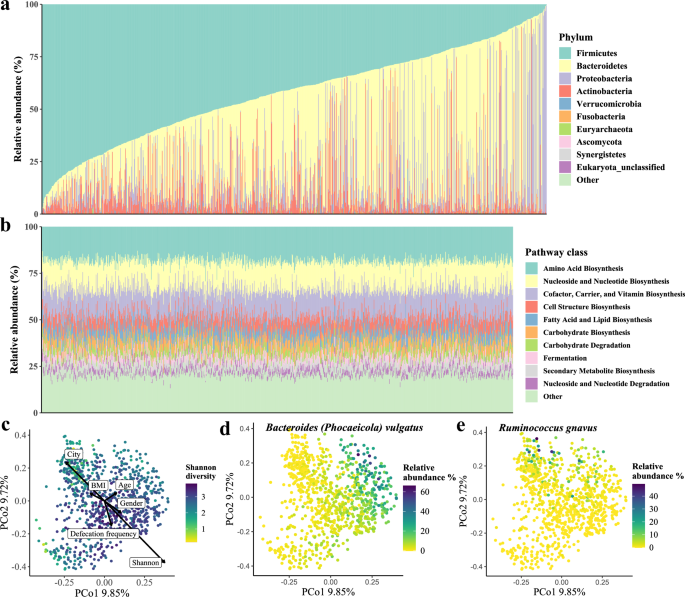
a Phylum-level composition of all samples in the population, sorted by the abundance of phylum Firmicutes. Each vertical line indicates one sample. b Relative abundances of the top 10 MetaCyc pathways of all samples. Each vertical line indicates one sample. c Principal coordinate analysis (PCoA) of all samples using species-level Bray-Curtis dissimilarity, colored by the value of the Shannon index. The basic characteristics and Shannon diversity index were fitted onto PCoA ordinations by the envfit function in R. The length of the arrow indicates the strength of the correlation between variables and the vector projections in the ordination plot and arrows point to the direction in which variables change most rapidly. d Bacteroides vulgatus (synonym Phocaeicola vulgatus) showed the strongest Spearman correlation with the first principal coordinate. e Ruminococcus gnavus showed the strongest Spearman correlation with the second principal coordinate.
Diversity and enterotypes of the gut microbiome in Southwest China
Similar to results reported previously, the distribution of diversity showed high inter-variability within the population, and Shannon’s diversity index showed the strongest correlation with Bray-Curtis distances (envfit analysis r2 = 0.23, FDR = 0.002; Fig. 2c)5,14. The principal coordinates analysis (PCoA) of microbiome data at the species level revealed that the first principal coordinate was driven by Bacteroides vulgatus (Spearman r = 0.77, P value <2.2e-16; Fig. 2d and Supplementary Table 4A), and the second principal coordinate was driven by Faecalibacterium prausnitzii (Spearman r = −0.63, P value <2.2e-16; Fig. 2e and Supplementary Table 4A). The PCoA of functional potential identified that the first principal coordinate was highly correlated with the pathways of UDP-N-acetylmuramoyl-pentapeptide biosynthesis (PWY-6386 and PWY-6387; Spearman r = −0.93, P value ≈ 0.0), chorismate biosynthesis (PWY-6163; Spearman r = −0.93, P value ≈ 0.0), and peptidoglycan biosynthesis (PEPTIDOGLYCANSYN-PWY; Spearman r = −0.93, P value ≈ 0.0); the second principal coordinate was highly correlated with pathway of cis-vaccenate biosynthesis (PWY-5973; Spearman r = −0.84, P value <2.2e-16; Supplementary Table 4A).
We further stratified individuals into two distinct clusters (enterotypes) using the multidimensional cluster analysis and identified driving microbes using principal component analysis (PCA) of genus-level community composition (Fig. 3a, b and Supplementary Table 4B). Each of these two enterotypes can be identified by the variation in one of two genera: Bacteroides (cluster 1) and Prevotella (cluster 2). We further repeated enterotype analysis under different sample sizes to evaluate the changes in the number of enterotypes, and the enterotype clustering results remained unchanged (Supplementary Fig. 4 and Supplementary Table 4C). B. vulgatus (mean abundance: 7.10%, range: 0.00–65.84%) and Prevotella copri (mean abundance: 5.68%, range: 0.00–91.70%) were the richest and highly variable species in our population. B. vulgatus was the most abundant species in cluster 1 and P. copri was the second abundant species in cluster 2 (Supplementary Fig. 5). We then examined the Spearman correlation between enterotypes and population phenotypes, and no significant correlations (FDR <0.05) were observed (Supplementary Table 4D). We performed a logistic regression model to explore potential associations between metabolic disorders and enterotypes, and no significant associations were identified. (Fig. 3c and Supplementary Table 4E, F).
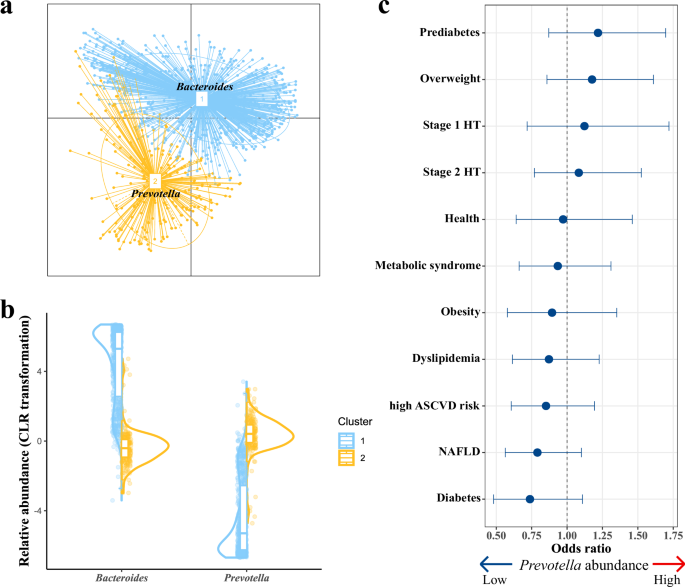
a Enterotypes at the genus level. Labeled with the main contributors of each enterotype. b The CLR-transformed relative abundances of the main contributors in each enterotype (cluster 1, blue; cluster 2, yellow). c Association of enterotypes with metabolic disorders (dot, mean; lines, 95% confidence intervals).
The core and keystone microbial species differ in large cohort studies
To characterize the shared microbial features among participants in our study, we defined microbial taxa with ≥90% prevalence as the core microbes (Supplementary Fig. 6). In total, we identified nine genera and nine species were core microbes in our population, counting for mean relative abundance of 52.35 and 23.73%, respectively (Supplementary Fig. 7 and Supplementary Table 3A). The defined core microbes were partially shared with several large European population cohorts reported previously3,4,5,15,16. Under a unified definition, in nine identified core genera in our study, seven were shared with the Finnish FINRISK, six were shared with the Estonian Microbiome Project (EstMB), five were shared with the Dutch Microbiome Project (DMP), and seven were shared with the Belgian Flemish Gut Flora Project (FGFP) (Supplementary Table 5A). Four genera (Bacteroides, Faecalibacterium, Parabacteroides, and Roseburia) were highly consistent in all studies, suggesting a central role in the organization and maintenance of the gut microbiome ecosystem in humans. In the identified nine core species, three overlapped (Bacteroides uniformis, B. vulgatus, and F. prausnitzii) with the DMP cohort and four overlapped (B.uniformis, Streptococcus salivarius, Anaerostipes hadrus, and F. prausnitzii) with the LifeLines-DEEP (LLDeep) cohort4,5.
We identified 22,792 species co-abundances and 79,297 pathway co-abundances with an FDR cut-off of 0.05. We also defined central nodes ranked in the top 10% in the number of node degrees as keystone species or pathways, resulting in 31 keystone species (Fig. 4 and Supplementary Table 5B) and 45 keystone pathways (Supplementary Fig. 8 and Supplementary Table 5C). The two identified keystone species (F. prausnitzii and B. uniformis) are also core species (Fig. 4). Six identified keystone species (Alistipes shahii, Alistipes putredinis, Ruminococcus gnavus, Barnesiella intestinihominis, F. prausnitzii, and Parabacteroides merdae) and five keystone pathways (PANTO-PWY, PWY-5667, PWY0-1319, PWY-3001, and VALSYN-PWY) were overlapped with the DMP cohort4 (Supplementary Table 5B, C). As the only shared core and keystone species in multiple human studies, our study emphasized the cornerstone role of F. prausnitzii between gut microorganisms interactions to affect the community-level structure and related functions.
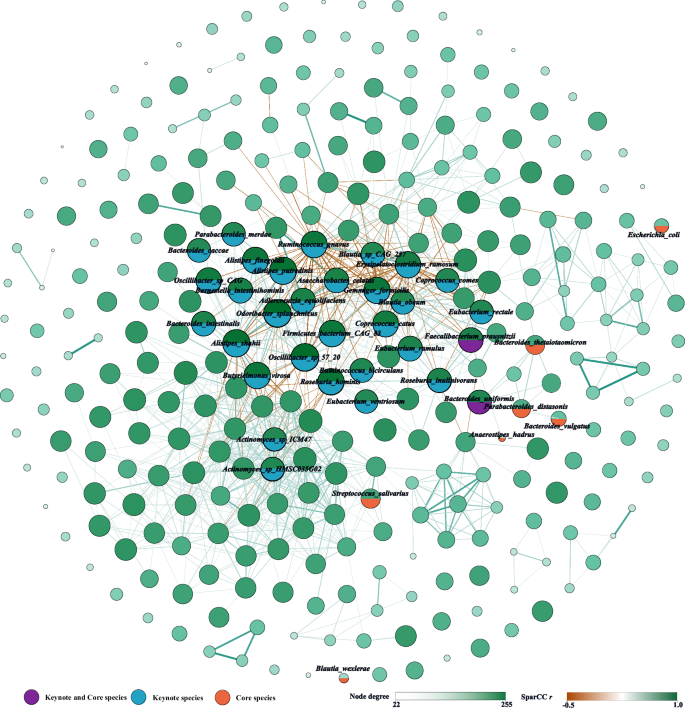
In total, 22,792 significant (FDR <0.05) co-abundance relationships were identified between 305 species. Only showed the edges with |r | > 0.30 to simplify the figure. The size of the nodes represents the level of degrees, and the thickness of the edges represents the absolute value of Pearson r. Created by Gephi.
Phenotypes associated with interindividual variation of gut microbiome
To access comprehensive associations between the fecal microbiome and phenotypes, 273 factors (7 metabolic disorders, 24 anthropometric parameters, 34 health factors, 9 demographics, 39 lifestyles, 59 blood and uric measurements, and 97 diet factors) were correlated to the microbial composition, diversity, and the unique functional KOs richness (Supplementary Table 6A–E). We observed 108 significant associations (FDR <0.05) between phenotypes and the microbiome taxonomic composition and 34 significant associations between phenotypes and the alpha diversity index (Shannon diversity index and observed species; univariate PERMANOVA; Supplementary Table 6B, C). The sequencing batch explained the largest proportion of beta-diversity (R2 = 4.54%, FDR = 6.5 × 10⁻⁴), followed by geographic location (city) (R2 = 1.81%, FDR = 6.5 × 10⁻⁴) and sampling month (R2 = 1.10%, FDR = 6.5 × 10⁻⁴) (Fig. 5a and Supplementary Table 6B). Defecation frequency also explained a significant proportion of variance (R2 = 0.79%, FDR = 6.5 × 10⁻⁴). Age, sex, and BMI explained 0.28, 0.49, and 0.28% of individual variation, respectively. The metabolic disorder describing the most variation in the microbiome composition was dyslipidemia (R2 = 0.59%), followed by NAFLD (R2 = 0.57), 10-year ASCVD risk (R2 = 0.46%), T2DM (R2 = 0.42%), and metabolic syndrome (R2 = 0.28%) (Fig. 5a and Supplementary Table 6B).
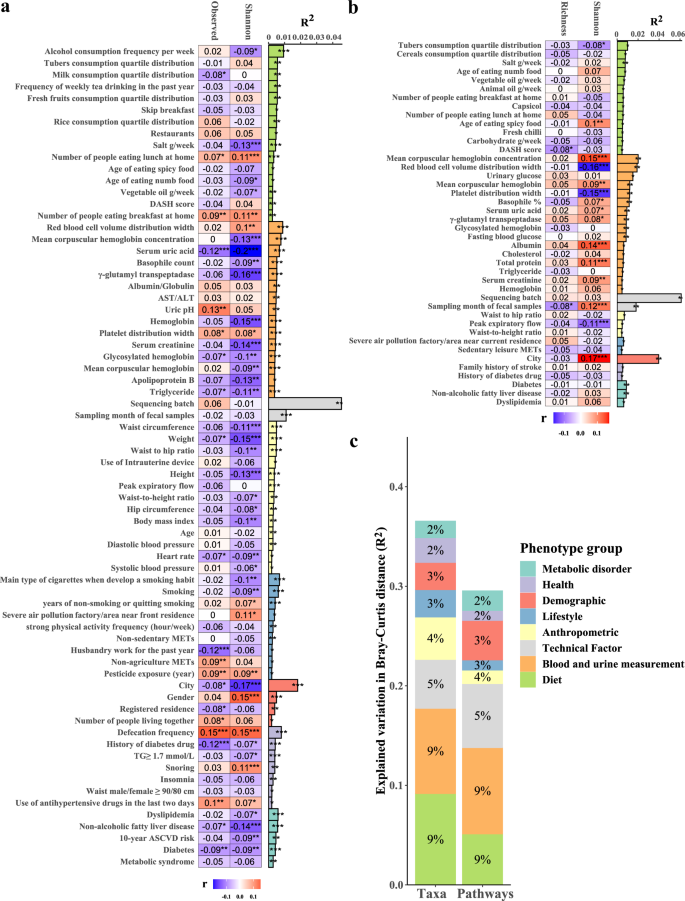
a Phenotypes associated with the species-level microbiome taxonomic composition. b Phenotypes associated with the microbiome function composition. c Variance in microbiome composition and function explained by phenotype groups in multivariate PERMANOVA analysis. The bar plot indicates the explained variance in the interindividual variation of the microbial composition obtained by the permutational analysis of variance (based on the Bray-Curtis distance). The heatmap shows the Spearman correlation coefficients of each phenotype with the Shannon diversity index and the observed species richness. The group of blood measurement and diet only showed the top 15 factors in the graphs. Blue indicates a negative correlation, and red indicates a positive correlation. *FDR <0.05, **FDR <0.01, ***FDR <0.001.
For microbiome function compositions, we observed 44 significant associations between phenotypes and the microbiome function composition and 9 significant associations between phenotypes and the diversity of functional KOs (Shannon diversity index and the richness of unique KOs; univariate PERMANOVA; Supplementary Table 6D, E). Similarly, the sequencing batch dominated the variation of gut microbiota function profiles (R2 = 6.11%, FDR = 0.0025), followed by geographic location (city) (R2 = 3.96%, FDR = 0.0025) and sampling month (R2 = 1.81%, FDR = 0.0025) (Fig. 5b and Supplementary Table 6D). The results suggested that geography also exerts a strong effect on human gut microbiota composition and function.
After excluding highly collinear (Spearman |r | > 0.8) phenotypes, 87 phenotypes were significantly associated (FDR <0.05) with microbiome taxonomic composition, including 2 technical factors, 5 metabolic disorders, 13 anthropometric parameters, 7 health factors, 4 demographics, 9 lifestyles, 29 blood and uric measurements, and 18 dietary factors (Supplementary Table 6F); 42 phenotypes were significantly associated with microbiome function composition, including 2 technical factors, 3 metabolic disorders, 3 anthropometric parameters, 2 health factor, 1 demographic, 2 lifestyles, 16 blood and uric measurements, and 13 dietary factors (Supplementary Table 6G). These phenotypes explained 36.54% of microbiome taxonomic composition and 29.54% of microbiome function composition, with the largest contribution coming from dietary factors and blood and uric measurements (multivariate PERMANOVA; Fig. 5c and Supplementary Table 6H).
Microbiome-phenotype associations for demographic, lifestyle, diet, health, and blood measurements
To deeper understanding of internal and external characteristics that affect microbiome composition and function, we performed multivariable linear regression association analyses between each phenotype (factor) and microbiome features with ≥ 5% prevalence (including 305 species, 430 MetaCyc pathways, 896 CAZymes, 143 CARD ARGs, 147 MEGARes ARGs, and 104 Resfinder ARGs). When corrected for sequencing batch, sampling month, city, and defecation frequency, we found 857 significant associations (FDR <0.05) between 154 factors and 203 species (Fig. 6 and Supplementary Table 7A), 156 significant associations between 41 factors and 99 pathways (Supplementary Table 7B), 1305 significant associations between 185 factors and 596 CAZymes (Supplementary Table 7C), and 694 significant associations between 116 factors and 288 ARGs (Supplementary Table 7D).
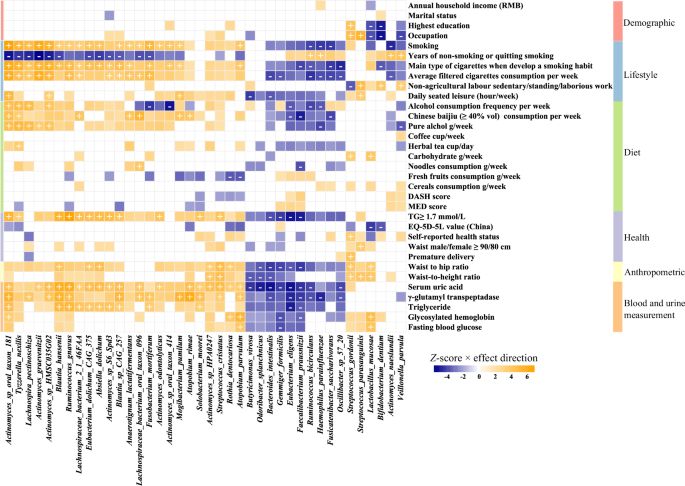
Top 40 species with the highest number of significant associations are clustered by association Z-score using hierarchical clustering and colored by direction of effect (blue, negative; orange, positive), with associations significant at study-wide FDR <0.05 marked with plus and minus for positive and negative correlations, respectively. Colored associations without a mark indicate nominally significant associations (P < 0.05).
The largest number of phenotype-taxa associations occurred on Actinomyces sp. oral taxon 181 (Supplementary Table 7E). The core and keystone species showed 157 associations with phenotypes, and five species as F. prausnitzii, Gemmiger formicilis, R. gnavus, Bacteroides intestinalis, and Actinomyces sp. HMSC035G02, which were also listed in the top ten species, were observed to have a higher number of significant associations (Fig. 7). We also found HISDEG-PWY (L-histidine degradation I) and PWY-5130 (2-oxobutanoate degradation I) pathways had the largest number of phenotype-pathway associations (Supplementary Table 7F). Several α-amylase enzymes from the glycoside hydrolase (GH) family with starch-binding domain (SBD) had the largest number of phenotype-CZAyme associations (Supplementary Table 7G). The tetracycline resistance gene tet (M) had the largest number of phenotype-ARGs associations (Supplementary Table 7H–J).
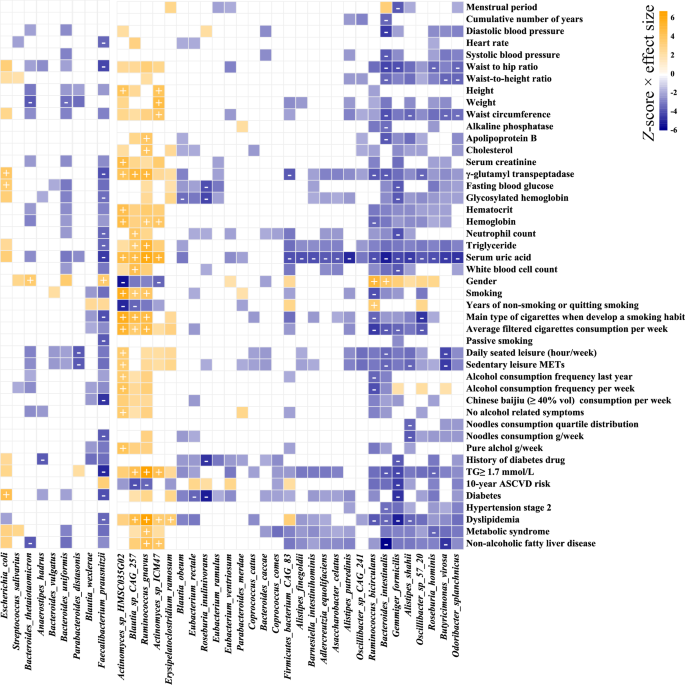
Core and keystone species are clustered by association Z-score (multivariate linear regression of CLR-transformed relative abundance of taxa, correcting for city, defecation frequency, sequencing batch, and sampling month) using hierarchical clustering. Associations are colored by direction of effect (blue, negative; orange, positive), with associations significant at study-wide FDR <0.05 marked with plus and minus for positive and negative correlations, respectively. Colored associations without a label indicate nominally significant associations (P < 0.05).
Blood and urine measurements showed the highest number of associations with microbiome features (235, 36, 315, and 293 associations with taxa, pathways, CAZymes, and ARGs at FDR <0.05, respectively) (Supplementary Fig. 9 and Supplementary Table 7K). Blood measurements showed consistent association patterns with urine measurements (Fig. 6). We found that serum uric acid (SUA) was widely associated with microbiome taxa and function, such as associations with decreased abundance in A. putredinis (R2 = 0.026), Eubacterium eligens (R2 = 0.028), and F. prausnitzii (R2 = 0.022), and increased abundance in R. gnavus (R2 = 0.038), Blautia hansenii (R2 = 0.037), and Streptococcus cristatus (R2 = 0.024) (Supplementary Table 7A, L).
We identified 592 associations between dietary factors and microbiome features (113, 24, 464, and 195 significant associations with taxa, pathways, CAZymes, and ARGs, respectively) (Supplementary Table 7K). The diet phenotypes such as alcohol consumption (including alcohol consumption frequency, ≥40% vol Chinese baijiu consumption, and weekly intake of pure alcohol) exhibited the largest associations with microbiome features (Supplementary Table 7L). Tea consumption (including herbal tea, dark tea, green tea, and the grammage of weekly tea consumption) was also found to be associated with certain numbers of the gut microbiome features (9, 1, 44, and 5 associations with taxa, pathways, CAZymes, and ARGs, respectively). We found a higher DASH (Dietary Approaches to Stop Hypertension) score was associated with a decreased abundance in Methanobrevibacter smithii.
Further, We investigated the influence of socioeconomic status on diet pattern association (Supplementary Fig. 10). In the associations between diet factors and taxa, we provided the results of multivariable linear regression models that additionally included adjustment for annual household income (Supplementary Table 7M). We observed 2233 nominally statistically significant (P < 0.05) associations and 101 study-wide significant (FDR <0.05) associations. Phenotypes of alcohol consumption and tea consumption were found to be stably correlated with microbiome features.
The microbiome associated with metabolic disorders and health status
In total, we identified 155 significant associations between metabolic disorders and microbiome features (78 with taxa, 45 with pathways, 17 with CAZymes, and 15 with ARGs, FDR <0.05; Supplementary Table 7K). T2DM showed the highest number of associations (16 associations with taxa, 37 with pathways, 5 with CAZymes, and 12 with ARGs), followed by NAFLD (20 associations with taxa, 7 with pathways, 3 with CAZymes, and 1 with ARGs), and dyslipidemia (21 associations with taxa) (Supplementary Table 7L). Similar to previous research results, consistent microbiome–disease association patterns were across the majority of metabolic disorders4 (Supplementary Fig. 11).
We further included corrections for age, sex, and BMI into our association models based on the corrections for sequencing batch, sampling month, city and defecation frequency (Supplementary Table 8A–E). The total number of significant associations was reduced to 114 associations with species, 29 associations with pathways, 1104 with CAZymes, and 569 with ARGs (Supplementary Table 8F). We identified 48 associations between metabolic disorders and microbiome features (25 with taxa, 9 with pathways, and 14 with CAZymes, FDR <0.05; Supplementary Table 8G). We observed 8, 8, 6, and 2 associations between NAFLD, dyslipidemia, T2DM, and MetS with species, respectively (Fig. 8a).
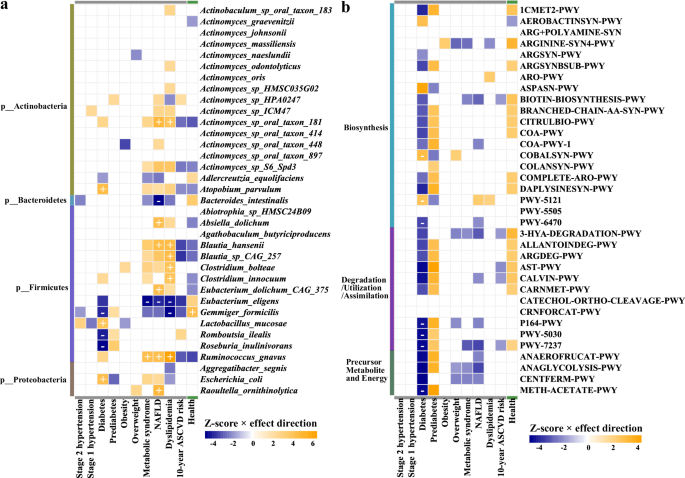
Top 35 microbial species with the highest number of associations are clustered by association Z-score (multivariate linear regression of CLR-transformed relative abundance of taxa, correcting for sex, age, BMI, city, defecation frequency, sequencing batch, and sampling month) using hierarchical clustering. Associations are colored by direction of effect (blue, negative; orange, positive), with associations significant at study-wide FDR <0.05 marked with plus and minus for positive and negative correlations, respectively. Colored associations without a label indicate nominally significant associations (P < 0.05).
We found that T2DM had strong correlations with an increased abundance of Absiella dolichum, Lactobacillus mucosae, and Escherichia coli, as well as a decreased abundance of G. formicilis, Romboutsia ilealis, and Roseburia inulinivorans. NAFLD, dyslipidemia, and MetS were consistently associated with higher levels of R. gnavus and lower levels of E. eligens. Furthermore, nine significant associations between T2DM and microbial pathways were identified (Fig. 8b). Microbial functions involved in biosynthesis (COBALSYN-PWY, PWY-5121, PWY-5505, and PWY-6470), degradation-utilization-assimilation (P164-PWY, PWY-5030, and PWY-7237), and generation of precursor metabolite and energy (METH-ACETATE-PWY) showed robustly associations with T2DM (Fig. 8b).
Discussion
We have conducted a gut microbiome study on 921 CMP participants in Southwest China, who represent the Han population residing in a landlocked low-altitude basin with distinctive geographical environments and climates. Our cohort with rich dietary, lifestyle, and clinical information provides a unique opportunity to characterize the gut microbiome features related to common metabolic disorders. We utilized shotgun metagenomic sequencing to examine and identify significant microbial associations with exogenous and intrinsic host factors, including anthropometric parameters, health, diet, demographics, lifestyle, blood, and uric measurements. We have validated that the host region exerted the strongest effect affecting interindividual distance of microbial composition, far exceeding the effects of other host phenotypes. Finally, our results support previous studies that a common signal for gut dysbiosis can be observed in multiple diseases3,4.
Although huge variations existed in the interindividual microbial composition, the microbiota community can be categorized into several enterotypes driven by the main contribution genera15,17. Enterotypes represented optimized states of gut symbiont compositions and were independent of host age, sex, and geography17. In our study, we observed two enterotypes driven by Bacteroides and Prevotella, commonly found in studies worldwide that report enterotypes18. Prevotella and Bacteroides are large, species-rich monophyletic taxa with antagonistic niches and interactions. Prevotella has been reported to be positively associated with vegetarian, vegan, and Mediterranean diets19, while the abundance of Bacteroides is usually associated with high-fat and protein-rich diets20. As the most abundant species in the Prevotella enterotype, the role of Prevotella copri in human health or disease status is still in debate and controversial21,22,23,24.
However, we could not replicate any statistically significant between metabolic disease risks and P. copri abundance in prior reports after correcting for sequencing technology and geographical factors. Different roles of P. copri in health and disease states were possibly due to subspecies diversity caused by high levels of genomic and functional diversity25. Genetic and population structure analysis showed that P. copri complex composed of four distinct clades (>10% inter-clade genetic divergence) is globally distributed and shaped by multi-generational dietary modifications26. Associations between health conditions and P. copri may exist, but possibly only at the subspecies or sub-clade level. Large-scale metagenomic assembly and strict quality control are required in the future to unravel whether P. copri is considered either a positive or a negative influence on health in the context of geography, diet, lifestyle, and host genetic factors.
Overall, we measured 273 different factors from seven categories that explained 36.54% of microbiome species-level composition and 29.54% of microbiome function composition. This explained proportion of microbial composition variation is far above the LifeLines-DEEP cohort (18.7), EstMB cohort (10.14%), and DMP cohort (12.9%)3,4,5. One possible explanation is that we have correlated metadata variables of unique dietary preferences in Southwest China (such as Chinese baijiu and tea), providing more insight into how diet shapes intestinal microbial composition. Moreover, we provided a series of factors belonging to blood and urine measurements that also explained a substantial proportion of the gut microbiota variation. Nevertheless, additional contributions from unknown factors, stochastic effects, and/or biotic interactions greatly restrict our interpretation of interindividual variation in microbiome composition and function15. Similar to the results of previous studies, lower biodiversity was associated with a lower defecation frequency, smoking, weekly drinking, and a higher waist-to-hip ratio3. We also provide new significant associations, such as triglyceride, SUA, γ-glutamyl transpeptidase (GGT), and hemoglobin.
After linking with phenotypes, we found gut microbiome is wildly associated with individual physical and mental health, diet, lifestyle, and biochemistry measurements with a consistent pattern of association. For instance, the association pattern between the gut microbiome and SUA is opposite to that of low-purine foods and healthy diet models, but consistent with unhealthy lifestyle habits, such as smoking and drinking. The gut microbiome plays an indispensable role in UA metabolism, and its extrarenal excretion function can degrade one-third of exogenous and endogenous UA generated daily27. The common genera in the human intestine, such as Lactobacillus and Pseudomonas, have the ability to synthesize UA-metabolizing enzymes catalyzing the degradation of UA to ammonia28,29. Previous research has proven that dietary habits (such as purine-rich diets), excessive alcohol consumption, and obesity were associated with a high SUA level30,31. The association direction between interrelated phenotypes may influence their association pattern with the gut microbiome. This means the gut microbiome is highly individualized and micro-coevolved with host genetics and environmental factors.
In our study, extensive associations between Actinomyces species and phenotypes were found. Actinomyces species were regarded as members of the healthy core microbiome, particularly in the oral cavity, and might be relatively frequent commensal inhabitants on the gut, skin, and mucosae of urogenital sites32. Individuals who exhibited both immunocompetent and immunocompromised, suffered from invasive surgical procedures and trauma, or undergone a mixed infection were more prone to cases of actinomycosis32. Previously a majority of studies demonstrated an increased abundance of Actinomyces and Actinomyces species in saliva or buccal mucosa samples of cigarette smokers32,33,34,35. In our study, significant associations between smoking and heavy consumption of alcohol and increased abundance of Actinomyces species (such as Actinomyces sp. oral taxon 181, Actinomyces graevenitzii, and Actinomyces sp. oral taxon 414) in the gut microbiome. It suggested that the effects of unhealthy behaviors of the host may have a similar effect on shaping the gut microbiome and oral microbiota.
Association analysis showed that NAFLD, dyslipidemia, and MetS were associated with an increased abundance of Ruminococcus gnavus. R. gnavus (also known as Mediterraneibacter gnavus) is a prevalent human gut symbiont and part of the infant and adult gut microbiota36. Recent studies considered R. gnavus a potential “pro-inflammatory species” as it was associated with animal-product-rich diets and inversely associated with the healthy eating index (HEI)37,38. Among previous studies, R. gnavus has been associated with an increasing number of intestinal and extraintestinal diseases, such as inflammatory bowel diseases (IBD), irritable bowel syndrome (IBS), obesity, and T2DM39. In a cohort study, the presence of R. gnavus was robustly associated with several features of MetS, such as an increase in fat mass, waist circumference, serum triglycerides, C-reactive protein, and HbA1c, as well as a decrease in HDL40. Our study found that R. gnavus was positively associated with alcohol consumption and inversely associated with fresh fruit consumption and Mediterranean diet score. Further studies are warranted to establish whether R. gnavus has a mediation effect on metabolic disorders in response to lifestyle and diet.
After controlling the factors that greatest impact microbial composition and recognized confounders, we observed the strongest microbial signal for T2DM based on stable associations. Our findings support previous research that the gut microbiome of T2DM patients was characterized by a decrease in the abundance of some universal butyrate-producing bacteria and an increase in various opportunistic pathogens41. For instance, we observed T2DM negatively correlated with butyrate-producing bacteria F. prausnitzii. As a potential intestinal health indicator for intestinal disease42,43, the beneficial effects of F. prausnitzii in T2DM were studied and verified in human epidemiological research and animal experiments44,45,46. Additionally, we provided some new associations between intestinal species and T2DM. We found that T2DM was strongly associated with the decreased abundance of butyrate-producing bacteria Roseburia spp. (Romboutsia ilealis and Roseburia inulinivorans)47 and carbohydrate-metabolism and anti-inflammatory bacteria E. eligens48. Given the findings from our human cohort study, potential beneficial gut microbiota on T2DM could be further investigated in the future.
The present study also contains several limitations. Our cohort is volunteer-based to a certain extent, so the composition of common metabolic disorders among DMP participants cannot truly reflect the epidemic situation of diseases in Southwest China. The cross-sectional and lacking medication use history of this study inherently limits our ability to delineate the observed associations between disease treatments and gut microbiome. We included some self-reported variables, such as lifestyle factors, which may incur recall bias. Finally, the data obtained from sequencing is often voluminous, fragmented, noisy, and overlapping. Our understanding of gut microbiota largely relies on the integrity and accuracy of reference databases when using metagenomic tools for gene identification and annotation. The reference databases are populated with genes/proteins from well-studied species, while the gut microbiome contains many novel and poorly characterized isolates, there will be many false negatives in the study.
Human health both affects and is affected by gut microbiome composition, the level of richness and diversity of the microbiome, the influence of dysbiosis, and even the existence and abundance of specific microbes. Although recent large-scale studies have been uncovering numerous underlying impacts of host heritability and exposures, the human gut microbiome is still under-explored and microbiome-targeted therapy is still at a juvenile stage both in its basic and translational dimensions. In the future, we will conduct follow-up via linkage with established electronic disease registries to obtain more reliable diagnoses of diseases and detailed information on the history of medication usage. Study designs with large sample sizes, rich phenotypes, long-term follow-up, sequential longitudinal stool sample collection, integration of genome-wide association study, and deeper metagenomic sequencing will enable more mechanistic hypotheses of human metabolism and gut microbiome to be generated in the future.
Methods
CMEC and metadata collection
The CMEC was launched in 2017 to investigate the prevalence, risk factors, and associated conditions of NCDs across various ethnicities in Southwest China13. The baseline recruitment was completed in September 2019, and a total of 99,556 participants were enrolled including 55,443 Han and 44,113 other ethnic people from nine cities. More than 80% of Han people were from Chengdu and Chongqing cities13. The information from participants was collected, including sociodemographics, diet, lifestyle habits, and health-related history via an electronic questionnaire with face-to-face interviews, medical examinations, and clinical laboratory tests on blood samples13.
The first follow-up stage of the cohort was started in July 2020 for ~10% of baseline participants, providing consistent information with baseline recruitment. In total, 1603 Han volunteers from Chengdu and Chongqing cities were recruited to establish the CMEC Microbiome Project, participants were collected with stool samples from July to December 2020. The participants who used antibiotics within one month before collecting stool samples were excluded from this study. At last, 921 participants were included for further study.
Assessment of dietary variables
The quantitative FFQ was used to assess the intake of the main food groups, which covered the most commonly consumed food groups in Southwest China. We collected information on the quantity (average grams per time) and frequency (times per day, week, month, or year) of each food group over the last year. Moreover, information on the frequency, quantity, and consumption types was recorded for the alcohol, tea, and beverages at the individual level and for cooking oil and salt at the family level. Total energy intake was calculated according to the China food exchange lists and the 2018 China food composition tables49. Based on food frequency information, each participant’s dietary approaches to prevention and treatment of hypertension were calculated to Stop Hypertension (DASH) score and Mediterranean diet score (MED) score50,51.
Assessment of physical activity (PA) and sedentary behavior
The questions on PA and sedentary behavior were adapted from validated questionnaires used in the China Kadoorie Biobank (CKB)52,53. Participants were investigated about their usual type and duration of activities related to work, commuting, household chores, sedentary and leisure time, and exercise during the past year. Activity types were classified as follows: heavy manual work, manual work, standing work, sedentary work, manual work in the farming season, semi-mechanized work in the farming season, fully mechanized work in the farming season, commuting mode (walking, bicycle, motorbike, private or public transportation [e.g., bus, car, underground, ferry]), household activity, tai chi/qigong/leisure walking, jogging/aerobics, swimming, ball games (e.g., basketball, badminton, table tennis), exercise with fitness equipment, and other exercises (e.g., mountain walking, home exercise, jump rope).
PA was calculated by multiplying the metabolic equivalent (MET) value for a particular type of PA by hours spent on that activity per day and summing the MET-hours for all activities. METs were based on the 2011 Compendium of Physical Activities54. PA (MET h/day) included physical activity related to jobs, transportation, leisure time, and housework. Leisure sedentary time (ST) activities were recorded, such as playing on a mobile phone or tablet, watching television, reading, playing cards or mahjong, and using a computer outside of work (quantified as hours/day). Total ST included leisure ST and work ST. Participants were asked to report 1 (regular) commuting mode in the past year, and response options included the following: walking or bicycle, motorbike or private car or bus, working at home or nearby, housework, or disabled to work.
Assessment of metabolic disorders
Stage 1 hypertension was diagnosed as the systolic blood pressure (SBP) 130–139 mmHg, and/or diastolic blood pressure (DBP) 80–89 mmHg on two or more separate examinations. Stage 2 hypertension was diagnosed as self-reported hypertension, the SBP ≥140 mmHg, and/or DBP ≥90 mmHg on two or more separate examinations55.
Diabetes mellitus (DM) was diagnosed as self-reported diabetes, the fasting blood glucose (FBG) level ≥7.0 mmol/L (126 mg/dL), or HbA1c ≥6.5% (48 mmol/mol)56. The impaired fasting glucose (IFG) was defined as FBG 5.6–6.9 mmol/L or HbAlc 5.7–6.4%.
Overweight was defined as a BMI of 24.0–27.9 kg/m2, and obesity was diagnosed as a BMI ≥28.0 kg/m2 (Chinese criteria)57.
According to the Guidelines of the Prevention and Treatment of Dyslipidemia in Adults (Chinese criteria)58, the normal blood lipid was defined as TC <5.2 mmol/L, LDL-CH <3.4 mmol/L, and TG <1.7 mmol/L; the edge elevation of blood lipid was defined as TC 5.2–6.2 mmol/L, LDL-C 3.4–4.1 mmol/L, or TG 1.7–2.3 mmol/L; and the elevation of blood lipid was defined as TC ≥6.2 mmol/L, LDL-C ≥4.1 mmol/L, or TG ≥2.3 mmol/L.
Metabolic syndrome (Mets) was defined as having three or more of the following five criteria formulated by the National Cholesterol Education Program’s Adult Treatment Panel III (NCEP: ATP III)59: (1) Center obesity: A waist circumference >102 cm for men and >88 cm for women. (2) Hypertriglyceridaemia: triglycerides ≥1.70 mmol/L. (3) Low HDL cholesterol: <1.03 mmol/L for men and <1.29 mmol/L for women. (4) Hypertension: blood pressure ≥135/85 mmHg or related drug treatment. (5) Fasting plasma glucose ≥6.1 mmol/L or related drug treatment.
The positive diagnosis of non-alcoholic fatty liver disease (NAFLD) was based on radiological imaging-confirmed evidence of fat accumulation in the liver (hepatic steatosis) with one of the following three criteria60: (1) Overweight/obesity: defined as BMI ≥23 kg/m2 (Asians standard). (2) T2DM: as previously described. (3) Metabolic dysregulation: defined as the presence of at least two metabolic risk abnormalities: (i) A waist circumference ≥90/80 cm in men/women (Asians standard).(ii) Blood pressure ≥130/85 mmHg or related drug treatment. (iii) Plasma triglycerides ≥1.70 mmol/L or related drug treatment. (iv) Plasma HDL cholesterol <1.0 mmol/L for men and <1.3 mmol/L for women or related drug treatment. (v) Prediabetes (i.e., fasting glucose levels from 5.6 to 6.9 mmol/L or HbA1c from 5.7 to 6.4%).
According to the Guidelines of the Prevention and Treatment of Dyslipidemia in Adults (Chinese standards)58, participants with one of the following conditions are directly classified as high-risk: (1) LDL-C ≥4.9 mmol/L; (2) TG ≥7.2 mmol/L; (3) diabetes patients over 40 years old with LDL-C 1.8–4.9 mmol/L or with TC 3.1–7.2 mmol/L. Based on LDL-C or TC levels, the presence or absence of hypertension, and the number of other ASCVD risk factors, the risk stratification is divided into 21 combinations for individuals without the above conditions (Supplementary Table 9). The 10-year average risk of ASCVD in different combinations is defined as low-, medium-, and high-risk, which represented <5%, 5–9%, and ≥10% risks of developing ASCVD in the next 10 years, respectively.
Measurement of mental health conditions
Anxious symptoms were measured with the 7-item self-reported General Anxiety Disorder-7 (GAD-7) scale61. Each item of the GAD-7 is scored from 0 (not at all) to 3 (nearly all day), yielding a total score ranging from 0 to 21. According to the established thresholds, the severity of anxiety symptoms derived from this score is defined as mild (5–9), moderate (10–14), or severe (≥15).
Depressive symptoms were assessed with the 9-item self-reported Patient Health Questionnaire (PHQ-9)61. Each item of the PHQ-9 is scored from 0 (not at all) to 3 (nearly all day), yielding a total score ranging from 0 to 27. The severity of depressive symptoms is classified as mild (5–9), moderate (10–14), moderately severe (15–19), or severe (≥20).
EQ-5D-5L life quality
A Chinese quantified EuroQol five-dimensional questionnaire (EQ-5D-5L) scale was used to measure the quality of life62. The descriptive system of the EQ-5D comprises five dimensions: mobility (MO), self-care (SC), usual activities (UA), pain/discomfort (PD), and anxiety/depression (AD); each dimension is described at five levels (no, little, moderate, severe, and extreme problems). The measurement results are transformed into the final quality of life through the utility value integration system.
Medical physical examination
We conducted medical physical examinations mainly using the resources and personnel at local clinical centers. We implemented standardized training for the doctors and nurses before the investigation. The height, weight, waist circumference, hip circumference, fasting blood pressure (the average of three measurements), and fasting heart rate (the average of three measurements) of the participants were measured on-site. The bone mineral density and peak expiratory flow of the participants were measured by using unified devices of the bone mineral density densitometers (OSTEOKJ3000) and peak expiratory flowmeters (KOKA PEF-3). The cardiac electrical activity was recorded by a 12-lead electrocardiogram. Abdominal ultrasound was used to examine the size, shape, location, and corresponding lesions of abdominal organs. Calculation of related indicators: Body mass index (BMI) = weight (kg)/height (m)2; Waist-to-hip ratio (WHR) = Waist (cm)/hip (cm); Waist-to-height ratio (WHtR) = Waist (cm)/height (cm).
Clinical laboratory tests
All participants provided blood and urine samples on-site at the time of the baseline and the follow-up survey. Venous blood samples, collected after overnight fasting (at least 8 h), were used for clinical laboratory testing, including routine blood tests, blood glucose levels, lipid levels, hepatic function, and renal function. Mid-stream urine was collected for routine urine testing.
Stool sample collection and DNA extraction
The stool samples were collected at the site on the examination day from September to December 2020. The participants were asked to collect fresh stool into a sterile polypropylene specimen cup. The samples were transported at 4 °C and stored at −80 °C until the DNA extraction. Hexadecyl trimethyl ammonium Bromide (CTAB) was used to isolate the microbial DNA, and polyacrylamide gel electrophoresis (PAGE) at a concentration of 1% was used to qualify DNA purity and integrity. The Qubit® 2.0 Fluorometer (Life Technologies, CA, USA) with a Qubit® dsDNA Assay Kit was used to quantify DNA. Library preparation for all samples was performed using NEBNext® UltraTM DNA Library Prep Kit for Illumina® (NEB, USA), and the DNA was randomly fragmented by Covaris M220 Ultrasonicator (Covaris, USA) to an average size of 350 bp. The fragments were amplificated and purified by the polymerase chain reaction (PCR) after end repair, A-tailing, and Illumina adapters ligation. The Agilent 2100 Bioanalyzer was used to detect the insert size distribution, and Qubit and real-time PCR (qPCR) were used to accurately quantify the effective concentration of libraries.
Metagenomic sequencing and data analyses
The shotgun metagenomic sequencing was performed by Novogene Bioinformatics Technology, China, using the Illumina NovaSeq6000 platform with a 150 bp paired-end protocol, finally generating 11.12 ± 1.06 Gb of raw reads and 11.05 ± 1.07 Gb of clean reads per sample. KneadData pipeline (https://github.com/biobakery/kneaddata) was used to prune the raw reads by removing the adapters and low-quality reads through Trimmomatic (v.0.39)63 and reads aligned to the human genome (GRCh38/hg38) through Bowtie 2 (v.2.4.5)64. We obtained 10.27 Gb pair-end reads per sample after moving human DNA reads. To determine the taxonomic composition of each sample, microbiome sequence reads were mapped to ~1.1 million unique clade-specific marker genes using the MetaPhlAn3 tool (v.3.0.14)65 and quantified at each level (kingdom, phylum, class, order, family, genus, and species). A separate de novo assembly of metagenomes from the quality-filtered reads into larger genomic fragments (contigs) for each sample was performed by MEGAHIT (v.1.2.9)66. The assembled metagenomic contigs were performed metagenome binning using MetaBAT (v.2.12.1)67. HUMAnN 3 (v.3.0.1)65 was used to identify the functional orthologs based on the Kyoto Encyclopedia of Genes and Genomes (KEGG) Orthology (KO) database and annotate microbial pathways based on the MetaCyc metabolic pathway database. The HMMER (v.3.3.2) in dbCAN was used for automated CAZyme signature domain-based annotation. The ABRicate (v.1.0.1)68 was used to predict antibiotic resistance gene (ARG) families based on the Comprehensive Antibiotic Resistance Database (CARD)69, the National Center for Biotechnology Information (NCBI) antimicrobial resistance reference gene database70, the Resfinder database71, the Antibiotic Resistance Gene-ANNOTation (ARG-ANNOT) database72, and the MEGARes database73.
Species accumulation curves were performed to estimate the adequacy of our sample size using the function specaccum in R package vegan (v.2.6.4). Sample size-based Rarefaction and extrapolation (R/E) sampling curves were constructed to estimate the total richness of species, genera, metabolic pathways, and KOs using the R package iNEXT (v.3.0.0)74. To limit the number of tests of univariate association analysis and reduce the sparsity of our data, we kept 525 taxa (2 kingdoms, 8 phyla, 17 classes, 27 orders, 50 families, 116 genera, and 305 species) and 430 pathways with ≥5% prevalence. Together, these microbial features accounted for 95.27 and 98.27% of the average relative abundance of species and pathways, respectively. We did not rarefy the counts to avoid loss of data.
Microbiome diversity
Alpha diversity was evaluated by the Shannon index and the observed number of species using the function diversity in R package vegan. The total count of unique KOs was used to characterize the diversity of the functional profile. The association analysis between host phenotypes and α-diversity index was assessed by the Spearman correlation, and the P values were further adjusted for multiple testing using the Benjamini–Hochberg (BH) method. The microbiome beta-diversity (Bray-Curtis dissimilarity matrix) was calculated at the species level using the function vegdist in the package vegan. A principal coordinates analysis (PCoA) was performed based on the Bray-Curtis dissimilarity using the function cmdscale from the package stats (v.4.1.3).
An envfit analysis with 10,000 permutations was performed to fit phenotypes and α-diversity index onto PCoA ordination (calculated by the Bray-Curtis distance matrix) by the envfit function from the R package vegan. The proportion of variance of Bray-Curtis distance that can be explained by each phenotype was assessed using permutational multivariate analysis of variance (PERMANOVA) with 10,000 permutations by the function adonis in R package vegan. Phenotypes that showed significant association (FDR <0.05) with microbiome composition or function in the univariate analyses were screened to detect collinearity (Spearman |r | >0.8). Then the total proportion of variance in microbiome composition and function explained by each phenotype group was calculated by multivariate PERMANOVA analyses using the function adonis2 in R package vegan. The collinear phenotypes with the lowest contribution to microbiome community variation were excluded from the multivariate adonis analysis.
Core microbiome and keystone microbiome detection
A bootstrapping-based selection approach was used to identify the core microbiota. By subsampling the cohort with sampling ratios of 1 to 100%, the prevalences of each species at different subsampling levels were obtained. Microbial features with a prevalence ≥90% were defined as the core microbiome. A Python-based SparCC tool with 1000 bootstraps and 100 permutations was used to elucidate networks of interaction among microbial species or pathways75. Relative abundances from MetaPhlAn3 were converted to predicted read counts by multiplying the abundance percentages by the total sequenced reads of each sample and then subjected to SparCC4,76. The read counts from HUMAnN 3 were regarded as absolute abundances of genes and directly used for SparCC. The Benjamini–Hochberg procedure was used to control multiple tests. Associations with an FDR <0.05 were included in the downstream analysis. Features that ranked in the top 10% in the number of network connections (node degree) were considered keystone species or pathways.
Microbiome clusters and gut enterotypes
Samples were clustered with the partitioning around medoids (PAM) clustering algorithm based on the Jensen–Shannon divergence (JSD) distance calculated by relative abundance data at the genus level17. The Calinski–Harabasz (CH) index was used to assess the optimal number of clusters in our samples. Between-class analysis (BCA) was performed to support the clustering and identify the driven genus for the enterotype using the function dudi.pca and bca in R package ade4. A PCoA was performed to visualize enterotypes with an input of a JSD distance matrix using the function dudi.pco and s.class in the same R package. Linear regression models were performed to analyze the associations between microbiome clusters and disease phenotypes using R package lme4.
Calculation of microbial features associated with phenotypes
The microbiome data was normalized using the centered log-ratio (CLR) transformation with the geometric mean of the relative abundance of microbial features as the CLR denominator. The multivariable linear regression was used to identify the associations between microbiome features (microbial taxa, MetaCyc pathways, CAZymes, and ARGs in the CARD, MEGARes, and Resfinder database) and each phenotype. Models were adjusted for age, sex, BMI, city, defecation frequency, sequencing batch, and sampling month to correct potential confounders. Linear mixed-effects models (LMMs) were performed to analyze the associations between microbial taxa and phenotypes by the function lmer in R package lme4. Several covariates (age, sex, BMI, defecation frequency, sequencing batch, and sampling month) were included in the LMMs with “city” as a random effect. An analysis of variance (ANOVA) test was performed to compare two linear regression models to provide an overall F statistic and P value: Model0 (Microbiome features – Covariates) and Medel1 (Microbiome features – Covariates + Numerical/Categorical phenotypes). For multi-level phenotypes, dummy variables were used in regression analysis to provide effect sizes and standard errors for each level of categorical variables. All P values were corrected for the number of multiple comparisons using the BH procedure. Results were considered significant at FDR <0.05.


Responses