Potential impact of climate change on Nearctic leafhopper distribution and richness in North America
Introduction
Climate change significantly contributes to alterations in species distributions, prompting shifts in their geographic ranges1,2. Over the past six decades, crop pests and diseases have notably moved toward northern latitudes globally, progressing at ~2.7 km annually since 19603. This phenomenon is primarily attributed to global warming and trade dynamics4,5. However, the response of these organisms to the ongoing environmental changes is intricate and conditional upon various determinants, notably their geographic origins6,7,8. Tropical pest species, for instance, typically exhibit a restricted tolerance to temperature variation and tend to live close to their maximum thermal limits6,8. In contrast, temperate species contend with a broader spectrum of climate extremities, including temperature fluctuations6. As a result, projections suggest a potential reduction in the suitable habitats for tropical pest species with the anticipated progression of climate warming6,9. Conversely, a favorable trend is expected for temperate species, given their ability to adjust to more diverse climatic events4,6.
Recently, the efforts to assess the impacts of climate change on biological systems have intensified10. Species distribution modeling (SDM), also known as ecological niche modeling (ENM), has risen as a crucial tool to explore the potential effects of climate change on the geographic distribution of organisms11. However, within entomology, research efforts have predominantly centered around specific orders, such as Lepidoptera and Diptera, while comparatively less attention has been dedicated to others like Hemiptera10. This bias may stem from the notorious role Lepidoptera plays in global research and the importance of Diptera as disease vectors for vertebrates10. However, Hemiptera also includes significant plant disease vectors, causing substantial damage worldwide12. Increased research focusing on understudied insect orders is crucial for a comprehensive understanding of how climate change will affect insect distribution patterns, especially for those insects that transmit plant diseases.
Leafhoppers (Hemiptera: Cicadellidae) constitute a herbivorous group known for their varied feeding habits across vascular plants13,14. With an estimated 21,351 species described globally15, these insects exhibit a remarkable characteristic: about 90% of their genera are endemic to specific geographical regions16. The Nearctic region, spanning from Mexico to the Arctic, stands out as a leafhopper hotspot, with nearly 3000 described species showcasing a high level of endemism and diversity14,15,16,17,18,19,20. Nearctic leafhoppers are well-adapted to various climatic conditions, surviving from harsh winters to scorching summers, finely synchronizing their life cycles with these climatic patterns14,17,18,19. This adaptation suggests that environmental factors such as temperature and continental winds could primarily influence their distribution.
Increasing temperatures favor Nearctic population growth, as higher temperatures reduce the species’ life cycle duration21,22. Additionally, continental winds facilitate their dispersal into northern regions during the spring and summer23,24,25. Although the distribution of many leafhopper species is unknown or understudied in several areas of the Nearctic region, it could be plausible to anticipate that ongoing global warming and other climatic changes may offer Nearctic leafhoppers opportunities to expand their potential geographical range.
While leafhopper herbivory can damage leaves, causing necrosis, drops, stunting, smaller seeds, and reduced photosynthesis, leading to decreased yield (e.g.26), their main recognized role is transmitting plant pathogenic viruses and bacteria12,27. Phytoplasmas, for instance, are pathogens primarily disseminated by leafhoppers12. This group of phloem-limited obligatory parasites belongs to the provisional genus ‘Candidatus Phytoplasma’ within Mollicutes class27. Over 100 leafhopper species carry phytoplasmas linked to more than 600 diseases affecting a thousand plant species worldwide12,27,28,29. Typical symptoms of phytoplasmas diseases include phyllody, virescence, stunt, witches’ broom, fruits appearing as green flowers, and small, curly, and red leaves22,30. Examples of such economically damaging diseases in commercial crops include aster yellows in canola31, bushy stunt in corn32, false blossom in berries33,34, green petal in strawberries22, and grapevine yellows (Flavescence dorée and Bois noir) in grapevines35,36.
In the Nearctic region, leafhoppers exhibit oligophagous or polyphagous feeding behaviors, demonstrating a broad consumption pattern across diverse host plants that can serve as main hosts or reservoirs of phytoplasmas14,17,19,37. In this region, 38 leafhopper species have been identified as vectors or suspected vectors of phytoplasmas affecting horticultural, fruit, and field crops33,34,38,39,40. However, recent findings by our group indicate a tripling incidence of phytoplasma diseases in the Nearctic over the past decade30. This trend suggests several potential factors: (i) advancements in molecular diagnostic methods and novel detection technologies for phytoplasmas41,42; (ii) a rise in the abundance of leafhopper vectors31; (iii) the probable existence of yet-to-be-identified highly efficient vectors22,39,43,44; and (iv) an expansion of the geographic range of leafhopper vectors23.
Nonetheless, a significant research gap still exists concerning investigating the potential impacts of climate change on the Nearctic leafhoppers. Our work addresses this gap by examining the potential impact of climate change (abiotic factors) on current and future potential environmental niche similarity and species richness of 14 Nearctic leafhopper species associated with phytoplasmas affecting crops in North America (Table 1; Fig. 1)34,38,39,40,43, employing ENM-based methods. The study is particularly urgent given the scarcity of research on the dynamics of these leafhopper species in North America and the impact of climate change in the short and long term.
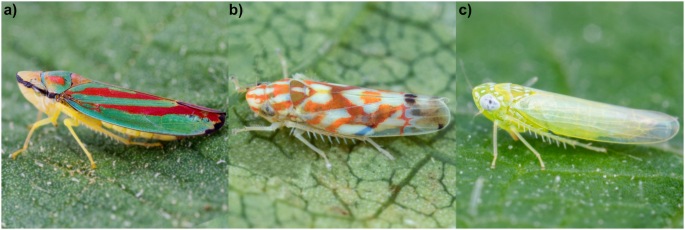
a Graphocephala spp., (b) Erythroneura spp., and (c) Empoasca fabae (Harris). Joseph Moisan-De-Serres provided pictures from the Ministry of Agriculture, Fisheries and Food – Québec (MAPAQ).
Methods
In this study, our objective was to assess environmental similarity and potential leafhopper species richness under current and future climate scenarios using ENM-based methods. The analyses were conducted using the Java version of the machine learning algorithm Maximum Entropy Modeling of Species Geographic Distributions (MaxEnt, v. 3.4.1)45, the wallace shiny app (v. 2.0.5)46, SDMtoolbox (Pro v. 0.9.1)47, ArcGIS Pro (v. 3.1.2), and R packages described further. We chose MaxEnt as our modeling algorithm due to its high statistical performance, mainly when dealing with various species occurrence records datasets11,48,49.
Species selection
We selected 14 species that are confirmed, potentially/putative, or suspected to be vectors of phytoplasmas in North America’s several groups of crops: Amplicephalus (formerly Endria) inimicus (Say), Ceratagallia (formerly Aceratagallia) humilis (Oman), Colladonus geminatus (Van Duzee), Edwardsiana rosae (Linnaeus), Empoasca fabae (Harris), Erythroneura comes (Say), Erythroneura vitis (Harris), Erythroneura ziczac (Walsh), Exitianus exitiosus (Uhler), Graphocephala fennahi (Young), Jikradia olitoria (Say), Macrosteles quadrilineatus (formerly fascifrons) (Forbes), Paraphlepsius irroratus (Say), and Scaphoideus titanus (Ball) (Table 1)12,22,33,34,39,40,43. Twelve out of 14 are exclusively present in the Nearctic region. Meanwhile, Empoasca fabae extends its occurrence to the Neotropics50, while Scaphoideus titanus, introduced to Europe in 195851, subsequently spread in this continent due to human trade activities52.
Occurrence records
We obtained species occurrence records (latitude, longitude) for North America from openly available online repositories, including the Global Biodiversity Information Facility (GBIF, accessed on 9 June 2023; https://doi.org/10.15468/dl.h3x8mf), which also includes records from INaturalist platform. We also included recent literature on leafhoppers’ field surveys22,31,43,44,53. These records were collected after 1970 to ensure relevance to the environmental variables used in our models (1970–2000) while avoiding historical records that may not accurately reflect current species occurrence sites54,55. We removed duplicate records within the same pixel (i.e., the same grid cell, ~5 km2) to enhance data quality and eliminate those with incomplete information. We also applied spatial thinning to reduce spatial bias, retaining one record for each 5 km², corresponding to the spatial resolution used in our models. The final number of occurrence records for each species were 300 for Amplicephalus inimicus, 33 for Ceratagallia humilis, 33 for Colladonus geminatus, 66 for Edwardsiana rosae, 852 for Empoasca fabae, 71 for Erythroneura comes, 189 for Erythroneura vitis, 110 for Erythroneura ziczac, 578 for Exitianus exitiosus, 912 for Graphocephala fennahi, 2376 for Jikradia olitoria, 277 for Macrosteles quadrilineatus, 280 for Paraphlepsius irroratus, and 94 for Scaphoideus titanus (Fig. 2).
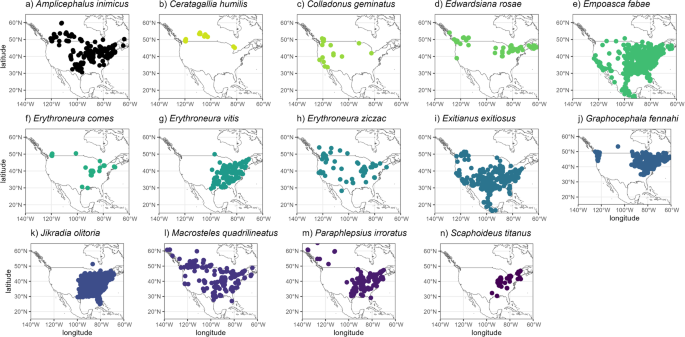
These records (a–n) were obtained after removing those with uncertainties and spatial thin (5 km).
Current environmental variables and climate change scenarios
For our current distribution model, we downloaded 19 world bioclimatic variables (v. 2.1) covering the period of 1970–2000 at a spatial resolution of approximately 5 km² 56. These variables are derived from monthly temperature and precipitation data, providing insights into annual trends, seasonality, and extreme environmental conditions. Given that these variables can be highly correlated, potentially affecting model performance due to multicollinearity57, we conducted a Pearson pair-wise correlation analysis54. This analysis allowed us to identify and subsequently remove variables with correlations exceeding a threshold of r ≥ |0.7|, as values beyond this threshold can distort model estimation (Supplementary Table S1)57. Thus, five bioclimatic variables were selected: annual mean temperature (bio_1), mean temperature diurnal range (bio_2), temperature annual range (bio_7), annual precipitation (bio_12), and precipitation seasonality (bio_15).
For the climate change scenarios, we used the global circulation model GISS-E2-1-G58 under the four shared socioeconomic pathway scenarios, SSP1-2.6, SSP2-4.5, SSP3-7.0, and SSP5-8.5 for the period 2041–2060 at a spatial resolution of 5 km2 (available at https://www.worldclim.org/data/cmip6/cmip6_clim2.5m.html).
The GISS-E2-1-G model represents an updated version of the GISS-E2 developed by the National Aeronautics and Space Administration (NASA) Goddard Institute for Space Studies (GISS). This updated model incorporates significant improvements in the representation of climate variability58. One notable improvement is the model’s ability to depict the temperature response to increased carbon dioxide. In this iteration, the response is marginally more significant than in previous versions, indicating a more accurate and realistic representation of climate dynamics58.
The SSPs, as featured in the Intergovernmental Panel on Climate Change sixth assessment report, offer global narratives that consider responses to climate change. They are associated with various challenges for mitigation and adaptation, ranging from 1 to 5, where 1 represents low, 2 medium, 3 high, 4 low for mitigation and high for adaptation, and 5 high for mitigation and low for adaptation59. These SSPs are coupled with global circulation models (GCM) scenarios (previously known as Representative Concentration Pathways – RCP). In our study, we adopted four GCM scenarios: 2.6 (low), 4.5 (intermediate), 7.0 (high), and 8.5 (very high). The SSP1-2.6 scenario limits global warming by 2100 to 2 °C, while the SSP2-4.5, SSP3-7.0, and SSP5-8.5 scenarios project values of 3 °C, 4 °C, and over 4 °C, respectively59.
In North America, predictive models indicate significant shifts in the annual mean temperature, demonstrating an increase in maximum values from 28.6 °C (SSP1-2.6) to 31 °C (SSP5-8.5), mainly in the southern areas (Supplementary Fig. S1). Moreover, the annual precipitation patterns suggest a uniform decrease in the west compared to the east across all scenarios. In contrast, precipitation seasonality is predicted to show the opposite trend (Supplementary Fig. S1).
We used the raster package in R60 to extract bioclimatic variables for each SSP. Subsequently, we created a North American shapefile, and all layers were cropped to align with this shapefile. This cropping procedure was conducted using ArcGIS.
Model development, selection, and evaluation
MaxEnt is a correlative maximum entropy-based algorithm that estimates species probability of presence or habitat suitability, ranging from 0 (unsuitable) to 1 (highly suitable), using species occurrence records and background data associated with the environmental variables used in the modeling49. We used the MaxEnt java (version 3.4.1) and the ENMeval package61. We randomly selected 10,000 background points to represent environmental conditions across North America for model calibration. We utilized Maxent’s’ clamping’ function to prevent model extrapolations beyond the environmental range. We configured two main sets for model performance and transferability testing: feature class (FC) and regularization multiplier (RM). FC involves mathematical transformations of the environmental variables into predictors: linear (L), quadratic (Q), product (P), and hinge (H), as well as their combinations. RM penalizes model complexity and reduces the number of parameters62. In our approach, we tested five FC combinations (L, LQ, H, LQH, LQHP) and RM values ranging from 0 to 5 with a step of 0.5.
We employed two occurrence partition methods, spatial partition block, and random k-fold, to perform cross-validation during model training and testing. The spatial partition method divides localities into four groups based on latitudinal and longitudinal lines, creating spatial rectangles. The random k-fold method randomly assigns localities to one of the ‘k’ groups (k = 4). In both approaches, we conducted cross-validation by generating predictions with different training sets and evaluated model performance by projecting outcomes for the omitted sites62.
We initially ran 100 models for each species using the feature class (FC) and regularization multiplier (RM) mentioned earlier, combining partition methods and rendering 2800 models. However, we found that the random k-fold method produced better results. The spatial partition block method could not be implemented for some species due to a limited number of records46. Consequently, we retained the random k-fold method for training and testing data. We selected the best model from the Area Under the Receiver Operating Characteristic Curve (AUC) and True Skill Statistics (TSS).
The AUC is a standard metric for assessing model performance. It ranges from 0 to 1 and measures the model’s ability to rank positive records higher than negative ones across the suitability range. Values closer to 1 indicate excellent model performance. However, for presence-only models like MaxEnt, interpreting AUC has some limitations, especially when there is a lack of absence data63. Additionally, when occurrence records are fewer than 100, AUC may not accurately estimate model complexity64. We also used TSS to address these limitations.
TSS assesses model performance by considering sensitivity and specificity at a binary threshold (unsuitable/suitable). TSS values range from −1 to 1, with values closer to one indicating excellent sensitivity and specificity. High TSS (>0.5) values mean a high proportion of real presences, and current absences are correctly predicted. Conversely, values at or below zero suggest errors in predicting presence (commission) or predicting absence (omission)54,65.
Projections
We transformed asci (cloglog output) maps into raster files using ArcGIS. These maps were then classified into binary outputs, unsuitable and suitable, for each species based on the maximum test sensitivity plus specificity cloglog threshold (MaxTSS values in Table 2). Sensitivity and specificity represent the proportions of correctly predicted presences and absences, respectively. Subsequently, we overlaid the binary maps to calculate species richness under current and future scenarios. We used the ‘biodiversity measurement’ function available in SDMtoolbox. The final output is a map showing the sum of unique species per pixel, representing the total number of species in each grid cell.
Environmental similarity
We assessed environmental similarity using the final species occurrence records and the five environmental variables employed in our models under current and four future scenarios. We conducted a principal component analysis (PCA) to reduce the original environmental space’s dimensionality. Subsequently, we calculated species occurrence density along the first two components of the PCA and performed similarity tests.
In the similarity test, both species’ environments were randomly shifted within the background extent, and ‘null’ overlaps were calculated from these simulations. If the observed overlap was greater than 95% of the simulated overlaps (p < 0.05), the test indicates that the two species’ environments were more similar than expected by chance (a one-tailed test). We conducted tests by pairing two leafhopper species at each iteration until all 91 possible combinations among the 14 species were evaluated for each climate scenario. Subsequently, we created a matrix containing the similarity p values (supplementary Table S2).
The similarity p values matrix was further transformed into a binary matrix, where ‘0’ represents random, and ‘1’ indicates species with environment similarity (supplementary Table S2). Using network analysis, we identified species with higher and lower similarity. For each network scenario, we calculated the network density. Density is the proportion of observed ties or connections to a network’s maximum and possible relations. Thus, density is a ratio that can range from 0 to 1. The closer to 1 the density is, the more interconnected the network66. These analyses and tests were performed using the wallace interface to compute the tests, the packages ade467, igraph68, ecospat69, and Corel Painter (Essential 7, ON, CAD) for data illustration.
Results
Models performance and variables contribution
Our predictive models demonstrated high discriminant performance, as evidenced by AUC values ranging from 0.883 to 0.980 and TSS values spanning from 0.629 to 0.864 (Table 2). The relative contribution analysis highlighted that temperature-related variables substantially shaped the models for most of the studied species (Fig. 3). However, some exceptions were observed for Erythroneura comes, Erythroneura vitis, Graphocephala fennahi, and Jikradia olitoria, where precipitation-related variable had a more substantial influence on the models (Fig. 3). Interestingly, in the case of Ceratagallia humilis (Temperature: 51.11%; Precipitation: 48.89%) and Scaphoideus titanus (Temperature: 50.03%; Precipitation: 49.97%), both sets of variables contributed almost equally to the model (Fig. 3).
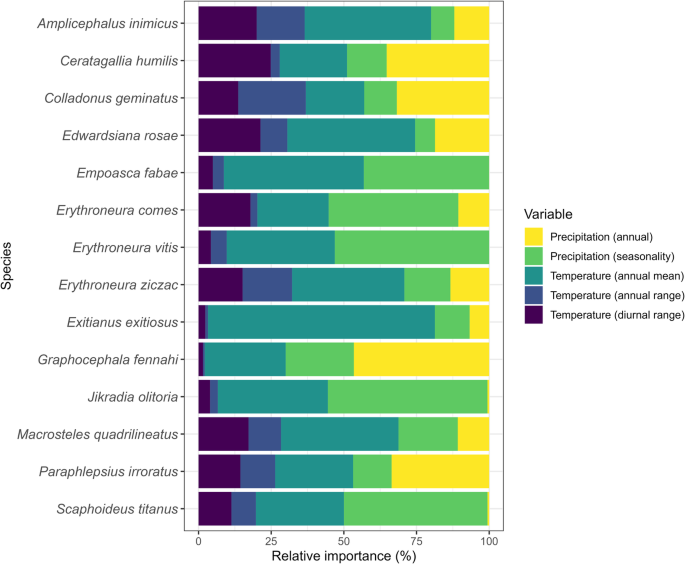
Relative importance of environmental variables for the current potential distribution models for 14 leafhopper species in North America.
Current species richness
The richness map obtained in this study reveals that the eastern part of North America, encompassing southern Ontario and Québec—identified as an anticipated high richness region for Nearctic leafhoppers13,17—exhibits the potential for the highest species richness (Fig. 4). Another high richness area was observed in the southwestern part of the United States. These regions typically feature a temperate climate with elevated humidity levels. In contrast, richness decreases in drier (e.g., the grasslands of Canada and the U.S., which include per-arid, arid, and semi-arid zones) and colder areas (e.g., Great Plains). Consequently, northern regions of Canada and the U.S. show a lower richness (Fig. 4).
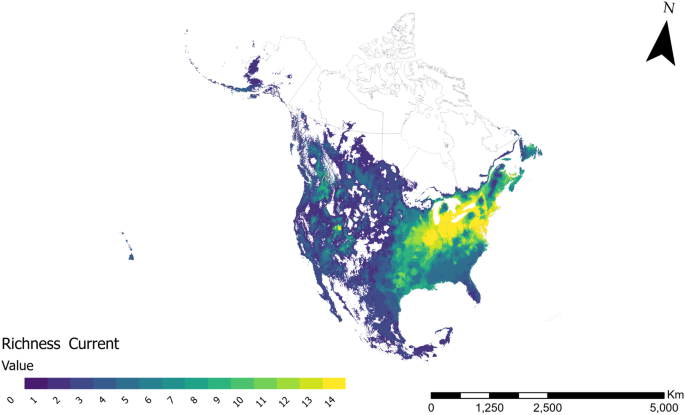
Estimated current leafhopper species richness based on 14 species potential distribution models in North America.
Future projections
To predict the impact of climate change on leafhopper richness, we assessed four future scenarios SSP1-2.6 (Fig. 5a), 2–4.5 (Fig. 5b), 3–7.0 (Fig. 5c), and 5–8.5 (Fig. 5d). Overall, suitable areas for species richness are projected to increase (Fig. 6), with some exceptions (decrease in richness of 11 and 13 under SSP1-2.6 & SSP2-4.5, and 14 under SSP3-7.0 and SSP5-8.5). The regions previously identified with the highest species richness, hosting all 14 species, are projected to retain similar patterns in all four future scenarios (Fig. 5). We observed a slight increase in this richness, gradually extending towards the east (Fig. 5). A new high richness area emerged in the southern parts of Alberta and British Columbia, Canada (Fig. 5). Additionally, an expansion in richness is evident in the southeast and northeast parts of the continent. In line with current conditions, our models predict lower species richness in arid zones compared to regions with higher humidity (Fig. 5). Overall, our results indicate that, under the four climate change scenarios investigated, northern Canada is expected to become more hospitable to a more significant number of species than under the current scenario.
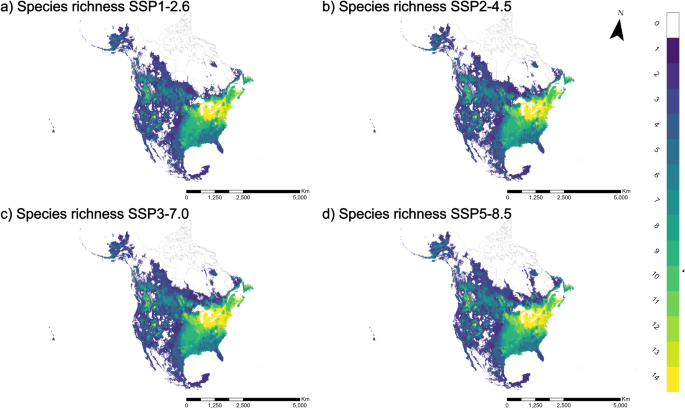
This distribution represents four shared socioeconomic pathway scenarios a SSP1-2.6, b SSP2-4.5, c SSP3-7.0, and d SSP5-8.5 for 2041–2060.
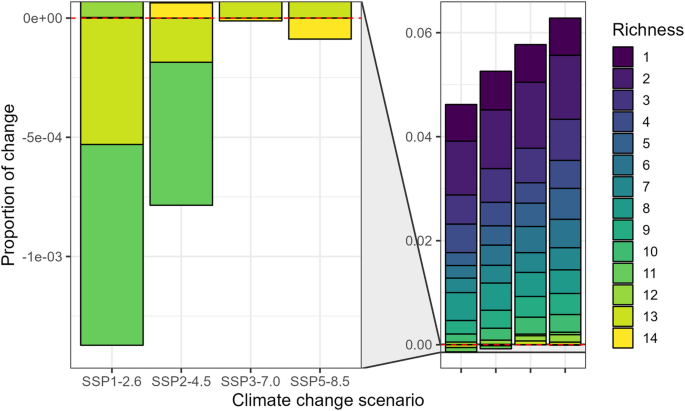
Proportional change in suitable area for 14 leafhopper species (richness 1–14) based on potential distribution models under four future scenarios compared to current conditions in North America. Suitable area for each richness level was first calculated across North America and expressed as a proportion of the total area. Positive values indicate an increase in suitable areas under a future scenario, while negative values indicate a decrease compared to the current scenario.
Environmental similarity
Our network analysis revealed that most leafhopper species present a similar environmental niche based on the five variables used in the modeling with a density value of 0.467 (Fig. 7). Notably, Colladonus geminatus, Edwardsiana rosae, and Exitianus exitiosus showed a remarkable environmental similarity with other 4 and 3 species, respectively, indicating a lesser environmental similarity. In contrast, Amplicephalus inimicus, Empoasca fabae, Erythroneura spp., Macrosteles quadrilineatus, Paraphlepsius irroratus, and Scaphoideus titanus exhibited a higher degree of environmental similarity with most of the species in our study, suggesting a higher environmental niche similarity (Fig. 7). These findings underscore the existence of a distinct environmental niche similarity between the 14 leafhopper species studied here.
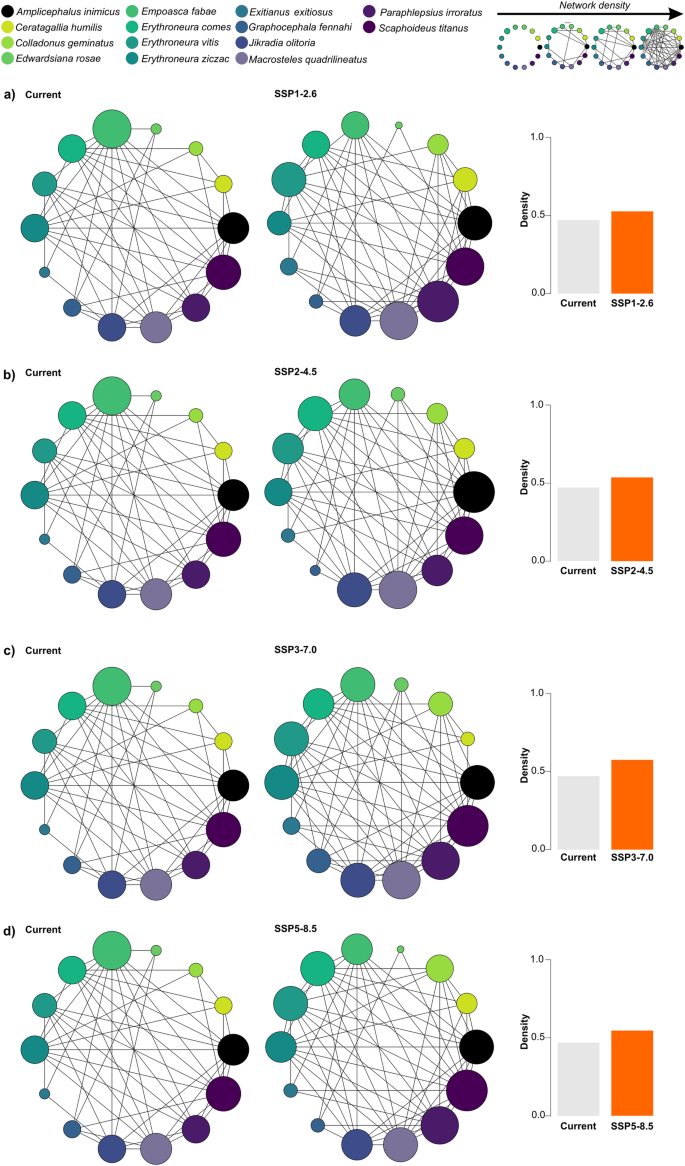
a SSP1-2.6, b SSP2-4.5, c SSP3-7.0, and (d) SSP5-8.5 for the period 2041–2060. The columns, represented in gray for the current scenario and orange for the four alternative scenarios, indicate the network density values. This metric reflects the proportion of observed connections relative to the network’s maximum potential connections. Density is a ratio that ranges from 0 to 1, with higher values indicating a more interconnected network. The size of circles within the network graph represents the number of interactions between species, meaning larger circles signify more significant similarities among species.
Under four future scenarios, the environmental similarity tended to increase between leafhopper species suggesting more interconnected networks as indicated by the increase of density values from 0.467 under the current scenario to 0.523 under SSP1-2.6 (Fig. 7a), 0.533 under SSP2-4.5 (Fig. 7b), 0.571under SSP3-7.0 (Fig. 7c), and 0.542 under SSP5-8.5 (Fig. 7d). In all scenarios, leafhopper species tended to present environmental similarity, including those with less degree of environmental niche similarity under the current scenario like Colladonus geminatus and Edwardsiana rosae. An exception was registered for Exitianus exitiosus, which only shares an environmental similarity with a maximum of three species. Overall, our results underscore the potential of leafhopper species to occupy a more similar environment niche under a warming world.
Discussion
Our study examined the environmental niche similarity and distribution of 14 Nearctic leafhopper species across North America under current conditions and four future climate scenarios. We found that 11 out of 14 leafhopper species share a similar environmental niche with more species. Meanwhile, Colladonus geminatus, Edwardsiana rosae, and Exitianus exitiosus show less similarity in the environmental niche. Interestingly, a similar trend appears to grow across climate change scenarios. Our prediction points to warm and humid regions in North America as potential high-richness areas, with fewer species expected to occur in arid and colder areas. Under all climate scenarios, we observed an expansion of the suitable regions and species overlap, especially in the northern area of the continent. Our findings suggest a positive link between future climates and the potential occurrence and environmental niche similarity of 14 North America’s Nearctic leafhopper species with some degree of association with phytoplasmas (Table 1).
According to our models, temperature significantly influences positively the distribution of most leafhopper species investigated in this study. In the Nearctic region, temperature is the primary factor driving leafhopper distribution. Historical periods of high temperatures are thought to trigger large-scale dispersal of leafhopper species into northern areas16,19. During winter, some leafhopper species undergo temperature-related diapause in their egg, nymph, or adult stages14,19,70, while migratory species such as Empoasca fabae overwinter in southern regions23. As temperatures rise in early spring, leafhopper populations start to increase from both diapausing stages and the arrival of migratory species due to continental-scale winds24,25, with populations peaking in warmer months22,23,31. Leafhopper populations in the Nearctic region exhibit shorter life cycles in warmer conditions21, resulting in more yearly generations than colder ones23,70. Yet, precipitation also plays a role in species occurrence, particularly noted in our models for Erythroneura comes, Erythroneura vitis, Graphocephala fennahi, and Jikradia olitoria. Heavy precipitation, especially during early nymphal stages, affects the mobility of leafhoppers and can cause species mortality13. In addition, high humidity indirectly impacts species’ performance by affecting their plant hosts, as noted for Erythroneura spp., which tends to increase populations due to weakened host plants due to moisture70.
Upon conducting an environmental niche analysis, we show substantial environmental similarity among most leafhopper species. As previously mentioned, historical dispersion patterns of leafhoppers indicate movements from regions characterized by higher diversity and warmer climates to regions with lower diversity and cooler climates, such as between the Neotropical and Nearctic regions16,19,71. Consequently, approximately 90% of leafhopper genera exhibit endemism within their respective zoogeographical regions, demonstrating a marked inclination toward host specificity and limited dispersal rates16. This endemism potentially elucidates the environmental similarity observed among the species under study, given that the majority, 12 out of 14, exclusively inhabit the Nearctic region and only Empoasca fabae is known to not overwinter in Canada13,14,70,72.
Recent surveys suggest potential overlap and environmental niche similarity among some Nearctic leafhopper species. These observations are based on initial evidence of increased species richness in specific regions. For instance, ref. 53 documented 17,496 leafhopper specimens across Canadian vineyards (British Columbia, Québec, and Ontario), spanning 54 genera and 110 species. Notably, the genera Empoasca, Erythroneura, and Macrosteles were found to be widespread. Plante et al.22 captured 33,007 leafhopper specimens from Quebec strawberry fields, representing 61 genera and 118 species, with Empoasca, Macrosteles, and Hebata prevalent. However, it is crucial to acknowledge that these studies employed different sampling methods, targeted distinct sites, and hosts, and were conducted in separate years. Therefore, caution is necessary when interpreting this initial evidence. Further studies with standardized methodologies are needed to confirm this potential trend of species overlap.
In contrast, three species, Colladonus geminatus, Edwardsiana rosae, and Exitianus exitiosus, displayed a reduced level of niche similarity, suggesting a more specialized environmental niche within regions characterized by lower species richness. Intriguingly, two species, Colladonus geminatus and Exitianus exitiosus, exhibit distribution and abundance within grassland habitats13,73, which are recognized for harboring reduced species diversity compared to humid environments13,16.
Our assessment of species richness has uncovered a geographical trend for the species evaluated: areas with higher humidity and moisture generally support a greater variety of species, with numbers dwindling in drier and colder regions. This prediction aligns with prior observations in southern Ontario/Québec13 and New Hampshire17, areas known for high biodiversity. These findings suggest a complex relationship between environmental conditions and the resulting distribution of leafhopper species.
Under the four climate change scenarios studied, our network analysis revealed a notable rise in species similarity, hinting at a likely increase of species overlap within their suitable habitats in forthcoming scenarios8. Some initial indicators emphasize the impact of rising temperatures on the species associated studied, leading to larger distribution areas for these species. For example, the northward shift of the migratory Empoasca fabae in North America has sped up over the last 62 years, a change linked to warmer temperatures23. This earlier arrival has notably intensified infestations, potentially favoring this species in the North American region23. A recent survey conducted in Québec’s strawberry fields identified 11 leafhopper species for the first time in the province. Ten of these species were the farthest observed towards the east in Canada, marking a significant expansion22. This survey also noted a considerable increase in leafhopper species composition compared to data from 14 years ago in vineyards53 and 10 years ago in blueberry fields44, with 53 new species registered in 2021 and 202222. Given our predictive models’ observed range expansion trends, these findings might suggest a growing overlap among Nearctic leafhopper species in North America. However, as previously mentioned, the lack of standardized studies across existing surveys limits comparison. This underscores the need for further research with consistent methodologies to test this hypothesis of widespread Nearctic leafhopper species overlap.
We expect a significant expansion of suitable areas for various leafhopper species, especially in northern areas3,4. This trend mirrors similar trends observed in other groups of crop pests, moving toward northern regions driven primarily by global warming4. This shift results in broader ranges for species distribution and overwintering zones3,4,74. Additionally, multiple lines of evidence support that most species in the Nearctic region are likely to adjust their geographic distribution to occupy areas that meet their specific needs1,6,8,75. This adaptability stems from the ability of Nearctic species to cope with seasonal temperatures and extreme variations, survive cold winters, and succeed in hot summers, thus aligning their life cycles with these environmental conditions6.
In contrast to Nearctic leafhoppers, Neotropical species appear less adaptable to warm climates due to their specialization within a narrower temperature range and increased sensitivity to precipitation changes. For example, Macrosteles quadrilineatus can survive 18 days at 0 °C, but reproduction ceases. Similarly, at 35 °C, survival remains at 18 days, but reproduction is still possible21. This highlights the contrasting thermal tolerance compared to Dalbulus maidis (DeLong & Wolcott), a Neotropical leafhopper, with a developmental temperature range between 20 °C and 30 °C76. A warming climate could significantly reduce suitable habitats for Dalbulus maidis in its native South American range as temperatures approach their upper limit9.
Our study investigated the impact of abiotic factors on current and future potential environmental niche similarity and species richness of 14 North American leafhopper potential vectors of phytoplasmas. However, they do not account for biotic variables such as natural enemies (parasitoids and predators) and the availability of hosts, the seasonal effect on area suitability, or the effect of climate change on continental wind patterns. These factors, collectively, act as a biological filter, influencing the actual niche of the species studied19,54. Moreover, many Nearctic leafhoppers do not inhabit their entire potential range17,19. Therefore, our analyses should be viewed through the lens of the environmental niche concept, focusing primarily on the climatic factors limiting species distribution. This approach often extends beyond the realized niche54.
This study is also limited by the lack of ‘historical’ records (pre-1970) that might still reflect the current species occurrence (e.g., Scaphoideus titanus). We excluded these records to avoid (i) a temporal bias in our dataset, following established guidelines54,55, and (ii) a mismatch with the environmental variables timeline56. Additionally, existing literature for some species only provides presence/absence data without geographic coordinates (e.g.77). Furthermore, distinguishing between taxa in species complexes can be challenging (e.g., Ceratagallia humilis), making it difficult to determine true absences versus those due to nomenclature issues18. Finally, as previously mentioned, the actual distribution of many Nearctic leafhoppers remains unknown or understudied. Despite these limitations, this is the first study to explore the potential richness and environmental similarity of Nearctic leafhopper species across North America’s current and future climate scenarios. Overcoming these limitations, through further studies, expanding species occurrence as seen with other taxa such as bees78, will be crucial for improving future species distribution predictions.
Implications for sustainable agriculture
Our study highlights significant challenges in managing Nearctic leafhoppers, particularly their continued presence in current habitats and their potential movement towards northern regions in North America. Although insecticide resistance in Nearctic leafhopper species has not been studied in depth, new evidence suggests that the heavy reliance on insecticides for leafhopper control in Canada could be becoming less effective at managing populations22. Moreover, the early arrival of migratory leafhopper populations exacerbates plant damage23, potentially leading to increased insecticide usage and increasing the chances of developing insecticide resistance22,79.
Additionally, the potential resilience of Nearctic leafhopper species under warmer climates could amplify the spread of diseases they transmit. It is well-known that temperature fluctuations moderate phytoplasma multiplication within leafhoppers21, and higher temperatures accelerate phytoplasma cycles within plants80,81,82, increasing the chances of acquisition or transmission during vector feeding activities. Given that species such as Macrosteles quadrilineatus have already tested positive for phytoplasma strains that affect multiple hosts38,43, another anticipated effect of climate change might be the expansion of host ranges for these phytoplasmas, previously limited by the temperature and food sources available to leafhoppers, as previously reported by our group happening with the Blueberry stunt phytoplasma strain moving from blueberries41 to lingonberry83 in Québec, Canada.
The changes in climate patterns will lead to increased Nearctic leafhopper activity, migration, and interaction, which will negatively affect plant health. These results call for a complete rethink of our control and integrated pest management strategies to meet these new challenges. Little is done in North America to manage Nearctic leafhoppers. However, leafhopper species like Dalbulus maidis have become a great threat in Brazil after the introduction of Bt-corn84. For example, parasitoids have been explored as a biocontrol strategy85, while more recently, the use of RNAi technology has shown promising results86. Our study emphasizes the need for further research to discover effective products to manage Nearctic leafhopper populations like RNAi, genome-edited crops less attractive to these pests, and tailored biocontrol agents. Additionally, we should explore new methods of biological control and the potential of biotechnology and emerging technologies to halt the spread of these pests and the diseases they carry without harming the environment.


Responses