Precise control balances epidemic mitigation and economic growth

Introduction
Since its emergence in 2019, the Coronavirus Disease 2019 (COVID-19) has posed significant threats to human health, resulting in over 635 million cases and more than 6.5 million deaths worldwide1. To mitigate the spread of the pandemic, countries across the globe have implemented various intervention policies, with a focus on nucleic acid testing2,3 and behavioral restriction policies4,5,6. Nucleic acid testing is used to rapidly and accurately identify infected individuals, with increasing emphasis placed on the coverage of asymptomatic cases. Concurrently, governments have introduced policies to regulate public behavior, including measures such as mask-wearing, social distancing7, travel restrictions8 and case quarantine9, to prevent secondary or multiple transmissions.
The Health Code, employing a two-dimensional QR code, served as a mechanism for individuals to report their health status, which may offer a robust way of epidemic control while maintaining economic development. Health Code was linked to the individual’s distinctive identification number and recorded health condition utilizing personal devices according to COVID testing, travel history, contact history and residence area, etc. The information of Health Code was indicated by automatically generating different colors where green denoted health, yellow indicated high risk and red signified unhealthy state. Only individuals exhibiting a minimal risk were granted access to public spaces. In China, the Health Code has been employed as a digital tool to assist administrators in identifying potentially exposed individuals based on their travel history and to assess the probability of close contact and infection. Unlike technology which uses Bluetooth technology for contact tracing and is limited by signal detection capability10, Health Code employs algorithm and big data technologies and has a large user base in China, with data collected by different levels of government11.
The severity of the situation emphasized the need to strike a balance between protecting public health and promoting economic development. Health Code technology has the potential to improve its real-time and accurate detection of coronavirus infections. However, its impact on public health and economic development remains understudied12,13. We categorized control strategies into three types as “No control”, “Precise control”14,15 and “Extreme control”, based on the population in enforced quarantine. In “No control”, there exists no testing or quarantine measures, and no population would be quarantined. In “Precise control”, population in a red or yellow code assigned by Health Code entails quarantine, which indicates they have been confirmed positive or in high risk due to exposure. While in “Extreme control”, all people are involved in quarantine except a certain percentage of people that cater to the necessary functioning of society. The color of the code that distinguishes between different people is the functionality of the Health Code. It assigns the appropriate color by obtaining information about the mobility of the population and the results of the nucleic acid test. In this work, we translated the effect of Health Code into two ratios of policies which are the nucleic acid detection rate and the quarantine rate respectively.
This paper seeks to address this gap by achieving the following objectives: (1) assess the effectiveness of various control strategies in curtailing the spread of the epidemic; (2) offer guidance on both short-term and long-term control measures from a Health Code perspective; and (3) determine the turning point of the global epidemic utilizing “Precise control”.
Results
Infection cases
Figure 1 illustrates the number of confirmed infection cases in Shanghai under three different intervention policies. People who were confirmed, in close contact with and in other dangerous areas tracked by the Health Code (i.e., people with red and yellow codes) were put in quarantine in “Precise control”, which was defined in the method part in more detail. “Precise control” was found to yield comparable levels of infection and mortality reduction as the “Extreme control” approach, which quarantined all except necessary personnel (Fig. 1). In contrast, the “No control” strategy, which did not impose any measures on individuals who test negative, resulted in the highest levels of infection and mortality (Fig. 1a–c). Importantly, the “Precise control” was found to minimize the impact on productive life while still providing adequate protection against the spread of infection. This trade-off could engender confidence in regular control and may help to mitigate the impact of increased infections as medical research progresses. Moreover, the “Extreme control”, while effective in guaranteeing a healthier population in quarantine (as seen in Fig. 1d–f), may also give rise to other issues, such as those pertaining to the economy, mental health, and household supplies.

a–c Number of asymptomatic, infected people and deaths; d–f Healthy, asymptomatic and infected people in quarantine. The quarantine is executed upon the government taking actions, which depends on the parameter “time” (14 in case Shanghai) representing the period of response time.
Impact on the economy
The relationship between quarantine policies and economic activity is important, as it reflects the level of human activity that is allowed or restricted. The Gross Domestic Product (GDP) is a useful metric for measuring the economic performance of a country. In this study, we analyzed the expected GDP based on the number of active working individuals and the proportion of remote work16,17 under different policies in Fig. 2a. Our results demonstrated that, compared to the “Extreme control” ($ 80.39 billion) and “No control” ($ 185.23 billion) approaches, the “Precise control” yielded a higher total GDP ($ 186.17 billion) during the studied period. This was achieved by maintaining more people in the workforce and producing a higher outcome than the “No control”, although this came at the expense of quarantining a portion of the workforce. Furthermore, the “Precise control” successfully avoided wasting unnecessary quarantine and medical resources, while still ensuring that people could continue working, in contrast to the “Extreme control”.
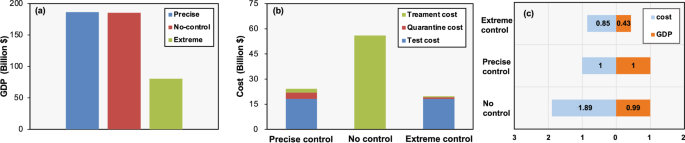
a GDP under different policies; b The prevention costs under different policies; c Comprehensive economic analysis.
Notably, our analysis indicated that the “Precise control” and “No control” had a limited effect on GDP compared to the “Extreme control”. This finding can be interpreted as the reduction in the workforce due to teleworking among the quarantined population resulting from “Precise control” policy almost counterbalanced the loss of workforce resulting from infection under the “No control” approach. Importantly, our results demonstrated that “Precise control” provided significant protection against COVID-19-related deaths, while minimizing the economic impact, and may represent a viable alternative to the more extremist “No control” and “Extreme control” strategies.
We conducted a comprehensive analysis of the costs associated with implementing different quarantine policies during the study period, taking into account the cost per capita of quarantine18, the cost of treating a single case19, and the cost of nucleic acid testing20 to calculate the total cost of quarantine during the study period (Fig. 2b). Our findings indicated that “Extreme control” had the lowest total cost compared to the other policies due to its strict travel restrictions, which prevented numerous transmissions. “Precise control” incurred the highest cost of quarantine ($ 3.81 billion) as it required the establishment of designated quarantine facilities to curb the spread of the epidemic and reduce medical costs. In the absence of prevention and control, there was no cost of isolation and nucleic acid testing, but the cost of medical treatment was very high ($ 55.96 billion) as the number of infected cases increases dramatically. Our results provided crucial insights into the economic implications of implementing different quarantine policies, which can inform policymakers in their decision-making process.
The implementation of “Precise control” policies not only demonstrated potential for increasing GDP through targeted management of human activities, but also minimized the economic burden of epidemic prevention and treatment, with a cost increase of just 15% compared to “Extreme control” (as shown in Fig. 2c). As such, this approach has the potential to serve as a practical and viable strategy for achieving a balance between economic growth and epidemic prevention efforts.
Examining the cost of control measures, nucleic acid testing was the primary contributor to the costs of both “Precise control” and “Extreme control”, while the substantial treatment costs were mainly incurred by “No control”. Overall, “Precise control” offered a beneficial balance between the impact on productive life and the cost of epidemic prevention measures, making it an effective means of optimizing all factors during the early stages of epidemic prevention while minimizing disruption to daily life as much as possible.
Period of shutting down
In the last three years, many cities worldwide have experienced severe outbreaks of infectious diseases, leading to the implementation of city-level shutdowns for varying durations. The use of Health Code has provided valuable insights into the management of epidemic control strategies. Figure 3 shows the shift in control strategy from “Extreme control” to “Precise control” during a wave of the epidemic, where the number of days indicated the time of the shift, and the corresponding percentage above represented the proportion of the abnormal code population in the total population at the time of the shift. It has been demonstrated that shifting to “Precise control” when the percentage of abnormal code is 0.19% (24 days after the control policy was initiated) led to an acceptable trend in epidemic development. Adopting such a shift strategy can save 30 days of “Extreme control” during this two-month wave of the epidemic, resulting in a steady decline in cases without further peaks. This finding suggested that the policymakers could start to implement “Precise control” from this time point. From then on, the sooner it was carried out the quicker people could get back to the normal life.
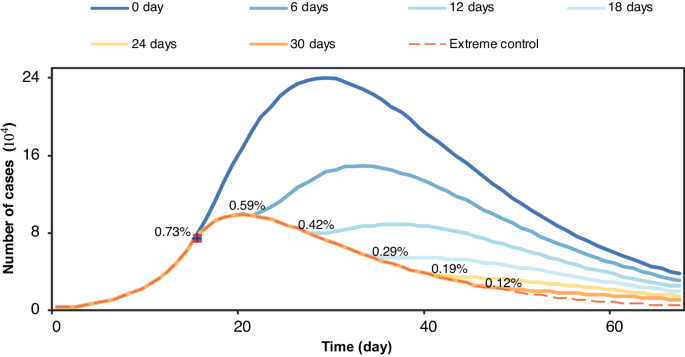
No peak recurrence will appear if switching to “Precise control” when the percentage of abnormal code is 0.19% (24 days after the control policy was taken).
Given the response time required to contain an outbreak and the potential for a rapid increase in infection rates during this period, it was deemed appropriate to initially implement “Extreme control” measures before transitioning to “Precise control”. A premature shift in policy would likely result in another peak in the epidemic, whereas a delayed shift would significantly impact economic and human activities. Thus, policymakers could utilize simulations to guide policy shifts and identify the threshold proportion of individuals with abnormal codes at which a recurrence of the epidemic’s peak would be avoided. This approach was not only feasible, but also valuable for achieving effective and efficient epidemic prevention and control.
Allocation of resources
The randomized allocation of nucleic acid test (NAT) resources across all groups (Fig. 4) was found to be an inefficient approach for detecting COVID-19 cases. On the other hand, a “priority” strategy that allocated NAT resources to specific groups (Fig. 4) based on Health Code indicators, such as individuals with yellow codes, has been shown to increase the successful detection rate (rate of being correctly detected as positive). In this study, we compared the performance of these two strategies under various scenarios, including the 15-day case, peak-day case, last-day case, and cumulative case (as shown in Fig. 4). The 15-day case, peak-day case, and last-day case represented the current situation on the 15th day, the day with the highest number of cases, and the last day of the epidemic wave, respectively. The cumulative case measured the overall test rate at different NAT quotas throughout the epidemic period. Our findings indicated that the “priority” strategy, guided by Health Code indicators, was more effective in identifying high-risk populations and achieving higher successful test rates, particularly when considering the cumulative confirmed cases throughout the epidemic period.
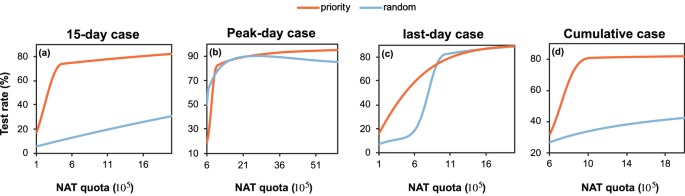
a day 15; b the day of peak infection; c the last day of the wave; d throughout the period. NAT nucleic acid test. Nucleic acid test quota is the number of tests for nucleic acid that can be performed in a day.
In the initial stages of an epidemic, there is often a shortage of medical resources and limited time to respond. In this context, Health Code can be used to identify specific populations for targeted control measures and prioritize allocation of medical resources. By prioritizing nucleic acid tests for individuals who have had close contact with infected persons and therefore have a higher likelihood of infection, missed infections can be more effectively detected. However, the cost of nucleic acid tests is a major factor in implementing “Precise control” measures, and simply increasing the number of tests may not be economically feasible. To address this issue, simulations assisted by Health Code can help identify a threshold for the number of tests needed. Increasing the number of tests beyond this threshold would not result in a significant increase in detection rates. By using Health Code to identify high-risk populations and allocating medical resources rationally, unnecessary costs can be avoided. This approach not only helps to reduce cost wastage but also enhances the efficiency of epidemic prevention and control efforts.
Limitations of the control
It has been established that the COVID-19 virus has been evolving toward a more contagious state21. In this study, we conducted simulations to assess the most extreme scenario that can be addressed under current preventive policies. We used ({R}_{0}) to represent the degree of infectiousness of the disease, while ({r}_{1}) (the nucleic acid detection rate) and ({r}_{2}) (the quarantine rate) were defined as measures of intervention intensity. The effectiveness of “Precise control” depended on a range of ({r}_{1}) and ({r}_{2}) values. A remarkable reduction, defined as the cases under “Precise control” not exceeding 10% of cases under “No control”, was considered as the threshold for successfully suppressing the epidemic.
As depicted in Fig. 5a, our simulations demonstrated that even under the most intense interventions with the highest values of ({r}_{1}) and ({r}_{2}), the most infectious disease that can be suppressed was one with an ({R}_{0}) of 16.50. This suggested that there were limits to what can be achieved in terms of suppression of diseases with higher ({R}_{0}) values. Our results indicated that ({r}_{2}) had a stronger preventive effect compared to ({r}_{1}) when set to the same intensity. It was worth noting that the same ({R}_{0}) can be achieved with various combinations of ({r}_{1}) and ({r}_{2}), providing policymakers with the flexibility to choose the most feasible and cost-effective strategy based on the epidemic stage. As shown in Fig. 5b, when ({R}_{0}) of the disease was higher than 16.50, the effectiveness of control decreased with increasing ({R}_{0}), and once ({R}_{0}) reached a certain threshold, the number of cases can no longer be suppressed. With the COVID-19 virus evolving towards a more infectious status, it was possible that an uncontrollable epidemic may occur in the future. In this case, reducing response time to control transmission before it reached an explosive state would become the top priority for government managers and policymakers.
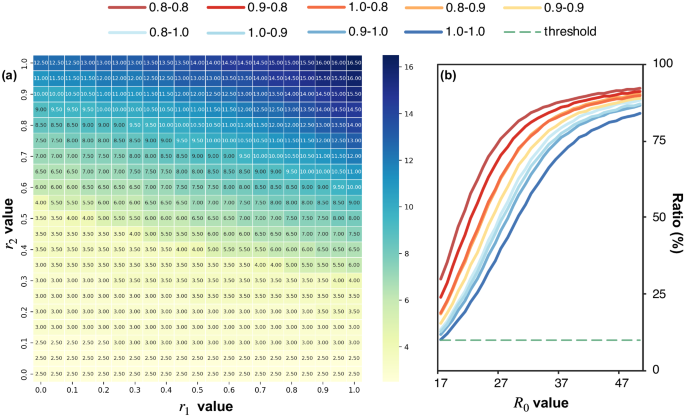
a The ({R}_{0}) value that can be controlled by the coordinated control of different detection (r1) and quarantine rates (r2); The numbers in the grids are ({R}_{0}) values. The darker the color, the more infectious (larger ({R}_{0})) the virus it can control. b The infections ratio compared to no control situation under different control intensities (each line is a different “r1–r2” precise control). The green dotted line present prevention threshold that is 10% of uncontrollable control.
The Health Code was designed to manage different groups of people based on their health status. However, its effectiveness in controlling the spread of the virus may diminish when the virus becomes highly contagious. In this study, we evaluated the efficacy of the Health Code in reducing the number of cases compared to the scenario of “No control”. Our findings indicated that there existed a limit to the ability of the Health Code in controlling the spread of the virus. This can be attributed to two factors. First, the response time to an outbreak plays a crucial role in determining the success of control measures. If the virus is highly infectious, the number of cases during this period may already be too large to control. Second, conducting nucleic acid tests on a large scale becomes meaningless and costly when the number of infected individuals is already too high to manage. Therefore, we conducted an analysis to determine the threshold of virus infectivity beyond which the use of Health Code for community-wide prevention and control is no longer recommended.
End of the control
According to reports, the COVID-19 virus has been evolving towards a more infectious state with a higher ({R}_{0}) value but a lower death rate. As a result, there are two potential scenarios that could mark the end of the epidemic with prevention measures being limited. The first scenario involves the virus becoming weak enough to not cause severe pandemics, while the second scenario involves the virus becoming too infectious for any intervention measures to be effective. In light of these concerns, there are two significant time points to consider: ({d}_{1}), the day when the virus becomes less fatal than the common flu22 (with a 0.1% death rate), and ({d}_{2}), the day when the virus evolves to have a ({R}_{0}) value higher than the threshold of 16.50 as shown in Fig. 5. In this study, we have collected global death rates in each period (Supplementary Fig. 1a), and have calculated the comprehensive ({R}_{0}) value for each period by considering the proportion of each mainstream COVID-19 strain in different periods as the weight (Supplementary Fig. 1b).
Based on the historical development of COVID-19 variants, we performed an exponential fit of death rate and ({R}_{0}) to epidemic development time. It was anticipated that when the ({R}_{0}) value would reach 16.50 in the future and the fatality rate of the disease will be comparable to that of a common cold. As the virus becomes less virulent and more infectious, the value of “Precise control” diminishes, and it is expected that the epidemic will eventually come to an end. Based on current trends, it was projected that the virulence of the virus would weaken significantly by September 2022 (Supplementary Fig. 1a), and control efforts will be necessary until approximately August 2022 (Supplementary Fig. 1b).
The efficacy of control measures may be diminished due to limited medical resources and increased infectiousness as the virus becomes more contagious and less deadly. As demonstrated in Supplementary Fig. 2a, the number of infections under “Precise control” may approach the number of infections without any control strategies. In settings when the mortality rate of the virus was high, the adoption of “Precise control” could be critical and could potentially prevent almost 400,000 deaths in Hong Kong by December 31, 2022 (Supplementary Fig. 2b).
Discussion
This study presented an evaluation of various control strategies to mitigate the spread of the COVID-19 epidemic, and proposed both short-term and long-term approaches to control the disease from a Health Code perspective. In this section, we first discussed global instances of the policies mentioned. Then we reviewed the existing related studies and the differences between ours. Next, we gave the suggestions for control based on the experimental results from a macro point of view. Finally, we analyzed the robustness of our proposed model and the limitations of our approach.
We here show several similar global instances of health code application. Despite our strategy delineation was ideal, in actual fact some districts were close to it. There was a massive lockdown in Europe at the end of 2020. In France, people could only leave their homes for work (if unable to work at home), to buy necessities, to seek medical help and social gatherings were prohibited. From the second of November, Germany introduced new restrictions across the country, including the closure of cinemas, gyms, restaurants and bars. Socializing is limited to two families and the number of people is capped at ten. People in all regions of Spain, except the Canary Islands, must stay at home between 23:00 pm and 6:00 am. These measures23 can be seen as “Extreme control”. Since February 2020, the epidemic spread rapidly across the Middle East and North Africa region, nearing “No control” in some regions due to economic levels and government initiatives. In Iran, the government was focused on organizing the late February parliamentary elections and delayed the implementation of outbreak control measures24. A similar idea to Health Code for categorized management was seen at the regional level in Italy, which can also be posited as a variant of “Precise control”. The whole country was divided into red, orange and green zones where red zones have the highest infection rates23.
Extensive researches regarding the above epidemic control has been proposed before. Yang and Wang25 proposed a mathematical model to investigate COVID-19 in Wuhan, which can fit the reported data of the outbreak well. Based on this, Lemecha and Feyissa26 presented the effects of implementing three controls strategies and concluded that minimizing the number of exposed and infected population taking into account the cost of implementation led to the optimal control. Existing research has shined lights onto the power of quarantined effect. Memon et al.27. developed a deterministic model to analyze the influence of quarantine and isolation in controlling the spread in Pakistan by adding quarantined and isolated classes into a mathematical model. Firth et al.28. built a full epidemic model to simulate COVID-19 dynamics across the Haslemere network to assess the impact of contact tracing strategies for controlling these outbreaks, advocating for combining physical distancing with contact tracing. Nashebi et al.29 also used real-world network to investigate the effects of stay-at-home restrictions, work hours, vaccination, and social distance on the containment of pandemics, finding that decreasing working hours is the least effective among the non-pharmaceutical interventions. As for research of Health Code in China, most of them summarized the comprehensive utility of Health Code30 and assessed the effectiveness of other measures based on the information from Health Code such as the effectiveness of vaccines31 rather than the impact and policy development of Health Code as a tool in itself. All of these studies modeled the transmission of epidemic and analyzed the effectiveness of various control strategies, lacking quantification of the effectiveness and capacity limits of specific strategies detailed policy making which may garner considerable attention in practical. Given the community’s interest in how digital Health Code can play a role in epidemic prevention, numerous reports32,33,34 have informed the masses about how digital health codes can effectively govern the city from a popular science perspective, as well as some academic article12,35. However, few of them have focused quantitatively on the impact of health codes on infections and the economy while our focus was on examining the role and quantitative effectiveness of Health Code in this period, especially the scope and limits of Health Code’s ability and the concrete policy making associated with it, leaving researchers with a lack of intuitive judgments.
We aimed to observe the trade-offs between human health and economic activity resulting from the control strategy assisted by the Health Code. Such a balance can instill confidence in regular control and minimize the impact on a productive life. Additionally, as medical research progresses, this approach is expected to mitigate the subsequent impact of an increased number of infections36. In view of our research, some essential guidance for prevention and control should be emphasized.
Given the response time required after an outbreak37, it may be advisable to adopt an “Extreme control” in the early stages before transitioning to “Precise control”. An untimely policy shift could result in a resurgence of the epidemic, whereas a delayed shift could significantly impact economic and social activities38. As such, policymakers may find it beneficial to utilize simulations to guide the timing of the policy shift based on the proportion of individuals with abnormal Health Code. By identifying the appropriate proportion, policymakers can potentially prevent a recurrence of the epidemic peak. During the early stages of an outbreak, medical resources and time are often limited39,40,41, and it becomes necessary to prioritize certain populations for control measures and resource allocation. For instance, by prioritizing nucleic acid tests for close contact with a higher probability of infection, it is possible to detect missed infections more effectively. However, the cost of nucleic acid tests is a major component of the “Precise control” strategy, and it is not economical to simply increase the number of tests. To optimize the allocation of resources and reduce wastage, it is necessary to identify a threshold for the number of tests beyond which the detection rate will hardly increase. The use of Health Code can help in rationalizing the allocation of medical resources and minimizing unnecessary costs. The Health Code’s effectiveness in mitigating the spread of the virus may be limited in cases where the virus is highly contagious. Our analysis suggests that there exists a threshold to the ability of the Health Code in reducing the number of cases, as compared to the scenario of “No control”. As such, we proposed a practical policy shift that involves analyzing the threshold of the virus that can be controlled by the Health Code, and determining the extent to which the virus has mutated to the point where the use of the Health Code for community-wide prevention and control is no longer recommended.
Our study highlights the significance of the Health Code in the early stages of epidemic prevention, given the characteristics of the coronavirus strains that are more infectious with time but become less virulent. Therefore, it is crucial to adopt reasonable control measures42,43,44 during the early stages of the epidemic when the virus is more virulent and controllable while also taking into account economic vitality to determine the optimal timing for transitioning from “Extreme control” to “Precise control”. When the virus is highly contagious, the resources expended in epidemic control yield limited benefits, and alternative and more effective countermeasures, such as medical interventions, must be considered. Nevertheless, impeding the spread and progression of COVID-19 as much as possible is paramount for the survival of human society.
We also conducted some additional experiments to verify the robustness of the model and the sensitivity during strategy implementation. All the experiments were conducted in Shanghai as example. (I) Model robustness. The parameters in the model only affect the searched values of the parameters without affecting the experimental results. Regarding some of the parameters fixed in the model derived from prior empirical literature, they usually do not have absolute ground truth. These contagion parameters are not the core of our study and their purpose is to allow us to find strategy-related parameters that best fit the real data of the city of interest. Varying these parameters as long as they fit the real urban data will lead to the same experimental conclusions. We chose (gamma) (which means recovery ratio and is 8.06 in our study) as the varying parameter as an example (other parameters are also allowed to be changed). Two altered values were considered, 6 and 10, above and below the reference value, respectively. The results of the fit on the same data are shown in the Supplementary Table 4 and Supplementary Fig. 6. We observe that all three sets of parameters are well fitted and consistently reflect strong control (high ({r}_{1}) and ({r}_{2})) in Shanghai. The robustness of the model lies in that the parameters of the reference will not affect the conclusion between three control strategies. Despite the different values in three sets of parameters, the results continue to derive the same conclusion that “Precise control” yields comparable levels of infection and mortality reduction as the “Extreme control” approach (Supplementary Fig. 7) and has a limited effect on economy compared to the “Extreme control” (Supplementary Fig. 8). (II) Sensitivity analysis of the framework. To analyze the sensitivity of our proposed framework, we considered two factors in the model. Specifically, we analyze the impact on the results, when (1) an error in the nucleic acid test (MAT) occurs and (2) a delay in the assignment of Health Code appears, respectively. To simulate the error, we changed the positive detection rate (({r}_{1})) from 0.9 to 0.8, 0.5 and 0.3, holding other experimental settings unchanged. To simulate the delay, we postponed the assignment of Health Code for 1 day, 3 days and 5 days respectively (0 day for the original experiment). We focused on three aspects arising from the delay of Health Code assignment or error of NAT, i.e., the infection situation, the health code capture accuracy, and the economic impact. As for the infection situation (shown in Supplementary Fig. 9), both delay and error lead to an increase in the number of infected people, up to double in the worst cases. However, even severe delays and errors still greatly mitigate the development of an outbreak compared to “No control” at all. Further investigating the role of Health Code in this case, delays and errors have a greater impact on red codes and a lesser impact on yellow codes (Supplementary Fig. 10). When considering the impact on the economy, it is still possible to maintain a level of GDP comparable to “No control” in the presence of errors and delays while would consequently result in a significant cost increase (Supplementary Fig. 11). (3) Strategy robustness. Viruses are in a state of continuous evolution, and how long a Health Code strategy can last for effective prevention and control is a matter of concern. According to our results of limits of control, the most infectious disease that can be suppressed was one with an ({R}_{0}) (basic reproductive number) of 16.50. For evaluating the robustness of the Health Code system, we continued to study two viruses, the Alpha (({R}_{0}) = 2.5) before Omicron and the variant BA.5 (({R}_{0}) = 18.6) after. Note that the Alpha strain did not have a notably higher rate of asymptomatic cases, asymptomatic data were not recorded. We first fitted the parameters to the nature45,46,47,48,49 of the strain (shown in Supplementary Table 5) and then presented the fitting results in Supplementary Figure 12. Only Alpha strain achieves a good fitting performance. It means that when the virus exceeds the most infectious virus (derived as ({R}_{0}) = 16.5) which Health Code can control, the Health Code-based system is unable to model disease well. Take a further look at the role of Health Code in both strains from the tracking success of red and yellow codes (Supplementary Fig. 13). The control ability in Alpha period tends to be acceptable while in BA.5 period, even though there is still a high tracking success rate, the impact of the free development is prominent throughout the period. The validity of the Health Code is limited in BA.5 period and this is also consistent with previous findings. In fact, as the virus became more contagious and mortality rates declined, Health Code no longer continued to be used in later years.
There are several important limitations to our study that need to be considered due to the simplified epidemic model of “Precise control”. A major limitation is that the model simulated the spread of the epidemic based on different categories of people, which lacked the identification of human identity and the individual contact, leading to an inaccurate depiction of spatio-temporal contacts and transmission probabilities, especially in close-contact situations. Such limitations deviate from the actual design of the Health Code due to the lack of fine-grained social data. This may weaken the effect of “Precise control” and add restrictions on human activities. The parameters set in the paper about COVID-19 refer to the literature and news reports, which may be not the exact values of the real situation. And the results given in this paper is more about the analysis of overall trends and impact while the values are not completely accurate. However, we focused on the overall trend and the role that health codes actually play, and our simulations showed that it is reasonably in line with the real situation. Considering that Health Code required the collection of personal information, privacy issues were at the forefront of citizens’ concerns. According to the report, 70.70% of the surveyed concerned about information security and 49.18% of them concerned about privacy breach30. It is very natural to be anxious about the collection of personal travel information and health condition. In this regard, the collection of information in the Health Code could only be authorized by government agencies and it just linked to the individual’s distinctive identification number without leaking personal identifiers for commercial purposes. Moreover, “Privacy Information Act of the People’s Republic of China”50 regulates how to deal with sensitive personal information and clarified the responsibility of government officials in privacy protection. Apart from this, research on maximizing the protection of personal privacy with Health Codes, such as blockchain31, has also been developed.
Methods
Mathematical model
The SEIR (Susceptible/Exposed/Infected/Recovered) compartmental model has been a conventional approach in simulating the dynamics of epidemic and virus spread51,52,53. In this model, the infected population is considered as contagious. Some previous studies51 also incorporated the infectivity of the latent population into the SEIR model. The mathematical relationships between different compartments are described by the following set of equations:
(S) represents the susceptible population and (I) represents the Infected population. (N) is a fixed population of the city. The conversion between the different components is described by equations that involve parameters such as the transmission rate (beta), which is the product of the virus reproduction number ({R}_{0}) and the recovery ratio (gamma), and the rate of infection among the exposed population σ.
The SEIR model has been extensively used in the early evaluation of several epidemic waves51,52. In this paper, we focused primarily on the strain of the coronavirus, Omicron. Nevertheless, due to the characteristics of this strain, the epidemic caused by it displays particularities of its own. (1) Asymptomatic transmission. The Omicron variant and its subvariants are known to have a notably higher rate of asymptomatic cases compared to previous COVID-19 strains, resulting in a significant number of contagious individuals without symptoms. (2) Epidemic prevention policy intervention. Governments worldwide have implemented various policies aimed at reducing the spread of the virus. These policies include measures such as mask mandates, social distancing requirements, frequent nucleic acid testing, and mandatory quarantine policies.
To assess the impact of policies related to nucleic acid testing and quarantine, we incorporated relevant parameters into our model. Specifically, we considered the positive detection rate (({r}_{1})), which indicated the probability of successfully administering nucleic acid tests to a population and obtaining accurate positive results, and the corresponding quarantine rate (({r}_{2})), which reflected the likelihood that individuals in need of quarantine will be accurately identified and transported to quarantine facilities.
Taking into account the distinct characteristics of the Omicron variant and the influence of policy intervention, we have developed an extended version of the traditional SEIR model, known as the SLAIRD model, which incorporated the following additional compartments: susceptible (S), latent (L), asymptomatic (A), infectious (I), recovery (R) and death (D). This modified model allowed us to more accurately capture the dynamics of virus transmission and the impact of various policies on controlling the spread of the disease:
Where (sum A={A}_{t-1}^{0}+{A}_{t-1}^{T}+{A}_{t-1}^{Q}), and (sum I={I}_{t-1}^{0}+{I}_{t-1}^{T}+{I}_{t-1}^{Q}).
The model considers a fixed population of (N) individuals, who are classified into different groups denoted by (Xin left{S,L,A,I,R,Dright}). The groups of (left{S,I,Rright}) have the same interpretation as in the original model. The group L represents individuals who have had contact with the virus and are at risk of being infected. The group A represents asymptomatic individuals who are contagious but show no symptoms. The group D represents individuals who have succumbed to the disease. Furthermore, the model introduces three additional states (left{0,T,Qright}) to track individuals in different intervention stages. The state (0) represents individuals who are not being tracked but require attention, T represents individuals who have tested positive for NAT but are not yet in quarantine, and Q represents individuals who are currently in quarantine and not in contact with others.
In the SLAIRD model, a susceptible individual transitions to group L with a probability of β, which is calculated as the virus reproduction number ({R}_{0}) divided by (left(1-xi right)gamma), where (xi) represents the probability of individuals in L returning to S, and (gamma) is the recovery ratio. The L group then transitions to either the A or I group at a rate of (alpha). Asymptomatic individuals in the A group will eventually recover, while infected individuals may pass away at a rate of (d). Recovered individuals in the R group will retain immunity before returning to group S at a ratio of (rho). When individuals enter the A or I group, there is a probability of ({r}_{1}left(1-{r}_{2}right)) that they enter state T, and a probability of ({r}_{1}{r}_{2}) that they enter state Q. The transition probabilities between different groups were shown in Supplementary Fig. 3. For brevity, only the probability of transfer was indicated, and the period was omitted. A detailed description of the corresponding parameters was listed in Table 1.
The proposed SLAIRD model was employed to forecast the progression of the epidemic in several cities worldwide, including Shanghai (current daily cases), New York (new daily cases), and Los Angeles (new daily cases). The predicted daily case curves were compared with the actual case curves and presented in Supplementary Fig. 4. The accuracy of the model was evaluated by calculating the error between the predicted and actual case curves, as shown in Supplementary Table 1. The duration of non-prevention was considered as the time axis for the analysis. The results indicated that the SLAIRD model can forecast the epidemic progression curve with a low error rate.
Health Code and precise control
The Health Code is a QR code generated using an individual’s health and location information from the past 14 days, including nucleic acid test results and vaccination status. During the COVID-19 pandemic in China, it was utilized as an electronic passport. The Health Code system classified individuals into three colors: green, yellow, and red, and relevant epidemic prevention authorities applied different control measures according to the color of the Health Code.
In the context of the mathematical simulation of epidemic and virus dynamics mentioned previously, an individual’s identity was not accessible, and risks in different regions were not differentiated. To address this, we simplified the definition of the three categories of the Health Code. People who have been detected as symptomatic or asymptomatic cases are assigned a red code, i.e., ({A}_{t}^{T}), ({A}_{t}^{Q}), ({I}_{t}^{T}) and ({I}_{t}^{Q}). Similarly, individuals who have been traced to have been exposed to the virus are assigned a yellow code, i.e., ({L}_{t}^{Q}), which was also controlled by the quarantine rate ({r}_{2}) among group L. The impact of the Health Code was reflected through two rates above, and effective tracking of cases and possible contacts using the Health Code would contribute to a higher ({r}_{1}) and ({r}_{2}).
In essence, the Health Code system classified individuals according to their potential for spreading the virus. Specifically, the following rules applied:
(1) Individuals with a red code are considered certainly infectious, including confirmed cases of both symptomatic and asymptomatic individuals;
(2) Individuals with a yellow code are highly likely to be infectious in the future, including those who have been in contact with group (1) but tested negative temporarily;
(3) Individuals with a green code have not been exposed to the virus or have been exposed but have not been screened, i.e., ({L}^{0}), ({A}^{0}), ({I}^{0}). The detailed rules were presented in Supplementary Table 2.
We demonstrated how Health Code can help track those people that had been infected and that were likely to spread the virus by focusing on the successful rate of Health Code tracking the target human group in Shanghai over time. The successful rate was the ratio of the number people who were assigned the corresponding Health Code to the number of people who should be in this group. Note that, here we assumed the control strategy was starting at day 14 from the beginning of the outbreak. Although started late, the Health Code tracking system can quickly catch up and track more than 90% of the target human group within few weeks as shown in Supplementary Figure 5. Hence, it can provide strong support to customized control policy on people at different risk levels.
We have categorized epidemic prevention policies into three distinct groups based on the size of the population they aim to control: No control, Precise control, and Extreme control.
-
No control: involves taking no additional measures beyond identifying individuals who have already displayed symptoms and have tested positive for the virus. All activities continue as usual for the rest of the population.
-
Precise control: entails isolating individuals with a red or yellow Health Code, i.e., those who have been confirmed positive for the virus or are likely to be infectious in the future due to exposure. In our simulation, we set the positive detection rate and corresponding quarantine rate as ({r}_{1}) and ({r}_{2}), respectively.
-
Extreme control: involves isolating all non-essential personnel, leaving only those required for essential functions such as nucleic acid testing, policing, and basic city operations. We assume that approximately 10% of the population falls into this category.
To explore the impact of the Health Code on epidemic prevention policies, we analyzed “Precise control” measures implemented in Shanghai. Our analysis was based on several assumptions, including the constancy of the city’s total population (N), the absence of any changes in the virus’s reproductive number ({R}_{0}), and the strict adherence of individuals under control to relevant rules and regulations.
Analysis of the impact of different policies
Our analysis of the impact of different epidemic prevention policies on infection, human activities, and social economy involved obtaining the daily numbers of asymptomatic, infected, and death cases from the SLAIRD model. Additionally, we tracked the number of people who were quarantined under different policies. To compare the trade-offs of different policies in balancing the spread of the epidemic and the restriction of human activities, we plotted the cumulative cases and deaths, as well as the number of people quarantined per day under each policy in a single figure.
Through the process of fitting the annual growth trend of GDP in Shanghai, China, spanning a 40-year period from 1980 to 2019, and incorporating annual population data, we derived the GDP per capita for the duration of the study. Considering the influence of infected individuals and those in quarantine on the overall workforce, we made the assumption that individuals displaying symptoms would be unable to contribute to the workforce. The distribution of the workforce under different prevention and control policies was presented in Supplementary Table 3. To incorporate the effects of quarantine measures, we incorporated the remote work rate observed in China in 202216,17. By combining the remote work rate specific to various industries with the number of individuals available for work, we aggregated the data to calculate the total GDP over the study period and conducted comparisons among the different policies.
Moreover, by leveraging the population figures derived from our simulation model, we integrated various medical and quarantine expenditures (including the per capita cost of quarantine18, the cost of treating a single case19, and the cost of nucleic acid testing20) to estimate the economic implications associated with different policy approaches. The quarantine cost encompassed the product of the per capita cost of quarantine and the number of individuals placed under isolation, where the isolated population comprised individuals from the ({A}^{Q}) and ({I}^{Q}) groups, each being isolated individually. The testing cost entailed conducting nucleic acid tests for all individuals not belonging to the (R) and (D) groups. As for the treatment cost, we adopted distinct fee structures for the detected asymptomatic population (({A}^{T}), ({A}^{Q})) and the symptomatic population (({I}^{T}), ({I}^{Q})) on a per-person basis.
While “Extreme control” limited human activities to contain the epidemic, “Precise control” minimally restricted healthy populations, resulting in an inevitable increase in cases. In the early stages of intervention, adopting “Extreme control” to quickly stop the spread of the virus followed by switching to “Precise control” after a certain period was considered an advantageous strategy. In our simulation for Shanghai, we implemented “Extreme control” on the fifteenth day, following 14 days of free epidemic development. We examined the impact of switching to “Precise control” after “Extreme control” over different periods on the cumulative number of cases throughout the epidemic period, using the proportion of abnormal codes (i.e., red and yellow codes) as a guiding indicator for the strategy switch.
Nucleic acid test allocation
Allocation of Nucleic Acid Tests (NAT) is critical during an epidemic outbreak, especially when NAT resources are limited and time is of the essence. Effective prioritization of NAT can improve positive detection rates by allocating tests to specific groups based on their Health Code status. In this study, we compared the efficacy of two contrasting NAT allocation strategies, namely, “priority” and “random” and analyzed their influence on test rates under different NAT quotas. The test rate was defined as the ratio of the number of detected cases (({A}^{T},,{A}^{Q},{I}^{T},{I}^{Q})) to the number of actual infections ((sum A,, sum I)) for the entire outbreak period.
To demonstrate the role of Health Code in identifying potentially infected individuals, we temporarily disregarded the allocation of NAT to the diagnosed population (e.g., people with red code), as they were already definitively detected. We classified the latent population into three groups, ({L}^{0}), ({L}^{T}) and ({L}^{Q}). ({L}^{T}) individuals have been indirectly exposed to the virus but were not infected and were at low risk of infection. They have been traced but were not quarantined. ({L}^{0}) individuals were capable of transmitting the virus to ({A}^{0}) and ({I}^{0}) and are possibly not successfully traced at the time of infection. We assumed that 5% of traced contacts are direct contacts (({L}^{Q})). We assigned priority groups to people with yellow code (({L}^{T}), ({L}^{Q})), and critical people who were not tracked successfully are assigned green codes. We further assumed (M) ((Mle N)) NAT quotas per day and assigned the “priority” strategy to allocate NAT to the yellow-coded population first, while the “random” strategy assigned NAT evenly to the entire population. Correspondingly, the positive detection rate became the product of ({r}_{1}) and ({r}_{{NAT}}). The detailed NAT rate ({r}_{{NAT}}) was given by:
If (M) is larger than the number of the people with a yellow code:
Else:
We calculated the positive detection rate on a daily basis by considering the allocation of codes on the previous day. The test rate was measured using the cumulative number of individuals in each group over the entire outbreak period.
The limit of intervention
Limitations of intervention were assessed by defining when a disease cannot be suppressed, based on the total number of cases under “Precise control” (i.e., ({r}_{1}) and ({r}_{2}) cooperating together) exceeding 1.5% of the total population and 10% of cases under “No control”. We determined the maximum ({R}_{0}) value that can be suppressed using the current control strategy by increasing it for each ({r}_{1}) and ({r}_{2}) pair until the accumulated cases under the control strategy reached 10% of the cases under “No control”. If this threshold is surpassed, then the limit of intervention capacity under “Precise control” is considered to have been reached, with the impact of this intervention being marginal.
We also examined the number of cases under different degrees of “Precise control” compared to “No control” when ({R}_{0}) exceeds the maximum capacity of “Precise control” (i.e., when ({r}_{1}={r}_{2}=1)). To explore the relationship between the effectiveness of “Precise control” and the infectiousness and death rate of strains, we used real data from Hong Kong with relatively less intervention. During the period of the last two strains, we considered the presence of asymptomatic patients and set the ratio of asymptomatic patients as 78%54, as calculated from reported cases. We assumed that the quarantine resources were limited to 50,00055 and that infected populations were given priority over asymptomatic and latent populations. For simplicity, we used the fitting parameters from Shanghai for the rest of the parameters, which did not affect the conclusions of the experiment. The cumulative number of infections in each period was calculated from the initial state of the model, and the death reduction was obtained by multiplying the difference between the number of infections under the two policies by the death rate of the corresponding period.
Reporting summary
Further information on research design is available in the Nature Research Reporting Summary linked to this article.
Responses