Predicting oxytocin binding dynamics in receptor genetic variants through computational modeling

Introduction
Oxytocin (OXT) is a peptide hormone that regulates a multitude of physiological functions within the brain and reproductive systems. Specifically, OXT plays a crucial role in parturition and lactation, as well as in regulating several social and cognitive functions, including mating, aggression, and fear1. Recent evidence also suggests the involvement of the OXT system in neuropsychiatric conditions, such as autism spectrum and anxiety-related disorders2. Importantly, the synthetic form of OXT, Pitocin, is given to nearly two million women annually to induce or augment labor in the USA3. However, the recommended range of OXT dose varies widely, by up to 20-fold4,5,6. Higher doses of OXT are associated with a high risk of uterine rupture and hyperstimulation, whereas lower doses may prolong labor potentially leading to fetal infection and the need for cesarean delivery5,6,7,8,9. The serious consequences of inappropriate OXT dosing have motivated research on understanding and predicting the differences in OXT responsiveness amongst individuals.
The variability in OXT dosing can be partially attributed to genetic differences, specifically polymorphisms in the OXT receptor (OXTR) gene, which encodes the OXTR10,11,12,13,14,15. These polymorphisms can influence receptor function, leading to variations in uterine contractility and labor progression. For example, variants in the OXTR gene, such as SNP rs968389, are associated with differences in maternal OXT response, potentially impacting labor dynamics16,17,18,19.
Further complicating the determination of appropriate OXT dosing, OXT–OXTR interactions vary between cell types, and the OXT dose response in biologically relevant cells remains inadequately explored. For instance, specific naturally occurring genetic variants (OXTR polymorphisms), such as V281M and E339K, in the OXTR gene significantly hamper the surface localization of OXTRs, resulting in reduced OXT–OXTR binding and diminished OXT response in HEK293T cells overexpressing exogenous OXTR5. However, HEK293T cells lack the endogenous machinery for OXTR trafficking and signaling. Obtaining biologically relevant measurements for various genetic variants in human myometrial smooth muscle cells is challenging due to lower transfection efficiency compared to HEK293T cells, as well as the substantial time and financial costs involved20,21. Therefore, a mathematical model predicting OXT-OXTR binding in myometrial smooth muscle cells could provide valuable insights into how genetic variants influence OXT-OXTR binding and assist in refining OXT dosing strategies tailored to patient-specific genetic profiles. The parameterization of such a model would need to consider both the known influence of dysregulated OXTR surface localization on OXT–OXTR interaction and the biological relevance of the experimental models from which all available data are derived.
The current study addresses the challenges of optimizing OXT dosing by constructing an OXT–OXTR binding framework that incorporates the cell type-specific association rate (kon) and dissociation rate (koff) of OXT–OXTR binding and OXTR variant-specific concentrations on the surface of HEK293T cells or human myometrial smooth muscle cells. Our model offers binding dynamic predictions on dose-dependent WT OXT–OXTR and OXT—OXTR polymorphisms12,17,18,19,22, particularly in myometrial cells where traditional experimental approaches are limited. Our model also provides the first insights into how the heterologous system, HEK293T cells, differs from a biologically relevant context, myometrial cells. Such differential insights are essential for enhancing biological relevance and overcoming the limitations of the data obtained from heterologous systems.
Results
A mathematical model for predicting the effects of genetic variants on OXT–OXTR binding
Five of the most prevalent naturally occurring genetic variants, P108A, V45L, E339K, L206V, and V281M (Fig. 1), alter OXTR activation and signaling in HEK293T cells5. We constructed a mathematical model to better understand the effects of these genetic variants on OXT–OXTR binding dynamics. Specifically, this model predicts the OXT–OXTR binding and complex formation elicited by the OXT concentrations used in in vitro experiments5. The key feature of the model is OXTR-specific and cell-specific parameterization. First, the model uses distinct cell-surface OXTR concentrations, precisely measured for each of the five variants (Table 1, published experimental data). Second, the model uses cell-type specific association rates (kon) and dissociation rates (koff) of OXT–OXTR interaction, because the values differ by cell type, species, and even gestational time (Table 2, literature mined experimental data). These parametrizations are described in detail below.

a A visual representation of the OXTR and oxytocin ligand as well as the specific locations of mutation sites. The image depicts a side-view perspective, parallel to the plane of the plasma membrane. The OXTR protein and the hormone oxytocin are shown as ribbon-like structures. b A top view of the OXTR/oxytocin complex as observed from the extracellular space. c Variant amino acid residue substitutions and their locations in the crystal structure of OXTR (PDB: 7RYC), generated using UCSF Chimera software. The color-coded boxes correspond to several OXTR variants: blue denotes the L206V variant, red denotes the V281M variant, magenta denotes the E339K variant, purple denotes the V45L variant, and green denotes the P108A variant.
Cell-specific and OXTR-specific parameterization
In HEK293T cells, the differential surface localization of OXTR genetic variants is associated with altered responses to OXT5. However, to understand the impact of these genetic variants on OXTR surface localization in biologically relevant myometrial cells, further investigation is needed to inform the development of the mathematical model. In myometrial cells, we found that the V281M and E339K variants significantly reduced the proportion of OXT-OXTR complex formation on the cell surface, whereas the P108A and L206V variants increased OXTR on the cell surface (Table 1, published experimental data). These results were similar to what has been observed in HEK293T cells (Table 1, published experimental data). We found a differential response in HEK293T and myometrial cells for V45L that displayed subtle differences in surface OXTR expression with 7% fewer OXTR molecules on HEK293T cells and 17% more OXTR on myometrial cells when compared to wild-type (WT) OXTR (Table 1, published experimental data). The number of OXTR molecules on HEK293T cells5 and human myometrial cells21 were measured using quantitative flow cytometry and converted to molar concentrations (Table 1, published experimental data).
To accurately represent the OXT–OXTR binding dynamics in our model, we performed an extensive literature survey of OXT–OXTR binding affinity (Kd, Kd = koff/kon) and conducted a meta-analysis on the literature-mined Kd values. We found that Kd values of OXT–OXTR binding range from 0.56 nM to 9.32 nM, varying with the measurement methods, species, and cell types (Table 2, literature mined experimental data and Fig. 2a, meta-analysis model simulation data). For instance, we observed that OXTRs in human myometrium at term (≥37 weeks gestation) bind to OXT with greater affinity (lower Kd), compared to non-pregnant and 1st trimester myometrial OXTRs (Fig. 2b, meta-analysis model simulation data). Importantly, the choice of measurement method can lead to several-fold variations in Kd values. For example, rat myometrial Kd is 1.21 nM by radioligand binding23 and 9.32 nM by binding isotherm24 analysis (Table 2, literature mined experimental data).
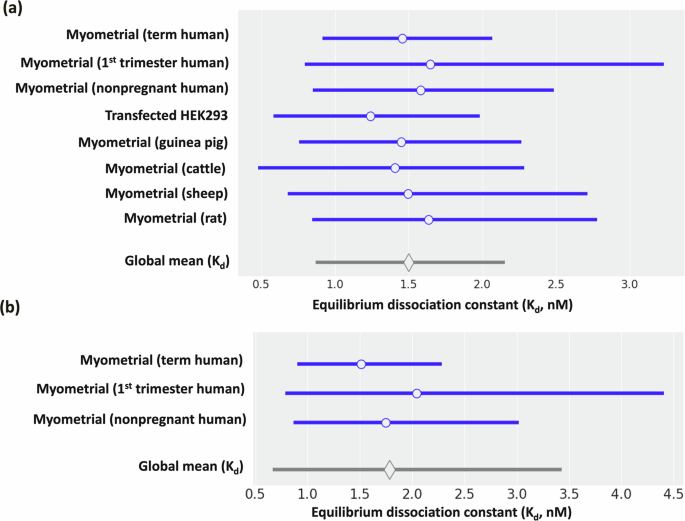
Forest plot of equilibrium dissociation constant (Kd) for OXT-OXTR binding in different cell lines and species. a The cells included in the figure are myometrial cells from term human, 1st trimester human, nonpregnant human, guinea pig, cattle, sheep, rat, and HEK293T cells transfected to express the OXTR. Blank circle shows mean and blue horizontal lines represent 95% credible intervals (CI). Blank diamond represents global mean of equilibrium dissociation constant, Kd = 1.48 nM with 95% CI [0.86, 2.15]. b The myometrial cells from humans only (term human, 1st trimester human, and nonpregnant human) were shown in the forest plot of equilibrium dissociation constant (Kd) for OXT-OXTR binding. The blank circle shows mean and blue horizontal lines represent 95% credible intervals (CI). Blank diamond represents global mean of equilibrium dissociation constant, Kd = 1.8 nM with 95% CI [0.66, 3.43].
With this variation in Kd, we needed to determine the value to use for parametrization in the myometrial and HEK293T cells. While the variation in Kd values for human myometrial cells varied from 0.93 nM to 3.33 nM, only the Phaneuf et al.25 study provided sufficient data for us to extract kon and koff values. Thus, we parameterized the myometrial model with a Kd of 1.6 nM. Notably, 1.6 nM is close to the representative Kd value across all studies (1.48 ± 0.36 nM) determined by our meta-analysis (Fig. 2a, myometrial term human). For HEK293T cells, we found two sources of Kd values, 0.56 nM26 and 1.4 nM27. In this study, we selected the Kd value of 0.56 nM for HEK293T cells because this value was measured using the same radioligand binding method as used in Phaneuf et al. for the myometrial cells25. Consequently, the OXT–OXTR binding affinity in human myometrial cells is threefold weaker than in HEK293T cells in our models. This difference in Kd values could be due to the distinct cellular characteristics of each cell type. Our human myometrial cell model and HEK293T cell model used different Kd, kon, and koff values: kon = 6.8 × 10⁵ M−1 min−1 and koff = 0.0011 min−1 (Kd = 1.6 nM) for human myometrial cells25 and kon = 8.8 × 10⁶ M−1 min−1 and koff = 0.005 min−1 (Kd = 0.56 nM) for HEK293T cells26 (Table 2, literature mined experimental data). Our model assumes the binding kinetics, kon, and koff, are not affected by the genetic variants because none of these variants occur at the OXT binding site (Fig. 1).
Internal model validation: half-maximal occupancy predictions consistent with K
d
Because the binding affinity (Kd = koff/kon) defines the concentration where equilibrium binding capacity is half-maximal, internal model validation was conducted by simulating OXT–OXTR binding at OXT concentrations equivalent to the Kd values for HEK293T cells ([OXT] = 0.56 nM) and human myometrial cells ([OXT] = 1.6 nM, Fig. 3a, b, mathematical model simulation data). The equilibrium was reached at 10 hours in HEK293T cells and at 36 hours in human myometrial cells. As expected, the number of bound receptors at equilibrium in HEK293T cells is ~78,000 complexes/cell (~50% of the free receptors, Table 1, published experimental data), and in myometrial cells, it is ~7000 complexes/cell (~50% of the free receptors, Table 1, published experimental data). Thus, our model is mathematically accurate.
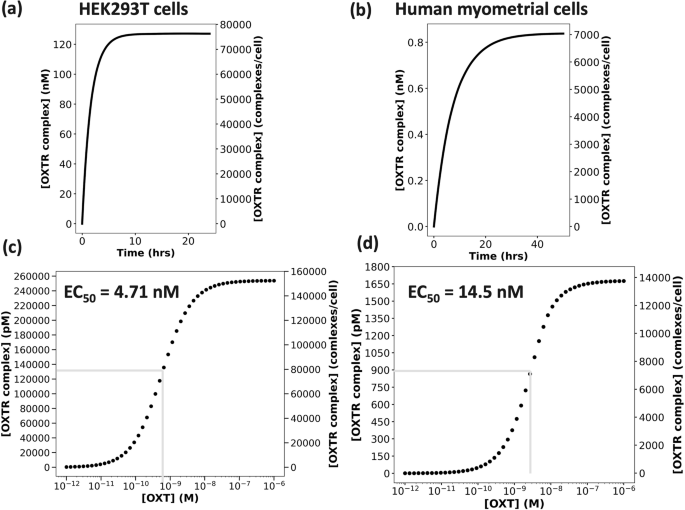
Measures of wild-type OXTRC formation when [OXT] = Kd in a HEK293T cells (Kd = 0.56 nM) and b human myometrial cells (Kd = 1.6 nM). The initial concentration of wild-type OXTR in HEK293T cells was 254 nM (159,539 copies/cell), and in myometrial cells it was 1.68 nM (14,098 copies/cell). Oxytocin dose-response curve for c HEK293T cells and d human myometrial cells. The left y axis shows bound WT OXTR complex in pM, and right Y axis shows the bound WT OXTR complex in complexes/cell. The maximal WT OXTR complex formation was recorded at 10 hours for 50 increasing oxytocin doses ranging between 1 pM to 1 μM.
Model validation to experimental data: OXT EC50 and OXTR occupancy predictions align with experimental observations
To validate that our model can recapitulate experimental outcomes, we first simulated the OXT dose-response curve at OXT concentrations varying from 10 pM to 1 µM and calculated an EC50 of 4.71 nM OXT for wild-type OXTR in HEK293T cells (Fig. 3c, mathematical model simulation data). This EC50 of OXT–OXTR binding aligns with the EC50 of OXT-induced OXTR activation in HEK293T cells, which is 5.4 nM5. Using this framework, we calculated that the EC50 of OXT–OXTR binding in human myometrial cells is 14.5 nM (Fig. 3d, mathematical model simulation data), which also aligns with the experimentally measured EC50 for OXTR activation in human myometrial cells (30 nM)28.
We further validated our model with three initial OXT concentrations (10 pM, 10 nM, and 1 µM) that have been used to induce OXTR activation in HEK293T cells5. Our simulation of HEK293T cell binding dynamics demonstrates a strong alignment with the in vitro experimental observations of OXTR activation. In experimental data, 10 pM OXT is too low to form OXT–OXTR complexes (OXTRCs) in HEK293T cells (Fig. 4a: mathematical model simulation data) and barely induces calcium flux responses5. In HEK293T cells, 10 nM OXT forms 6000 WT OXTRCs/cell, which is only a fraction (~4% of total surface OXTRs) of the maximal potential (Fig. 4b: mathematical model simulation data). Nonetheless, 10 nM OXT induces ~40% of maximal calcium flux in vitro5, suggesting that 6000 WT OXTRCs/cell may be sufficient to induce measurable calcium flux. The highest dose, 1 µM OXT, induces the maximal OXTR activation, which is also seen experimentally as the maximal calcium flux5.
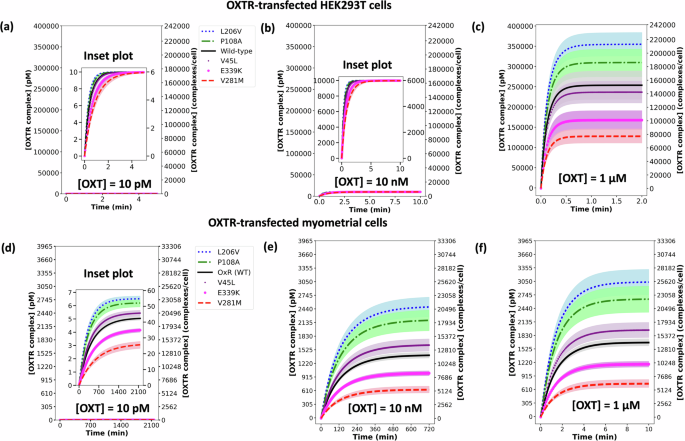
The OXTR complex (OXTRC) formation for all variants at equilibrium in OXTR-transfected a–c HEK293T cells and d–f human myometrial cells treated with 10 pM (a, d), 10 nM (b, e), and 1 μM c, f OXT treatments. The plot shows the concentration of bound wild-type (WT) OXTR and 5 variant OXTRs in pM on the left Y-axis and in complexes/cell on the right Y axis. The zoomed-in plot is shown as inset plot in a, b, and d. The black solid line represents wild type, the blue dotted line represents variant L206V, the green dashed-dotted line represents variant P108A, the purple point–marked line represents variant V45L, the magenta circle–marked line represents variant E339K, and the red dashed line represents variant V281M. The initial concentrations used for OXTR (nM) on the surface of a HEK293T cell were as follows: [WT] = 254 nM, [V281M] = 128 nM, [P108A] = 309 nM, [L206V] = 355 nM, [V45L] = 237 nM, [E339K] = 168 nM. The initial concentrations used for OXTR (nM) on the surface of a myometrial cell were as follows: [WT] = 1.68 nM, [V281M] = 0.75 nM, [P108A] = 2.66 nM, [L206V] = 3.04 nM, [V45L] = 1.96 nM, [E339K] = 1.19 nM.
Model application: human myometrial cells reach near-maximal OXTR occupancy at lower OXT doses than HEK293T cells
To compare OXT–OXTR binding in physiologically relevant cells with that of a heterologous system, we used our model to determine the binding dynamics of OXT–OXTR in myometrial cells at the same three initial OXT concentrations (10 pM, 10 nM, 1 µM) used to induce OXTR activation in HEK293T cells. As expected, human myometrial cells show near-maximum occupancy at 10 nM OXT, because this value is ~10-fold greater than the reported human myometrial Kd (1.6 nM). Indeed, 10 nM OXT is almost as effective as 1 µM OXT for inducing the maximal OXTRC formation, ~12,000 WT OXTRCs/cell (Fig. 4e, f: mathematical model simulation data). However, 10 nM OXT requires ~10 hours to reach near-maximal occupancy, while 1 µM OXT only takes 10 minutes. At 10 pM OXT, which is 150 times lower than the myometrial Kd, the concentration is too low to form OXTRCs on myometrial cells. Fewer than 50 occupied WT OXTR complexes were predicted (Fig. 4d: mathematical model simulation data).
Compared with HEK293T cells, myometrial cells possess three times weaker OXT–OXTR binding affinity and express 10 times fewer WT OXTRs in the numbers of OXTRs on the cell surface (or an over-100-fold fewer in molar concentrations when taking the cell sizes into account). However, myometrial cell OXTR can be adequately activated at a lower OXT concentration (10 nM vs 1 µM) but takes 10 times longer to reach maximal OXTR occupancy at 1 µM OXT (10 min vs. 1 min, Fig. 4c vs. 4f: mathematical model simulation data), compared to HEK293T cells.
Model application in predicting the effects of genetic variants on complex formation in myometrial cells at experimental OXT concentrations
The effect of genetic variants on OXT–OXTR binding in human myometrial cells has not been measured experimentally. Our model predicted the effects of genetic variants on OXT–OXTR complex formation in human myometrial cells at three OXT concentrations (10 pM, 10 nM, 1 µM) that were previously experimentally tested in HEK293T cells. At all concentrations, variants P108A and L206V showed an increase in OXTRC formation while variants V281M and E339K showed a decrease in OXTRC formation as compared to wild-type OXTR (Fig. 4d–f: mathematical model simulation data). While this effect was found at both 10 pM (Fig. 4d: mathematical model simulation data) and 10 nM OXT (Fig. 4e: mathematical model simulation data), the largest difference was seen at 1 µM OXT (Fig. 4f: mathematical model simulation data), which elicited the maximal OXTRC formation. Variants P108A and L206V showed an increase of 58% and 81% in OXTRC formation, while variants V281M and E339K showed a decrease of 55% and 29% in OXTRC formation.
OXTRC formation at the upper and lower bounds of OXTR initial concentration overlapped significantly for the two variants P108A and L206V, in all three simulations (shaded blue and green regions in Fig. 4d–f: mathematical model simulation data). This overlap suggests that these two variants exhibit comparable complex formation capacity in myometrial cells.
Strategizing OXT dosage and treatment duration to activate genetic variants with reduced OXTR activation in myometrial cells
We applied the model to test whether a high-dose regimen (e.g., >1 µM OXT) could rescue the OXTRC formation for V281M and E339K OXTRs in myometrial cells at equilibrium. Our model shows even with high OXT doses, the OXTRC levels in V281M and E339K cells are ~57% and ~28% lower compared with the wild type at equilibrium (Figs. 5a and 6a: mathematical model simulation data). This effect is likely due to the lower OXTR availability in V281M- and E339K-expressing myometrial cells relative to OXT.
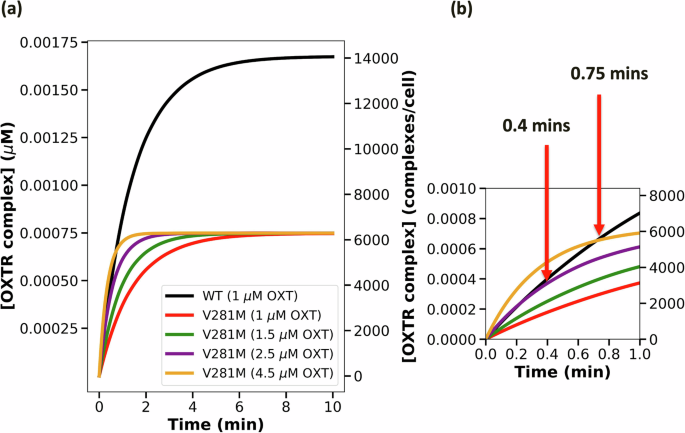
a The trajectories of V281M variant complex formation with increasing doses of OXT. b The OXT dose needed to achieve the wild-type level of complex formation in 0.4 mins and in 0.75 mins.
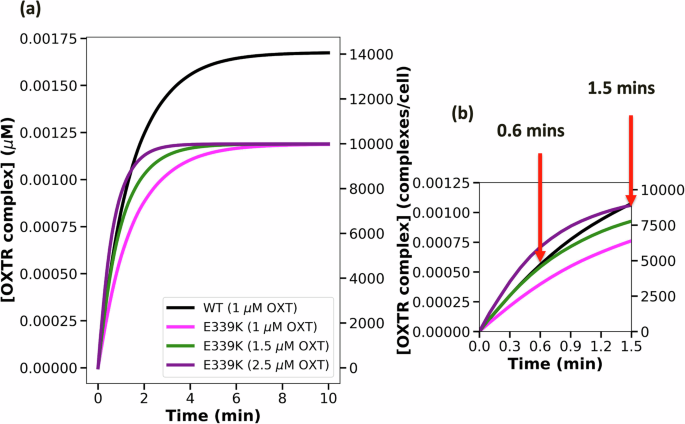
a The trajectories of E339K variant complex formation with increasing doses of OXT. b The OXT dose needed to achieve the wild-type level in 0.6 mins and in 1.5 mins.
Nevertheless, the higher OXT doses can rescue OXTRC formation at early time points (within the first minute), which is a critical period for downstream signaling29. Our simulation suggests that V281M OXTR can achieve the wild-type level of activation by administering 2.5 µM OXT to achieve the wild-type level of OXTRC formation until 24 seconds (0.4 min) or administering 4.5 µM OXT to exceed the wild-type level of OXTRC formation until 45 seconds (0.75 min) (Fig. 5b: mathematical model simulation data). Similarly, E339K OXTRs require 1.5 µM OXT to achieve the wild-type level of OXTRC formation until 36 seconds (0.6 min), or 2.5 µM OXT to exceed the wild-type level of OXTRC formation until 90 seconds (1.5 min) (Fig. 6b: mathematical model simulation data). Therefore, the OXTR-dampening genetic variants could still be adequately activated with higher OXT doses at early time points.
Tuning the adjustment needed in binding affinities of OXTR-dampening genetic variants in myometrial cells
In addition to increasing OXT dosage, engineering OXT that binds OXTR with a strong affinity will help rescue the WT-level OXTRC formation in V281M- and E339K-carrying myometrial cells. Several OXT analogs have been engineered, with the hope of either mimicking (e.g., Pitocin) or achieving improved activation of OXTR (e.g., Carbetocin)30. Here, we determined the binding kinetics necessary for OXTR agonists to effectively bind to OXTRs and rescue WT-level OXTRC formation in V281M- and E339K-carrying myometrial cells. The binding affinity of OXT–OXTR in human myometrial cells at term is 1.6 nM (kon = 6.8 × 10⁵ M−1 min−1 and koff = 1.1 ×10⁻³ min−1). Thus, to achieve WT-level OXTRC formation within the first minute of 1 µM OXT treatment, an OXTR agonist would need to have 30 times stronger affinity (Kd = 0.052 nM) compared to OXT to rescue V281M OXTR and 20 times stronger affinity (Kd = 0.083 nM), compared to OXT to rescue E339K OXTR. Regarding the binding kinetics, the agonist would have a kon = 2.28 × 10⁶ M−1 min−1 and koff = 1.18 ×10⁻⁴ min−1 toward V281M OXTRs (Fig. 7a: mathematical model simulation data) and kon = 1.2 × 10⁶ M−1 min−1 and koff = 1.0 × 10⁻⁴ min−1 toward E339K OXTRs (Fig. 7b: mathematical model simulation data). Therefore, engineering small-molecule OXTR agonists to rescue early signaling of the V281M and E339K requires 20 to 30 times stronger binding than OXT.
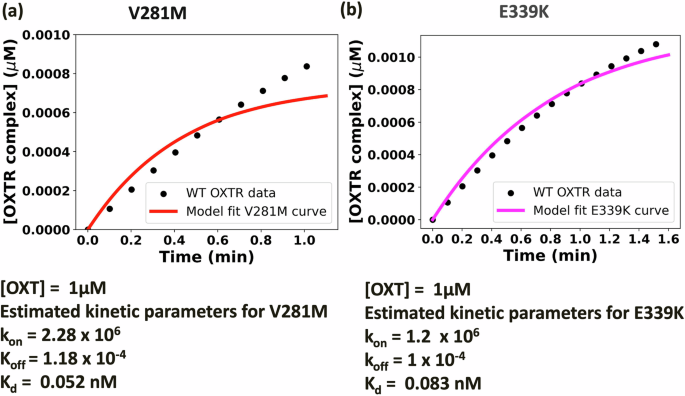
a Binding affinity tuning for V281M with respect to wild-type OXTRC in myometrial cells. We have estimated the association rate constant (kon) and dissociation rate constant (koff) required to achieve the level of WT OXTRC formation in 1 min by V281M OXTRC formation. The model for V281M variant (red line) was fitted to the WT OXTRC formation data (black dots). b Binding affinity tuning for E339K with respect to wild-type OXTRC in myometrial cells. We have estimated the association rate constant (kon) and dissociation rate constant (koff) required to achieve the level of WT OXTRC formation in 1.5 min by E339K OXTRC formation. The model for E339K variant (pink line) was fitted to the WT OXTRC formation data (black dots).
Discussion
Our mathematical model offers data-driven advancements in receptor concentrations and binding kinetics, as well as computational advancement. The model is cell-specific through parameterization with quantitatively distinct OXTR concentrations associated with different genetic variants in HEK293T cells5 and human myometrial cells21. The specificity of this model is further bolstered by the cell-specific OXT–OXTR binding kinetics, obtained through our extensive literature review and meta-analysis. Furthermore, we arrived at the first experimentally validated (via EC50 experimental data prediction), mathematical model that predicts OXT–OXTR interactions in human myometrial smooth muscle cells, the cell type responsible for the uterine contractions mediating labor and delivery. This validated model leverages cell-specific OXTR expression data and OXT–OXTR binding kinetics. Importantly, our model offers three key findings: (1) differences in dosage and time to maximal occupancy between human myometrial smooth muscle cells and the heterologous expression system, HEK293T cells, (2) prediction of decreased complex formation in the V281M and E339K mutants, and (3) predictions of dosing or binding affinity necessary to potentially rescue V281M and E339K complex formation. Our model can help bridge the findings from HEK293T cells and myometrial cells. For instance, our model suggests that the OXT dose response obtained from HEK293T cells (predicted EC50 = 4.7 nM) needs to be scaled up threefold to reflect that in myometrial cells (predicted EC50 = 14.5 nM). Future adaptations to include OXTR concentrations in endogenous myometrial cells under a variety of conditions could facilitate personalized OXT dosing in clinical settings.
Recent breakthroughs in qFlow have led to accurate, reproducible quantification and identification of differential receptor concentrations across normal and diseased cell phenotypes31,32,33,34,35,36,37,38,39,40. These advances enabled us to show, for the first time, how genetic variation affected the presentation of OXTR on the cell membrane. Previously, qFlow has been instrumental in measuring receptor tyrosine kinases (RTKs) that, like GPCRs, are integral to a wide array of physiological and pathological signaling pathways, regulating many facets of health and disease. Computational models have applied this receptor concentration data to offer predictions on RTK signaling. For instance, the model by Finley et al. incorporated parameters like VEGFR concentrations on the surface of healthy and diseased cells, VEGF–VEGFR binding kinetics, and distribution of VEGF-neutralizing antibodies. This model provided predictions for optimizing VEGF-targeting cancer therapies41. Our OXT–OXTR binding model aims to emulate the success of RTK modeling by applying quantitative OXTR data to predict improved OXT dosing for labor management.
Our study demonstrates that the ten-fold difference (in the numbers of OXTRs on the cell surface or an over-100-fold difference in molar concentrations when taking the cell sizes into account) in OXTR surface localization between the transfected HEK293T cells and transfected human myometrial cells, identified by qFlow, contributes to the three-fold difference in the EC50 of OXTR complex formation at 1 µM OXT. In other cell types, previous work has shown that differential protein localization on the cell surface can result in differential cell response. For instance, OVCAR8, a high-grade ovarian cancer cell line, exhibits 44 times more surface AXL tyrosine kinase receptors than OVCAR3, a different ovarian cancer cell line31. The significant difference in AXL abundance contributes to greater resistance to anti-cancer drugs by OVCAR842. Overall, receptor surface localization and receptor binding affinity can be cell-specific and must be carefully considered when studying the receptor-targeted cell responses.
Although transfected HEK293T cells are commonly used to study cell signaling and drug response in vitro5,43,44, including the study of OXT–OXTR binding, this heterologous system differs from biologically relevant cells expressing endogenous OXTR proteins and can lead to differential receptor localization to the cell surface, differential activation, and differential signaling. Indeed, we report a ten-fold difference in the numbers of OXTRs on the cell surface (or an over-100-fold difference in molar concentrations when taking the cell sizes into account) and a three-fold difference in binding kinetics when comparing HEK293T and myometrial cells. Our modeling showed that these differences lead to differential OXT dose responses for OXTRC formation in human myometrial cells compared to HEK293T cells. Our observations of these significant differences between HEK293T cells and human myometrial cells emphasized the need for further investigation into the implications of such disparities to understanding the OXTR signaling. Indeed, the inclusion of nonhuman binding kinetics data (Fig. 2a) offers opportunities to model, identify, and bridge OXT-signaling differences across species. Furthermore, our model exhibits potential in extrapolating myometrial cell responses from existing HEK293T cell data, offering a bridge between heterologous experimental observations and biological significance.
Genetic variants, particularly single nucleotide missense variants that are encoded in the resulting protein, could have adverse effects on GPCR protein expression and function, leading to aberrant drug responses45. Missense variants in OXTR, such as V281M and E339K, were found to decrease OXTR surface localization and reduce OXT response in transfected HEK293T cells5. Our model shows OXTRC formation follows the same trend for myometrial cells, with a decrease of 55% for V281M and 29% for E339K compared to the wild type. The reduced OXTRC formation is due to the lower amount of cell-surface OXTRs available for OXT binding, leading to the 25% lower OXTR activation previously measured in HEK293T cells5. Thus, our model can be useful for predicting the outcomes of drugs and other interventions that enhance OXTR surface localization for rescuing OXTR activation.
We applied our model to test the OXT dose necessary to rescue WT signaling for OXTR variants V281M and E339K, which exhibited lower OXTR surface concentration compared to WT. Our model predicts that a 2.5-fold increase in OXT dose enables these variants to reach or surpass the wild-type binding level within the first 20 seconds of OXT administration. This finding is significant because key cellular responses, such as calcium mobilization, are initiated within this timeframe29. However, despite the ability to increase OXT concentration to rescue the V281M and E339K variants in the short term, the genetic variants cannot attain the maximal binding level of wild-type OXTR. This paradox between short-term (seconds) activation rescue and long-term (several hours) equilibrium deficiency suggests two needs for OXT dosing strategies. First, a need for additional modeling of the full OXTR signaling cascade to determine how the V281M and E339K signal propagates and on what timeframe. Second, experimental studies are needed of the 2.5-fold higher OXT rescue dose, determined by the model, to see if signaling is indeed rescued in the V281M and E339K mutants.
Our model suggests that a 20–30 times increase in binding affinity can rescue the time to WT-level OXTRC formation in V281M and E339K cells—raising the question of whether it is possible to achieve such a significant increase in binding affinity. Human myometrial OXTRs bind more strongly to OXT at term compared to the ‘non-pregnant’ and ‘1st trimester’ myometrial OXTRs (Table 2: literature mined experimental data)46. While our model employs the binding parameters from myometrial cells at term to predict the OXT dose-response during labor, future modeling can probe downstream signaling differences at term versus non-pregnant conditions. Experimentally, Kim et al.22 found that some OXTR genetic variants have altered OXT binding, so binding variations would be the future direction to consider with the mathematical models. In addition, cholesterol and magnesium modulate the binding affinity of OXTR. Cholesterol acts as an allosteric modulator on OXTR to induce a high-affinity state for ligands47, and depleting cholesterol resulted in a 110 times lower binding affinity48. Magnesium forms a coordination complex with OXT and OXTR, and the omission of magnesium can decrease the binding affinity by about 1500-fold49.
Although the depletion of magnesium or cholesterol decreases OXT binding affinity and cannot be applied to rescue deficient V281M and E339K activation, it shows the possibility of manipulating OXT binding affinity. Alternative biologically relevant approaches include the engineering of small-molecule OXTR agonists with higher affinity for variant OXTRs. Currently engineered agonists, such as Carbetocin50 and OXT analogs, including peptide, non-peptide, and hybrid peptide-small molecules30,51,52, all have equivalent or only slightly weaker OXTR binding affinities compared to OXT. With the need for rescuing OXTR activation in OXTR-deficient cells, the engineering of small molecules with enhanced OXTR binding affinity could be pursued.
Although other OXTR signaling models53,54,55,56, including those that involve kinetic studies57,58, have been developed, their limitations prevent using those models in dosage strategies. For example, a mechanistic systems biology model predicted that the A218T OXTR genetic variant affects downstream events by altering receptor stability, activation, and signaling59. However, a limitation of that model is the assumption of OXTR concentrations and binding kinetics based on the data from a non-OXTR GPCR (i.e., serotonin receptor) in HEK293T cells. These parameters are substantially larger than our OXTR-specific parameters. As such, our meta-analysis of OXTR-specific binding kinetics is a first step towards developing a more detailed signaling model for OXT-OXTR. Additionally, the assumed OXTR concentration is 5.5 times higher than our qFlow OXTR data, the assumed kon is ~6.8-fold higher, the assumed koff is 30,000 times higher, and the resulting Kd is 4464 times higher than the parameters used in our model. Although these model types are powerful, they fall short of providing a detailed understanding regarding the variations in OXTR cell surface presentation, binding, and function that differ among cell types and genetic variants. Our work fills this gap by integrating and simulating the biochemistry of OXT signaling and then applying this model to quantify how genetic variants alter signaling. Additional needs to move this model towards predicting the OXTR signaling cascade would require additional data on the OXTR trafficking dynamics (e.g., OXTR internalization, recycling, and degradation rates) and signal transduction processes (e.g., G protein activation, GRK-mediated phosphorylation, and β-arrestin binding.), which in many cases are limited.
In conclusion, this work presents the first mathematical model predicting OXT–OXTR binding dynamics. This model, parameterized through a comprehensive literature search and advanced quantitative flow cytometry (qFlow) measurements, narrows the knowledge gap between experimental findings in HEK293T cells and biologically relevant OXTR-expressing cells, myometrial smooth muscle cells. Our model achieves the necessary validation by successfully replicating the experimental results of OXT–OXTR interactions in HEK293T cells and, crucially, it predicts the optimal OXT doses to potentially rescue deficient signaling in OXTR genetic variants.
This model delivers vital insights into OXT–OXTR binding dynamics in myometrial cells where experimental data are scarce. Furthermore, the model demonstrates immense potential for refining OXT dosing strategies in labor induction and augmentation. The recommended OXT dosage for labor induction and augmentation varies considerably, with a difference of up to 20-fold4,5,6,28. Higher OXT doses carry risks like uterine rupture and hyperstimulation, while lower doses may prolong labor and increase the likelihood of fetal infection and cesarean delivery 5,6,7,8,9. By simulating scenarios with impaired OXT–OXTR binding due to environmental or genetic factors, the model suggests approaches to achieve binding levels comparable to the wild-type condition. While further validation is necessary, this modeling framework offers a foundation for more precise and individualized therapeutic strategies, aiming to optimize while reducing the associated risks.
Methods
Literature mining for OXTR-binding affinity data
We performed an extensive literature search to mine the experimental data for OXTR-binding affinities (Kd) and showed the literature mined data in Table 2. We performed an extensive literature survey using several databases, including Google Scholar, PubMed, LitSense, BioModels, B10NUMB3R5, and UW Library. We used the following keywords to perform the search: “OXT”, “OXT receptor”, “binding affinity”, “myometrial cells”, “HEK cells”, “equilibrium dissociation constant”, “Kd”, “association rate constant”, and “dissociation rate constant”.
We included ex vivo studies that measured the binding affinities of OXTR in myometrial cells from humans (both term and non-term women) or nonhuman animals, including rats, sheep, cattle, and guinea pigs. We also included in vitro studies that measured the binding affinities of OXTR-transfected HEK293T cells. We included studies that measured the binding affinity of OXT to OXTR only. We excluded the studies that measured the binding affinity of other GPCRs than OXTR. We excluded studies that measured OXT–OXTR binding affinity in human breast carcinoma cells. Additionally, we omitted the studies that used cloned human OXTR expressed on COS-1 cells or studied OXTR on rat adipocytes. We have also excluded those studies that measured the binding affinity of antagonists to OXTR.
Data extraction
We used Image J60 to extract data from Phaneuf et al.25 to quantify it for our analysis. We employed the following formula to calculate the reaction rate from the course of OXTR binding data: k = Ln(2)/t1/2, where k is the rate constant of reaction, t1/2 is the time to reach 50% of maximal binding, and Ln(2) is the natural logarithm of 2. We used the association and dissociation rate constants for HEK293T cells provided by Gulliver26.
Meta-analysis using BHM
We employed a Bayesian hierarchical model (BHM) with linear regression and varying intercepts to analyze the equilibrium dissociation constant (Kd), which is a measure of binding affinity. Bayesian hierarchal models with linear regression and varying intercepts allow us to effectively analyze complex datasets, account for hierarchical structure and heterogeneity, and improve parameter estimation. The model was implemented using the PyMC361 library in Python.
This BHM is comprised of varying intercepts; each group (herein, each species and cell type assayed) has its own baseline binding affinity (intercept), reflecting differences in the binding affinity between cell types. However, the effect of the predictor variable (the method employed) on the dissociation rate constant (Kd) is assumed to be consistent across all groups, indicating a fixed slope. In other words, the impact of the method employed (slope) on binding affinity (Kd) remains constant with varying baseline binding affinity (intercept) between cell types assayed. Therefore, regardless of the cell type assayed, a change in the method employed will produce a proportional change in the binding affinity. We estimated the equilibrium dissociation constant (Kd) from BHM for all species and cell types shown in a forest plot (Fig. 2a, b).
The forest plot provides the global (overall) mean and 95% credible interval (CI, there is a 95% probability that the true estimated parameter would lie within this interval62.
Transfected HEK293T cells
Plasma membrane surface OXTR concentrations on transfected HEK293T cells were taken from published quantitative flow cytometry data5. In our mathematical model, we modeled OXT-OXTR binding on a single cell. Thus, we considered the volume of the cell when we converted the number of receptors/cell to molarity (moles/liter). We used the following equation to covert receptors/cell to moles/liter:
where, N = the number of membrane receptors/cell, V = volume of the HEK293T cell, and Av = Avogadro’s number (6 × 10²³). The volume of a HEK293T cell is given as 1046 cubic micrometers (1.046 × 10⁻¹² liter/cell)63.
Transfected hTERT human myometrial smooth muscle cells
Plasma membrane surface OXTR concentrations on transfected myometrial cells were taken from our recently published data that were collected using qFlow21. We used Eq. 1 above to convert the concentrations to molarity. We assumed a myometrial cell volume of 14,047 cubic micrometers (1.4 × 10⁻¹¹ liter/cell)64.
Model construction and assumptions
We constructed a mathematical model to elucidate the OXT binding of WT OXTR and five OXTR variants (V281M, E339K, V45L, P108A, and L206V) as shown in the schematic of the model. A schematic of variants and their positions in the largest OXTR crystal structure is shown in Fig. 1. We assumed that the ligand OXT binds to the OXTR on the cell surface and considered the model for a single cell only. We described the binding of OXT to OXTR on the cell surface using ordinary differential equations as follows:
where [OXT] is the concentration of the OXT ligand, [OXTR] is the concentration of OXTR, and [OXTRC] is the concentration of OXTR complex. The association rate constant of the chemical reactions is given by kon, and the dissociation rate constant is given by koff.
Equation 2 describes the association and dissociation of OXT ligand over time, Eq. 3 describes the association and dissociation of OXTR over time, and Eq. 4 describes the association and dissociation of OXTR complex over time.
We assumed that the process of OXT and OXTR binding on the single-cell surface is continuous. We assumed the binding kinetics is not affected by the studied variants because they are in the OXTR non-binding sites. We assumed that there is no clearance of OXT and that there is no endogenous OXT in this model. We also assumed that there is no desensitization of the receptor binding.
Model parameterization
We performed an extensive literature survey to parameterize the model. We extracted the data from the literature and calculated an association rate constant (kon) and a dissociation rate constant (koff) for human myometrial cells from the given equilibrium dissociation constant (Kd, binding affinity) in Phaneuf et al.25. The results were as follows: kon = 6.8 × 10⁵ M−1 min−1 and koff = 0.0011 min−1 (Kd = 1.6 nM) for transfected human myometrial cells. For transfected HEK293T cells, we used published association and dissociation rate constants from Gulliver26. and the results were as follows: kon = 8.8 × 10⁶ M−1 min−1 and koff = 0.005 min−1 (Kd = 0.56 nM) for OXTR-transfected HEK293T cells. We chose this study because the kinetics were measured by radioligand binding, which aligns with our choice for myometrial Kd value from Phaneuf et al., which was also measured by radioligand binding, thus minimizing the method-associated variation in Kd measurements. The binding affinities from different sources and experimental processes for different cell types are shown in Table 2 (literature mined experimental data) and Fig. 2 (meta-analysis model simulation data).
Model simulations
We performed simulations of the model using the model parameters given above and initial conditions given in Table 1 (published experimental data). We used the Scipy, Numpy, and Matplotlib libraries of Python 3.9.7 to perform simulations, and for parameter estimation, we used the lmfit package (Levenberg-Marquardt method from scipy.optimize.leastsq). The detailed Python script will be provided upon request.


Responses