Preventive role of Pastinaca sativa in mitigating metabolic dysfunction-associated steatotic liver disease via modulation of metabolic endotoxemia

Introduction
Metabolic dysfunction-associated steatotic liver disease (MASLD) is the most common cause of chronic liver disease worldwide. A simulation analysis utilizing data from the United States projected a 21% rise in the population affected by MASLD, increasing from 83.1 million individuals in 2015 to an estimated 100.9 million by 2030. This trend is anticipated to result in a prevalence rate of 33.5% by 20301. Similarly, mortality rates associated with MASLD continue to increase, highlighting the significance of this condition as a pressing global health concern2. MASLD represents a spectrum of liver conditions that range from NAFL to NASH, exhibiting diverse clinical trajectories that may culminate in cirrhosis and hepatocellular carcinoma3.
The pathophysiology of MASLD encompasses various overlapping mechanisms that contribute to the onset of lobular inflammation, which can drive disease progression. Animal studies have highlighted the role of endotoxin translocation in lobular inflammation, likely due to gut dysbiosis and metagenomic richness4. Gram-negative Bacilli within the gut microbiota are the predominant source of enduring endotoxins. Lipopolysaccharides (LPS) are the main endotoxins generated by these microorganisms. Anaerobic gram-negative rods experience a surge in population as intestinal conditions degrade, leading to increased LPS production by these organisms5. This process is significantly impacted by dietary habits. A high-fat diet can result in metabolic endotoxemia, leading to liver inflammation and lipid accumulation, ultimately contributing to the development of MASLD over time (Cremonini et al., 2022).
The parsnip (Pastinaca sativa L.) is a root vegetable native to Europe and Asia, belonging to the Apiaceae family. Parsnip is used medicinally in most parts of the world, not only for their use in foods such as soups, cakes, and muffins, but also due to their rich active components, including furanocoumarins, polysaccharides, and organic acids. Furthermore, these edible roots possess many pharmacological properties, including anti-inflammatory, antispasmodic, vasodilatory, antifungal, antibacterial and antidepressant properties6,7. Parsnip root is mostly made up of neutral detergent fiber (18.4%), pectin (10.10%), and lignin (1.92%), and its high content of dietary fiber, which includes both soluble and insoluble components, provides its potential health benefits8. Parsnip is also known to have beneficial effects on dysuria, anemia, diabetes, and obesity9,10. The fiber content of parsnip may play an important role in regulating gut health and metabolic disorders such as MASLD, such as improving digestion, preventing constipation and gastrointestinal disorders, but the anti-MASLD effect of parsnip has not been reported. Therefore, this study aimed to investigate whether a parsnip root water-soluble extract (PRE) exerts a protective effect against MASLD by reducing metabolic endotoxemia.
Results
HPLC-PAD analysis of marker compounds in PRE extracts
The chemical composition of the PRE extract was successfully characterized using HPLC-PAD analysis (Fig. 1). The major marker compounds were identified by comparing the retention times and UV spectra of the PRE extract with those of reference standards. HPLC analysis confirmed that the major components of the PRE extract are furanocoumarin compounds, bergapten and xanthotoxin, and their contents were quantified as 0.12 mg/g and 0.19 mg/g of dry weight, respectively. These results contribute to the chemical characterization of the PRE extract and provide a foundation for standardization in future studies.

A P. sativa extract; B xanthotoxin; C bergapten.
Effects of PRE mucin production in LS 174 T cells
Cell viability in the untreated control group was 100%, indicating no cytotoxicity. As shown in Fig. 2A, treatment of LS 174 T cells with PRE at 10, 50, 100, 200, 500, and 1000 μg/mL did not decrease their viability; thus, it promoted proliferation. This indicates that PRE is not cytotoxic at these concentrations. Mucin production in the control group was 100%. However, treatment of LS 174 T cells with PRE at concentrations ≥100 μg/mL significantly increased carbohydrate content, which indirectly reflects mucin production (Fig. 2B). At 10 and 50 μg/mL, no significant changes were observed. These results demonstrated that PRE stimulates MUC-2 at concentrations ≤1000 μg/mL (Fig. 2C). Therefore, PRE was used for subsequent experiments.
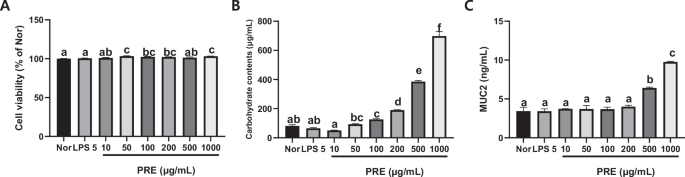
A Cell viability; B carbohydrate contents; C Muc2. All data are presented as mean ± standard error of the mean (n = 3). Values with different letters are significantly different at p < 0.05 by Duncan’s multiple range tests.
Effects of PRE probiotic growth
The prebiotic activity score of four strains (two types each of Lactobacilli and Bifidobacteria) obtained using 0.5% parsnip material (Fig. 3) revealed a higher bacterial growth than that obtained using inulin. The prebiotic activity of L. bulgaricus and L. gasseri strains was approximately 1.2 and 1.6 times higher than that of the Inulin group at a parsnip material concentration of 0.5%. Furthermore, B. longum and B. bifidum strains were 1.3 and 2 times more active than those in the Inulin group, respectively, and 2.0 and 4.2 times more active than those in the 0.1% parsnip group.
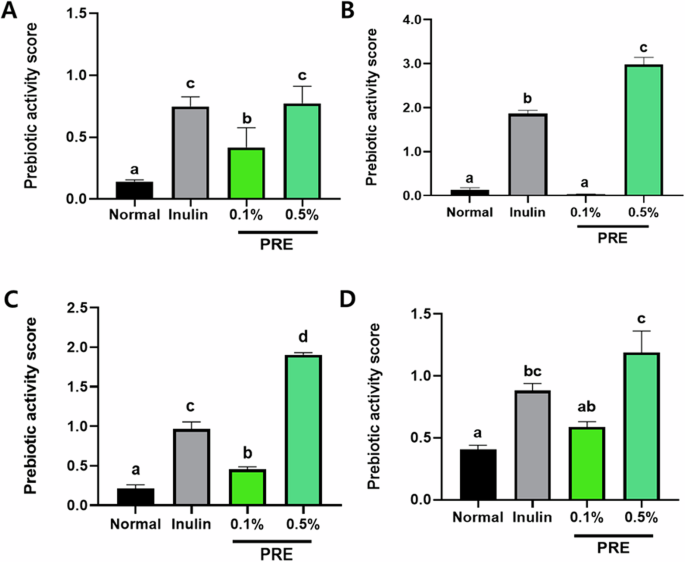
A Lactobacillus delbrueckii subsp. bulgaricus; B Lactobacillus gasseri; C Bifidobacterium bifidum; D Bifidobacterium longum. All data are presented as mean ± standard error of the mean (n = 3). Values with different letters are significantly different at p < 0.05 by Duncan’s multiple range tests.
The pH of each strain on the parsnip material was measured as shown in Table 1. The pH of the L. gasseri strain culture medium at 0.5% parsnip material decreased by approximately 0.6 (6.80 to 6.20 before and after the reaction, respectively). Moreover, the pH of the 0.5% parsnip material in the L. gasseri and B. longum strains decreased by approximately 1.8 to 2.3 (6.62 and 6.81 to 4.35 and 5.05 before and after the reaction, respectively). This is comparable to the pH of the inulin group before and after the reaction. The results demonstrated a decline in pH compared to the control. Consequently, it was established that the four strains (L. bulgaricus, L. gasseri, B. longum, and B. bifidum) reduced the pH of parsnip material to a slightly acidic level, which was less than that observed with inulin.
Effects of PRE on body and liver weight
The body weight of mice in the HF group was significantly higher than that of those in the ND group (Fig. 4A). The assessment of body composition revealed a significant increase in fat contents in overweight mice compared to ND mic (Fig. 4B, C). Moreover, we observed a marked increase in liver weight, hepatic triglyceride levels, and MDA levels in the HF group (Fig. 4D–F). In contrast, mice in both the PRE50 and PRE100 groups exhibited significantly reduced body weight and fat. These results indicate that PRE not only reduced the HF-induced increase in liver weight but also improved metabolic disorder parameters.
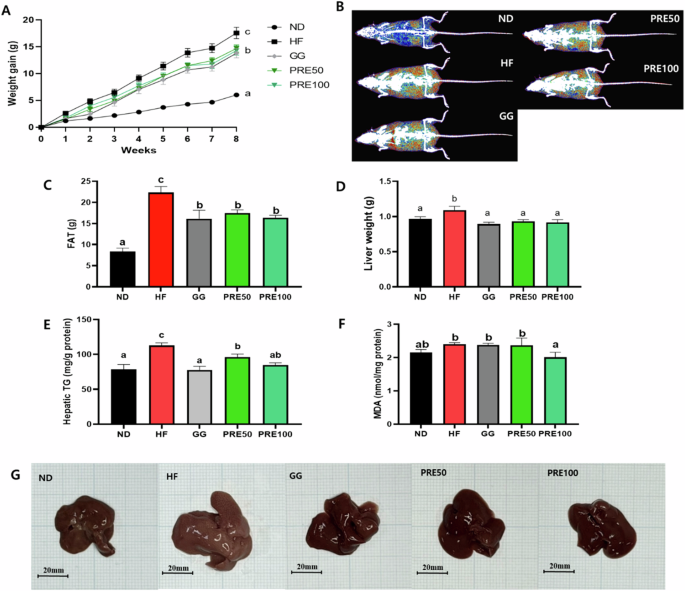
A Changes of weight gain during the experimental period; B Representative body composition images (red = fat tissue, blue = lean tissue); C A fat gram of fat tissues; D Liver weight; E Hepatic triglyceride (TG); F Malondialdehyde (MDA); G Photos of the liver. All data are presented as mean ± standard error of the mean (n = 9). Values with different letters are significantly different at p < 0.05 by Duncan’s multiple range tests. ND normal diet, HF high-fat diet, GG Garcinia gummi-gutta.
Effects of PRE on serum lipid profiles
We measured serum levels of ALT, AST, TG, TC, HDL, and LDL to evaluate the effects of PRE on serum lipid profiles. HF-treated mice showed significantly higher serum ALT, AST, TG, TC, HDL, and LDL levels than ND mice (P < 0.05) (Fig. 5A–F). The increased activity of AST and ALT in the HF group indicated liver damage. Although PRE treatment improved ALT, AST, TG, TC, and HDL cholesterol levels, LDL cholesterol levels showed no significant differences HF the group.
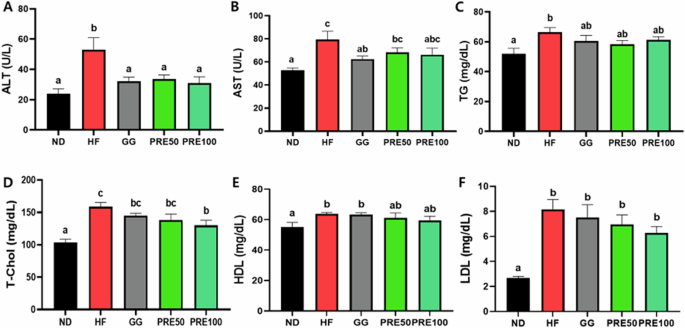
A Serum alanine aminotransferase (ALT); B Serum aspartate aminotransferase (AST); C Serum triglyceride (TG); D Serum total cholesterol; E Serum HDL cholesterol; F LDL cholesterol; All data are presented as mean ± standard error of the mean (n = 9). Values with different letters are significantly different at p < 0.05 by Duncan’s multiple range tests. ND normal diet, HF high-fat diet, GG Garcinia gummi-gutta.
Effects of PRE on glucose tolerance and insulin resistance
Glucose tolerance and insulin resistance were evaluated to investigate the relationship between PRE administration and fatty liver disease in mice induced with a high-fat diet. The OGTT and insulin resistance are significant pathophysiological elements of MASLD. HF administration significantly increased glucose intolerance, fasting blood glucose levels, serum insulin levels, HOMA-IR, and leptin (P < 0.05) (Fig. 6A‒E). However, PRE administration decreased these biomarkers when combined with HF. Furthermore, the PRE 50, and100 mg/kg groups showed 8.89%, and 6.42% lower OGTT AUC values than the HF group, respectively. However, this decrease was not significantly different in the HF group (Fig. 6A).
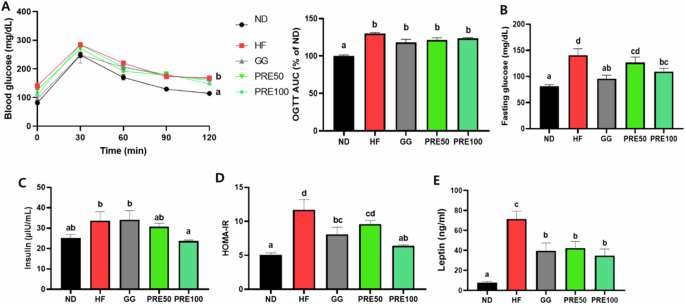
A Blood glucose levels during oral glucose tolerance tests and area under the curve of blood glucose levels; B Fasting blood glucose levels; C Serum insulin levels; D Homeostatic model assessment for insulin resistance (HOMA-IR) index; E Leptin. All data are presented as mean ± standard error of the mean (n = 9). Values with different letters are significantly different at p < 0.05 by Duncan’s multiple range tests. ND normal diet, HF high-fat diet, GG Garcinia gummi-gutta.
Effects of PRE on lipid metabolism in liver tissue
The ORO-positive staining areas of HF-fed mice were significantly increased (Fig. 7A). Similarly, H&E staining showed a significant increase in fat deposition and steatosis scores in the liver (Fig. 7B). However, both high and low doses of PRE significantly reduced the liver ORO-positive staining area and fat deposition. The expression levels of proteins associated with lipid metabolism were evaluated to determine the potential efficacy of PRE treatment against hepatic fat accumulation. HF consumption significantly upregulated the expression of lipid metabolism-related proteins, such as ACC, CHREBP, CEBPα, G6PD, SREBP1, and FAS compared with that in the ND group (Fig. 7C).
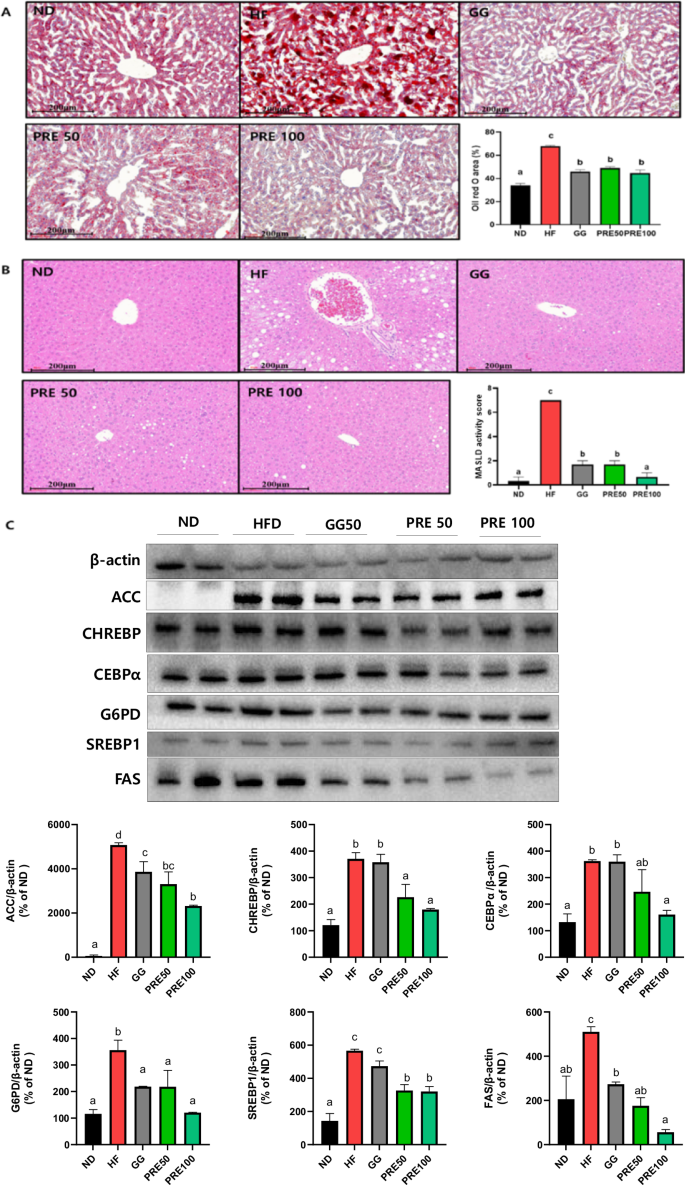
A Representative histological results using oil red O staining; B representative histological results of H&E staining and metabolic dysfunction-associated steatotic liver disease (MASLD) activity score; C Representative western blots of acetyl-CoA carboxylase (ACC), carbohydrate response element-binding protein (ChREBP), CCAAT/enhancer-binding protein α (C/EBPα), Glucose-6-phosphate dehydrogenase (G6PD), sterol regulatory element-binding protein-1 (SREBP1), and fatty acid synthase (FAS). Band intensities are normalized with β-actin and data are expressed as the mean ± SEM. Values with different letters are significantly different at p < 0.05 by Duncan’s multiple range tests. ND normal diet, HF high-fat diet, GG Garcinia gummi-gutta.
Effects of PRE on gut barrier function
Gut permeability and endotoxin levels were significantly higher and ZO-1 expression was significantly lower in the HF group than those in the ND group. Conversely, mice in the PRE group did not exhibit improved gut permeability. In addition, PRE-treated mice showed significantly increased protein expression (Fig. 8A–C). The PRE group inhibited the infiltration responses of inflammatory cells whereas the HF group showed remarkable histological changes in the colon tissues (Fig. 8D).
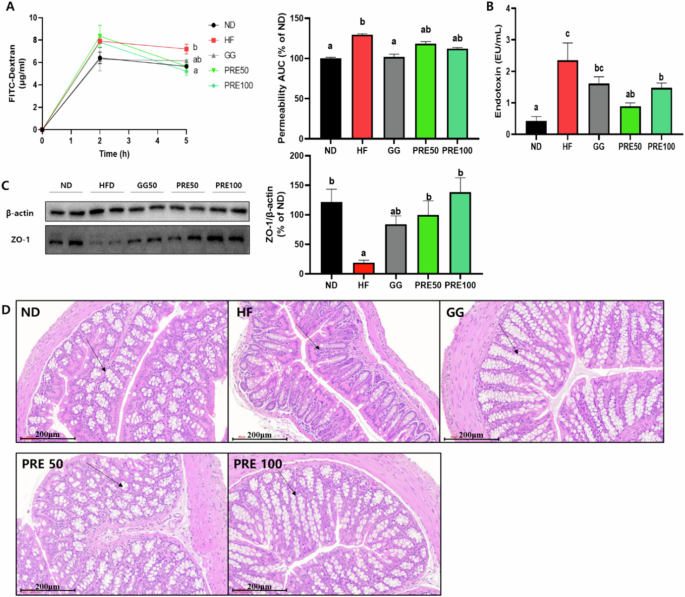
A Plasma FITC-dextran concentration during gut permeability test and area under the curve of plasma FITC-dextran levels; B serum endotoxin; C protein expression of ZO-1. Band intensities are normalized with β-actin and data are expressed as the mean ± SEM; D representative histological results of colon tissues H&E staining. Values with different letters are significantly different at p < 0.05 by Duncan’s multiple range tests. ND normal diet, HF high-fat diet, GG Garcinia gummi-gutta.
Effects of PRE on the gut microbial composition
The phylum and genus level fecal microbiome is summarized in Fig. 9A. At the genus level, the HF group showed a significantly altered gut microbial composition and had a lower proportion of Ligilactobacillus, Mediterraneibacter, Ruminiclostridium, and Feifania. However, this group had a markedly higher proportion of Mammaliicoccus, Enterococcus, Harryflintia, and Phocaeicola than the ND group (Fig. 9B).
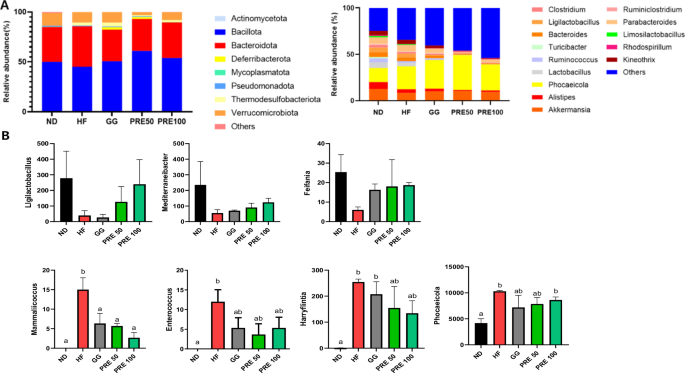
A Relative abundance plot of bacterial phyla and genera; B Proportion of Ligilactobacillus, Mediterraneibacter, Ruminiclostridium, Feifania, Mammaliicoccus, Enterococcus, Harryflintia, Phocaeicola. All data are presented as mean ± standard error of the mean (n = 3). Values with different letters are significantly different at p < 0.05 by Duncan’s multiple range tests. ND normal diet, HF high-fat diet, GG Garcinia gummi-gutta.
Correlation between fecal metabolites and metabolic parameters
Differences in the metabolites between the ND, HF, and PRE-treated groups were verified by comparing heatmaps (Supplementary Fig. 1A). Amino acid metabolites such as ornithine, proline, and 3-indole propionic acid were significantly increased in the HF group. However, deoxycholic acid exhibited a significant decrease in the HF group and a significant increase in the PRE-treated group (P < 0.05). The association between fecal metabolites and metabolic parameters linked to metabolic disorders was assessed through Pearson’s correlation analysis (Supplementary Fig. 1B). Most metabolites related to amino acid pathways, except for lysin and cystine, were positively correlated in the weight gain and OGTT category. Conversely, most amino acid- and indole-related metabolites were negatively correlated with ZO-1. In particular, a positive correlation was observed between gut permeability, HOMA-IR, G6PD, SPREBP1, and ACC associated with 3-indole propionic acid. In contrast, deoxycholic acid was predominantly negatively correlated with various metabolic disorder parameters.
Discussion
Metabolic endotoxemia, defined as an elevation of serum endotoxin levels in response to a high-fat Western diet, has recently gained increasing recognition5. This increase in LPS was associated with inflammation in the liver and adipose tissue, which ultimately contribute to the onset of MASLD and insulin resistance11. A high-fat diet disrupts the balance of the gut microbiota, resulting in the generation of harmful compounds such as LPS. Furthermore, the proliferation of detrimental gut bacteria and toxic compounds in response to a high-fat diet is associated with heightened gut permeability through inflammatory processes and the impairment of tight junctions, consequently resulting in metabolic endotoxemia12. In addition, several studies have shown a clear correlation between the inflammatory and metabolic disorders induced by high-fat diets and the LPS mechanisms13.
Plant extracts and their derivatives have several pharmacological properties, including antibacterial, anticancer, anti-inflammatory, and antidiabetic effects. Pastinaca sativa contains polyacetylenes such as falcarinol and falcarindiol and furanocoumarins such as bergapten and xanthotoxin that have therapeutic effects against neurological, respiratory, gastrointestinal, hepatic, dermatological, cardiovascular, and urogenital diseases14,15.
Prebiotics are defined as food ingredients that selectively stimulate the growth and activity of beneficial bacteria in the gut, such as probiotics. The prebiotic activity of PRE on four strains of probiotics was measured in vitro, and superior prebiotic activity was observed compared to inulin. This method can be used to predict the production of short-chain fatty acids (SCFAs) through culture. SCFAs act as an energy source for intestinal epithelial cells, strengthen the immune system, and regulate metabolism. They can also help suppress the growth of harmful bacteria by maintaining a slightly acidic intestinal environment. Production of the mucin protein MUC-2, a major component of the mucus layer that protects the intestinal barrier16, was evaluated. MUC-2 production was evaluated using LS174T cells, which are widely used as an in vitro model for evaluating mucin synthesis and secretion effects17,18. PRE stimulated carbohydrate (mucin) and MUC2 production in a dose-dependent manner but did not affect cell survival rates in LS174T cells. These results demonstrate that PRE induces mucin production.
PRE treatment alleviated MASLD by changing the pathological values of common symptoms of MASLD and metabolic regulation disorders, such as high body weight, liver weight, liver triglyceride levels, and liver function enzymes induced by a high-fat diet in mice19. Obesity is a well-characterized risk factor for MASLD20. MASLD is associated with features of metabolic syndrome, including dyslipidemia and insulin resistance, making it easy to induce liver damage21. Therefore, reliable biomarkers of liver damage, such as ALT, AST, and TG were measured in this study. PRE treatment significantly reduced the levels of these indicators, suggesting that PRE alleviates metabolic diseases induced by a high fat consumption. Additionally, PRE treatment reduced serum hormone levels, such as insulin and leptin, during exposure to high fat contents. These hormones are important factors in obesity management and affect metabolic homeostasis22.
MASLD characteristic features include steatosis, inflammation, hepatocellular ballooning, and fibrosis23. Our histological staining results showed that PRE decreased lipid accumulation and steatosis in the liver tissues of mice subjected to a high-fat diet. Prebiotics, probiotics, and synbiotics improve intestinal permeability and reduce endotoxemia, which is a critical factor in gut-liver dysfunction24. Studies showed that prebiotics increase Bifidobacterium spp., enhancing gut barrier function and reducing endotoxemia in high-fat diet mice25,26.
In the present study, the administration of PRE during a high-fat diet regimen affected the lipid pathway within the liver. High fat contents significantly increased the expression of SREBP1, ChREBP, ACC, FAS, G6PD, and CEBPα. SREBP1 and ChREBP play important roles in the development of fatty liver disease27,28. SREBP1 is a major transcriptional regulator of fatty acid and TG synthesis in response to insulin. ChREBP is activated by high glucose levels and plays an important role in the process and regulation of fat synthesis, which is unrelated to insulin29. Furthermore, FAS and ACC are important rate-limiting enzymes in fatty acid synthesis30. Enzymes that generate NADPH, such as G6PD, are abundantly expressed in adipose tissue and positively associated with the lipid synthesis activity of adipocytes31. Furthermore, C/EBPα is mainly found in tissues involved in energy metabolism, including the liver and intestinal epithelium. The increased expression of CEBPα is associated with adipocyte hypertrophy, impaired insulin signaling, and decreased glucose utilization32,33. However, treatment with PRE can significantly reverse lipid metabolism changes and reduce hepatic fat accumulation, improving liver damage caused by high fat consumption.
A high-fat diet can enhance LPS absorption by regulating the composition of the gut microbiota. In addition, it can affect mucosal integrity, potentially leading to metabolic endotoxemia34. In recent studies, high-fat administration reduced the abundance of Mediterraneibacter and increased that of Harryflintia and Phocaeicola35,36,37. Ligilactobacilli can alleviate liver damage by producing SCFAs such as butyric acid, acetic acid, and propionic acid and regulating hepatic lipid metabolism38. Moreover, the relative abundance of Enterococci is significantly upregulated in obese children with MASLD, indicating a positive correlation between Enterococcus and the MASLD phenotype39. In this study, high fat consumption reduced Ligilactobacillus and Mediterraneibacter and increased Enterococcus, Harryflintia, and Phocaeicola abundance. Although a decrease in endotoxin levels and an improvement in metabolic parameters were observed, further studies are needed to elucidate the direct causal relationship between the modulation of metabolic endotoxemia and the improvement of MASLD. However, PRE improved the composition of intestinal microorganisms and enhanced the expression of epithelial barrier integrity-related proteins such as ZO-1. The intestinal microbiota and intestinal-derived metabolites, especially tryptophan derivatives, regulate metabolic and immune functions related to health and disease. Indolepropionic acid (IPA), a tryptophan derivative, indicated the onset and development of metabolic disorders such as type 2 diabetes and MASLD in a previous study40. Consistent with this finding, our results showed a positive correlation between metabolic disorder mediators and IPA. This highlights the importance of effective management of indole propionic acid distribution, particularly in MASLD alleviation.
This study highlights PRE as a dietary supplement to improve metabolic health and alleviate MASLD. PRE demonstrated benefits by modulating gut microbiota, enhancing gut barrier integrity, and reducing liver damage caused by high-fat diets. It promoted the growth of beneficial probiotics like Lactiplantibacilli and Bifidobacteria and reduced the overexpression of lipid metabolism-related proteins in the liver. However, the identified bacteria represent a small fraction of the gut microbiota, necessitating further research to clarify their roles. Additionally, human trials are needed to confirm the gut-liver axis mechanism linked to PRE intake. These findings establish a foundation for using PRE to prevent and manage MASLD by supporting gut-liver health.
Methods
Preparation of PRE
Fresh parsnip roots were purchased from a local market in Yecheon (Gyeongsangbuk-do, Korea). The parsnip roots were sliced to 20-mm sections and dried in an oven for 24–48 h at 50 °C. They were then pulverized to a size of ≤2.0 mm using a grinder. Water equivalent to 20 times the volume of 5 g of the dried sample was added. Reflux extraction was carried out at 80 °C for 3 h to obtain a hot water extract. After filtration and concentration, the final yield of the extract was approximately 38.5% of the dry weight of parsnip roots. The liquid extract was filtered through a Whatman No. 41 filter and concentrated using a vacuum rotary evaporator (R-114; Buchi Labortechnik, Flawil, Switzerland). The parsnip extract obtained through this process was referred to as a PRE.
HPLC analytical method conditions
The furanocoumarins bergapten and xanthotoxin, which are known parsnip components, were purchased from ChemFaces (Wuhan, China). These compounds were selected as marker compounds to standardize the PRE, ensuring reproducibility of the extract’s quality control. The analytical methodology was performed with the utilization of a high-performance liquid chromatography (HPLC) system, Waters Alliance 2695 separation module (Waters Corp., Milford, MA, USA) equipped with a 1515 quaternary pump and a 2996 photodiode array detector (PAD). The separation was performed on a Waters XBridge BEH C18 column (150 × 4.6 mm, 3.5 μm) at a temperature of 35 °C. The mobile phase comprised 0.1% formic acid (Merck, Darmstadt, Germany) in water (A) and 0.1% formic acid in acetonitrile (B). The flow rate was 1.0 mL/min, and the detection wavelength was set at 310 nm according to the following linear gradient: 0–5 min, 30–30% B; 5–15 min, 30–35% B. The injection volume was 5 mL. The PRE was dissolved in 50% ethanol (30 mg/mL), and the ethanol solution was filtered through a 0.2-μm PTFE syringe filter. Furanocoumarin content was then analyzed using HPLC. The standard stock solutions of two marker components (bergapten, and xanthotoxin) were prepared by dissolving these components at a concentration of 1 mg/mL. Each of the six working standard solutions was made by diluting the standard solution with 50% ethanol.
Culture, viability, carbohydrate content, and MUC-2 levels of LS 174 T cells
The human colorectal adenocarcinoma cell line LS 174 T was obtained from the American Type Culture Collection (Manassas, VA, USA). LS 174 T cells were cultured at 37 °C in 5% CO2 in minimum essential medium (Gibco, Logan, UT, USA) supplemented with 10% fetal bovine serum (Hyclone, Logan, UT, USA), 1% penicillin-streptomycin, and 1% glutamine. The cells were seeded in 96-well plates at a density of 5 × 10⁴ cells per well for 24 h, followed by treatment with different concentrations (10, 50, 100, 200, 500, and 1000 μg/mL) of PRE in the medium at 37 °C for another 24 h. Cell viability was assessed using the Cell Counting Kit-8 test (Dojindo, Tokyo, Japan) according to the manufacturer’s instructions. Absorbance was then measured at 450 nm. Carbohydrate content in the culture medium was measured using the phenol-sulfuric acid assay. Absorbance was measured at 490 nm, and total carbohydrate levels were calculated using a glucose standard curve. Muc2 levels were quantified using an ELISA kit (#88686, Cell Signaling Technology) according to the manufacturer’s instructions. Absorbance was measured at 450 nm, and results were normalized to total protein content.
Prebiotic activity assay
The prebiotic activity score was measured to evaluate the efficacy of parsnip extract (PRE) in promoting the growth of probiotic bacteria compared to glucose. Probiotic strains, including Lactobacillus delbrueckii subsp. bulgaricus MG5167, Lactobacillus gasseri MG4247, Bifidobacterium longum KCTC3421, and Bifidobacterium bifidum KCTC3440, were tested. Additionally, Escherichia coli KCTC2441 was included as a representative enteric strain to assess the selective growth-promoting effect of PRE. The log CFU values before and after incubation were used to calculate growth for each strain.
Lactobacillus strains were cultured using MRS agar, which was incubated at pH 6.5 ± 0.2 and 37 °C for 24 h. The oxygen demand was facultatively anaerobic, and strains were preserved through lyophilization or freezing of cell suspensions. Bifidobacterium strains were grown in TSA agar, incubated at 37 °C for 48–72 h, and cultured under anaerobic conditions. The E. coli strain, which is an anaerobe, was cultured in TSA agar and incubated at 37 °C for 24 h.
The culture broth for the prebiotic activity score analysis used M9 minimal broth supplemented with 2 g/L glucose, 0.015 g/L CaCl2, and 0.5 g/L MgSO4.
The culture was performed by streaking colonies of each strain onto the corresponding solid agar, followed by incubation at 37 °C for 24–48 h and inoculation into 10 mL of liquid broth for a second incubation at 37 °C for 24–48 h. The M9 broth was mixed with 5% (v/v) of the bacterial culture and 5 mg/ml of glucose or parsnip treatment (1 and 5 mg/ml). Absorbance was measured at 600 nm using a microplate reader immediately (0 h) and 24–48 h later. The obtained values were substituted into the equation below to obtain the prebiotic activity score:
Inulin (5 mg/ml), a prebiotic reported to improve the gut flora, was used as a positive control.
The pH change of the broth before and after incubation was measured twice using a pH meter (Orion star A211; Thermo Fisher Scientific, Waltham, MA, USA), and the average value was used.
Establishment of the mouse model
Seven-week-old male C57BL/6 N mice (G-bio, Gwangju, Republic of Korea) were kept under controlled conditions (60 ± 5% humidity, 12 h light/dark cycle, and 23 ± 2 °C temperature), provided sterilized water, and fed the AIN-93G diet (Dyets, Bethlehem, PA, USA). All animal experiments were reviewed and approved by the Institutional Animal Care and Use Committee of the Korea Food Research Institute (approval number: KFRI-M-23035).
After one week of acclimation, mice were separated into five groups: ND, Ain-93G diet; HF, 60% kcal fat diet; GG, HF with Garcinia gummi–gutta (GG, ES Food, Gunpo, Republic of Korea) 50 mg/kg mouse; PRE 50, HF with PRE 50 mg/kg; and PRE 100, HF with PRE 100 mg/kg. GG was selected as a positive control due to its documented ability to improve lipid metabolism and liver health through hydroxycitric acid (HCA), a compound known to inhibit de novo lipogenesis. PRE and GG were dissolved in sterilized water and administrated orally daily. Food intake and body weight were recorded weekly for eight weeks. At the end of the treatment period, 12-h fasted mice were anesthetized through exposure to isoflurane, and blood was collected into microfuge tubes. The serum was separated through centrifugation and frozen at −80 °C. Finally, body composition scans were performed (Medikors Inc., Seongnam, Republic of Korea).
Oral glucose tolerance test (OGTT) and intestinal permeability
Mice were fasted for 12 h and orally administered a glucose solution (2 g/kg body weight) at Week 8. Blood glucose levels in the tail were measured at 0, 30, 60, 90, and 120 min post-administration using a glucometer (AccuChek; Roche Diagnostics, Indianapolis, IN, USA). Similarly, the intestinal permeability of the mice was evaluated at eight weeks using fluorescein isothiocyanate (FITC)-dextran. The mice were fasted for 6 h before 500 mg/kg of FITC-dextran was administered orally. Blood samples were collected from the tail vein at 2 and 5 h after administration, and plasma was separated using centrifugation. The fluorescence of FITC-dextran was quantified using a microplate reader (Molecular Devices) with excitation and emission wavelengths of 485 and 535 nm, respectively. The concentration of FITC-dextran was determined by constructing standard curves using untreated plasma samples.
Blood biochemical analysis
Serum alanine aminotransferase (ALT) and aspartate aminotransferase (AST), total cholesterol, triglyceride, high-density lipoprotein (HDL)-cholesterol, low-density lipoprotein (LDL)-cholesterol, endotoxin, and insulin levels were measured. Moreover, liver triglyceride (TG) and lipid peroxidation (MDA) were measured. The liver TG and MDA levels were estimated using ELISA kits from Abcam (Cambridge, MA, USA) whereas the triglyceride levels were estimated using a kit from Cayman (Ann Arbor, MI, USA). Serum ALT; AST; and total, HDL-, and LDL-cholesterol levels were estimated using biochemical analysis equipment (AU-480, Beckman) from KP &T. Furthermore, insulin and endotoxin levels were estimated using ELISA kits from Thermo Fisher Scientific (Mouse Insulin ELISA kit, #EMINS; and PierceTM Chromogenic Endotoxin kit, #A39552). All data were quantified according to the manufacturers’ instructions, and the homeostasis model determination of insulin resistance (HOMA-IR) index was calculated as shown below:
Western blotting
Lysis buffer (PRO-PREP, iNtRON Biotechnology, Seongnam, Republic of Korea) was used to extract total protein from the liver and colon tissues of mice. Proteins were separated using sodium dodecyl sulfate-polyacrylamide gel electrophoresis (SDS-PAGE) gels. The gels were then transferred onto PVDF membranes, blocked with 5% skim milk, and incubated with primary antibodies from Cell Signaling Technology [Dnavers, MA, USA; Carbohydrate-responsive element-binding protein (ChREBP, #58069), CCAAT/enhancer binding protein α (CEBPα, #8178), and glucose-6-phosphate dehydrogenase (G6PD, #12263), and β-actin (#4967)] and Abcam [Cambridge, UK; sterol regulatory element-binding transcription factor 1 (SREBP1, #ab28481), acetyl-CoA carboxylases (ACC, #ab45174), fatty acid synthetase (FAS, #ab22759), and Zonula Occludens-1 (ZO-1, #ab214228)] overnight at 4 °C. Next, the membranes were incubated with secondary antibodies. Bands were subsequently quantified using Image Lab Software (Bio-Rad) and an EZ Western Lumi Femto Kit (DoGenBio Co. Ltd., Seoul, Republic of Korea). Finally, chemiluminescence was detected using a ChemiDoc XRS+ imaging system.
Histological analysis
Histological analysis was performed using hematoxylin and eosin (H&E) and Oil red O (ORO) staining. Frozen liver tissue slices were stained with H&E to measure liver damage and adipocyte size, as well as ORO to assess hepatic steatosis. All sections were scanned with CaseViewer software (3DHISTECH Ltd.) at 20 × magnification. The ORO-stained area of the liver tissues was also quantified using Image J software (NIH, Bethesda, MD, USA). The H&E staining data in liver tissues were used to evaluate histological features such as steatosis and inflammation. The MASLD activity score was calculated as the sum of the individual scores for steatosis, lobular inflammation, and hepatocellular ballooning. The scoring criteria for each component are detailed in Table 2, and the calculation formula is as follows:
The total score ranges from 0 to 8, with higher scores indicating more severe liver damage.
Gut microbiota analysis
At Week 8, fresh fecal samples were collected and stored at −80 °C until use. Fecal DNA was isolated utilizing a DNeasy PowerSoil kit (12888-50; QIAGEN, Hilden, Germany), and the hypervariable V3–V4 region of 16S rRNA amplicons was synthesized using a MiSeq system (Illumina, San Diego, CA, USA) from Macrogen (Seoul, Korea) according to the manufacturer’s instructions to examine the composition of the gut microbiota. FLASH was used to construct paired-end readings, whereas the QIIME 2 program was used for microbial community analysis using unweighted UniFrac distance matrices41.
Quantification of fecal metabolites
Fecal samples were measured in 50 mg aliquots before they were extracted with 980 μL of 50% MeOH and 20 μL of the internal standard. Centrifugation was performed at 10,000 × g for 10 min at 4 °C, identical to the conditions used for serum preparation. The supernatants were subsequently filtered using a PTFE filter before analysis. Spectrometry was then conducted as previously described42.
Statistical analysis
Data are expressed as the mean ± standard error. All analyses were performed using SPSS version 20.0 (IBM Corp., Armonk, NY, USA) and one-way analysis of variance with Duncan’s multiple range test. P < 0.05 was considered statistically significant. Finally, correlation analysis was conducted using Pearson’s correlation in R Studio (version 2023.12.1 + 402) and visualized using the corrplot package (version 0.92).
Responses