Prodromal Parkinson’s disease and subsequent risk of Parkinson’s disease and mortality
Introduction
According to the last Global Burden of Disease Study, Parkinson’s disease (PD) has been recognized as one of the fastest-growing conditions in terms of prevalence, disability, and deaths among all neurological disorders1. Notably, PD is a disease with insidious onset and slow progression2,3. In this prodromal phase, prodromal features can be used to identify individuals who are likely to develop PD, as in the updated International Parkinson and Movement Disorder Society research criteria for prodromal PD4. Features of the prodromal phase include rapid eye movement sleep behavior disorder (RBD), autonomic dysfunction, depression, olfactory loss, mild motor signs, and pathological imaging markers of the presynaptic dopaminergic system and the cardiac sympathetic system1,4,5,6,7. These features have predictive value for clinical PD, although their specificity varies considerably8. However, the association of prodromal PD features with the risk of developing PD and risk of mortality remains to be studied in large-scale prospective studies.
Therefore, the present study prospectively investigated whether prodromal PD features (1–2 and 3+ features vs. 0 features) predicted subsequent risk of PD among over 500,000 adults without PD at the baseline and the risk of mortality among 3415 participants with newly diagnosed PD.
Methods
Study population
The current study utilized data from the UK Biobank, a population-based prospective cohort study, which started from Mar 2006 to Dec 2010 with over half a million participants (40–69 years)9,10,11. Participants attended one of 22 assessment centers across England, Wales, and Scotland, where they provided information on their socioeconomic characteristics, lifestyle, and health characteristics via a self-completed touch-screen questionnaire and a computer-assisted personal interview. Trained research staff assessed their physical measurements and obtained blood samples.
A total of 501,475 participants were included in the current analysis after excluding individuals with diagnosed PD at baseline. Among participants who were newly diagnosed with clinical PD during follow-up until October 31, 2022 (England), February 28, 2018 (Wales), and July 31, 2021 (Scotland), we further investigated the association between the number of prodromal PD features, before and after PD diagnosis, separately, and mortality.
Standard protocol approvals, registrations, and patient consents
The UK Biobank obtained ethical approvals from the National Information Governance Board for Health and Social Care and the National Health Service North West Multicenter Research Ethics Committee (MREC, https://www.ukbiobank.ac.uk/learn-more-about-uk-biobank/about-us/ethics)12. All participants provided signed informed consent. Further details regarding the UK Biobank have been elaborated in prior publications10.
Ascertainment of prodromal PD features
Eight major prodromal features were included in the exposure assessment: depression, rapid eye movement sleep behavior disorder (RBD), urinary incontinence, erectile dysfunction (ED, measured in men only), constipation, anxiety, orthostatic hypotension, and hyposmia13. These features were determined by combining coded data from multiple sources, including the International Classification of Diseases (ICD)–9 codes, ICD–10 codes, primary care data collection, and self-reported medical conditions (Supplemental Table 1). Each prodromal feature was scored one point if present. The primary exposure was the combination of all eight features and further categorized as 0 (reference), 1–2, and 3+ features.
Ascertainment of PD morbidity and mortality
Incident PD cases were identified using the algorithm method developed by the UK Biobank, with a positive predictive value of 91%14. Specifically, PD status and diagnosis date was identified by matching the corresponding International Classification of Diseases (ICD)–9 codes (“332.0” from Fields 41271) and ICD–10 codes (“G20” from Fields 41270) from hospital inpatient data. Self-reported PD cases were also included, as indicated by code “1262” in data field 20002. Death register data documented (Fields 40001–40002) was further linked to provide a comprehensive record of PD cases. If two or more different diagnosis dates were recorded for the same disease, the earliest one was used as the primary diagnosis date.
The date and causes of death were extracted from death certificates, which were maintained by the National Health Service Information Centre in England and Wales and the National Health Service Central Register Scotland in Scotland. Detailed methodology for data linkage is described and can be accessed via the provided online resource (https://content.digital.nhs.uk/services).
Assessment of covariates
The following baseline characteristics were included as covariates: sociodemographic factors such as age, sex, educational levels, race, and Townsend deprivation index (quintiles); lifestyle factors including smoking status, alcohol frequency, physical activity, and overall sleep quality; health conditions including body mass index (BMI), any history of chronic diseases (hypertension, dyslipidemia, or diabetes), and cancer; and standard polygenic risk score (PRS) for PD.
Data on age, sex, race, educational levels, socioeconomic status, smoking status, alcohol frequency, and physical activity were acquired through a touchscreen questionnaire. Educational levels were categorized as university or college degree, levels or equivalent, O-levels or equivalent, or none of the above. Socioeconomic status was assessed by collecting the Townsend deprivation index, which is a composite measure of area-level socio-economic deprivation, with higher scores indicating a greater degree of deprivation15. Smoking status was self-reported as current, past, or never smoker. Alcohol frequency was derived from the question “About how often do you drink alcohol?” and categorized as never, daily or almost daily, 3–4 times a week, 1–2 times a week, or less than one time a week. Regular physical activity was defined as at least 150 min/week of moderate activity or 75 min/week of vigorous activity (or an equivalent combination)16. Details regarding overall sleep quality have been published previously17. Information on height and weight was collected during physical measurements by nurses. BMI (kg/m2) was calculated as weight in kilograms divided by height in meters squared. Following the World Health Organization (WHO) criteria, BMI was classified into underweight/normal (<25 kg/m2), overweight (25.0–29.9 kg/m2), and obese (≥30.0 kg/m2)18. Medical histories of hypertension, dyslipidemia, diabetes, and cancer were collated from primary care records, hospital admission, and self-reports. To estimate genetic predisposition, PRS for PD was extracted from Standard PRS from the UK Biobank PRS Release (Category 301), which was further categorized into tertiles.
Statistical analysis
Baseline characteristics were described and compared according to participants with different prodromal PD features. Continuous variables were presented as means and standard deviations (SD) and categorical variables were presented as numbers (proportions). Significant differences across different numbers of prodromal PD features were compared using one way analysis of variance for continuous variables and chi-square test for categorical variables.
In the primary analyses, we used multivariable Cox proportional hazards regression models to compute hazard ratios (HRs) and 95% confidence intervals (CIs) for the association between the number of prodromal PD features (1–2 and 3+ features vs. 0 features) and risk of developing PD. Sex-specific HRs were calculated first because the estimation of ED being estimated in men. We further calculated pooled HRs using a random-effects model. In Model 1, we adjusted for age (continuous, years), sex (men or women), PRS for PD (tertiles). In Model 2, race (White British or Non-white British), education level (high [college or university degree], intermediate [A/AS levels or equivalent, O levels/GCSEs or equivalent], or low [none of the aforementioned]), Townsend deprivation index (quintiles), smoking status (current, past, or never), alcohol frequency (never, daily or almost daily, 3–4 times a week, 1–2 times a week, or less than one time a week), have physical activity (yes or no), BMI (<25.0, 25–29.9, or ≥ 30 kg/m2), and sleep score (healthy sleep pattern, intermediate sleep pattern, or poor sleep pattern) were further adjusted. Model 3 (fully adjusted model) added adjustment for chronic disease (yes or no), and cancer (yes or no). We further examined the association of prodromal PD features with short (≤6 years) vs. long-term (>6 years) PD risk. In the secondary analysis, we evaluated the associations for individual prodromal features and the risk of developing PD. Furthermore, we tested for potential interactions between prodromal PD and age (continuous), smoking status (never or current/past), alcohol frequency (≤1–2 times a week or ≥3-4 times a week), BMI (continuous), physical activity (no or yes), type 2 diabetes (no or yes), pesticides (no or yes), and family history (no or yes) in relation to PD risk, using likelihood ratio tests.
We also assessed the associations of the number of prodromal PD features (1–2 and 3+ features vs. 0 features) with the risk of mortality and risk of dementia among participants with newly diagnosed PD during follow-up. Moreover, we investigated the associations for individual prodromal features and risk of all-cause mortality. The adjustment was the same as the primary analysis. Person-year was calculated from the date of PD diagnosis until the date of death or the end of follow-up.
To consider that prodromal PD features may have unequal effects on PD, we recalculated a weighted standardized prodromal PD score based on the HR of each prodromal PD feature in the multivariable Cox proportional hazards regression model. To reduce the impact of misclassification of PD assessment, the participants who only self-reported PD history were excluded in a sensitivity analysis. We also restricted our analyses to participants without cancer at baseline because cancer has been shown to be associated with lower PD risks19. We further included medications for pain relief, a surrogate for pain symptom, as a prodromal PD feature20. Additionally, we included the use of medications including the use of antidepressants, anxiolytics, and medications for constipation to assess prodromal PD features. Considering the possibility that participants who presented prodromal symptoms before PD diagnosis already had PD, we conducted further sensitivity analysis by excluding participants with prodromal PD features who were diagnosed with PD within 2 years. In addition, we used urinary dysfunction including urinary incontinence and urinary retention as prodromal PD features. Furthermore, we adopted anxiety with depression instead of anxiety and depression as separate prodromal PD features. Two-sided P-value < 0.05 was considered as statistical significance. All statistical analyses were performed in SAS, version 9.4 (SAS Institute).
Results
Among the 501,475 participants included in the present analysis (mean age of 56.5 ± 8.10 years), 45.6% were men, and most of them were White British (88.4%). At enrollment, 370,057 (73.8%) participants had no prodromal features, 121,257 (24.2%) participants had 1–2 prodromal features, and 10,161 (2.03%) participants had 3+ prodromal features (Table 1). Compared with participants with 0 prodromal features, participants with prodromal features were more likely to be women, older age, had lower educational levels, and had lower socioeconomic status. Additionally, the participants were more likely to be current smokers, be overweight or obese, and had poorer sleep pattern. Moreover, those with 3+ prodromal features showed a higher prevalence of preexisting hypertension, diabetes, and high cholesterol, compared to those without any prodromal features.
During a median of 13.6 years of follow-up, 3,415 incident PD events were documented. The combined prodromal PD features were associated with a higher risk of developing PD in a dose-response relationship (P-trend < 0.001). Compared with participants without prodromal features, the multivariable-adjusted HRs (95% CIs), comparing two extreme categories of PD prodromal features, were 3.12 (2.58, 3.78) for men and 2.71 (2.11, 3.47) for women (Table 2). When examining individual prodromal PD features, we found each feature was associated with developing PD (P < 0.05 for both, Fig. 1, Supplemental Table 2).
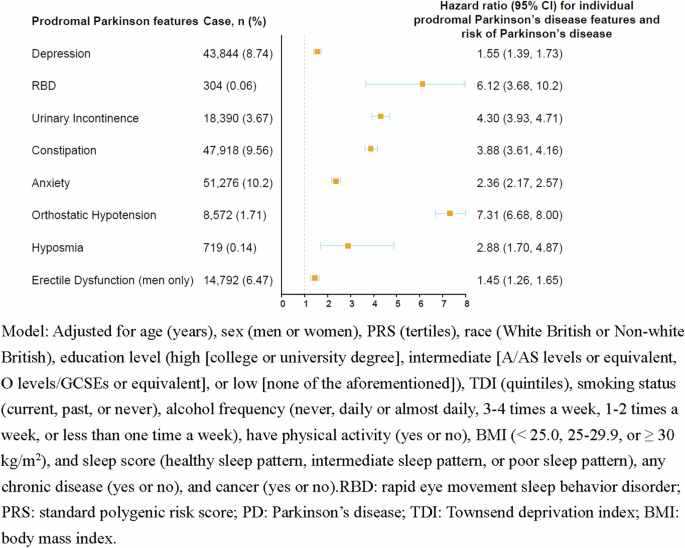
Association between the individual prodromal Parkinson’s disease features and risk of Parkinson’s disease (n = 501,475).
Prodromal PD features predicted only PD onset occurred during the first 6 years of follow-up (adjusted HR for 3+ vs. 0 prodromal features = 10.5; 95% CI: 8.60, 12.9), but not for long-term PD (adjusted HR for 3+ vs. 0 prodromal features = 1.00; 95% CI: 0.76, 1.32) (Fig. 2). In the stratified analyses, no significant effect modifications were detected for age, smoking status, alcohol frequency, BMI, physical activity, type 2 diabetes, pesticides, and family history (Supplemental Table 3).
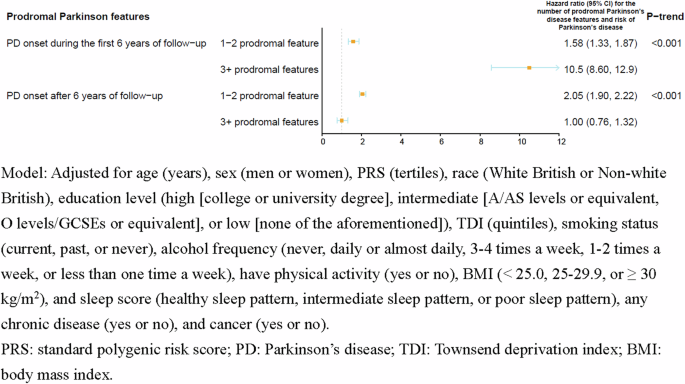
Association between the number of prodromal Parkinson’s disease features and risk of Parkinson’s disease in fully adjusted models in short (≤6 years) vs. long-term (>6 years) PD risk (n = 501,475).
Prodromal PD features were associated with a higher risk of all-cause mortality among participants with PD (Table 3). The associations were similar for those with prodromal PD features occurred before and after PD diagnosis (Table 3). However, after excluding participants with prodromal PD features who were diagnosed with PD within 2 years, non-significant associations were observed between the number of prodromal PD features and risk of all-cause mortality (Table 3). When examining individual prodromal PD features, we found urinary incontinence and constipation were associated with developing PD (P < 0.05 for both, Supplemental Table 4). When we investigated the association between the number of PD features and the risk of dementia, we found that prodromal PD features were associated with a higher risk of dementia (Supplementary Table 5). Multivariable-adjusted HRs3+vs.0 prodromal PD features and 95%CIs were 2.25 (1.39, 3.67) for prodromal PD features occurred before PD and 8.85 (5.44, 14.4) for prodromal PD features occurred after PD (Supplementary Table 5). After excluding participants with prodromal PD features who were diagnosed with PD within 2 years, we did not find the significant associations between prodromal PD features and risk of dementia (Supplementary Table 5).
Using the weighted standardized prodromal PD score, the association between the weighted standardized prodromal PD score and the risk of PD was similar (Supplemental Table 6). Our results remained similar when we excluded 40 participants with only self-reported PD (Supplemental Table 7), restricted our analyses to participants without cancer at baseline (n = 477,570, Supplemental Table 8), or including medications for pain relief as a prodromal PD feature (Supplementary Table 9). This association remained similar after further including the use of medications to assess prodromal PD features (Supplementary Table 10), using urinary dysfunction (Supplemental Table 11), or adopting anxiety with depression (Supplemental Table 12).
Discussion
In this large-scale prospective cohort of over 500,000 adults, we found that both individual and combined prodromal PD features were associated with a higher likelihood of developing PD. In addition, individuals with prodromal PD features had a higher risk of subsequent all-cause mortality compared to those without the features, regardless of the timing of onset of prodromal PD features and PD diagnosis.
Population-based studies from various world regions have indicated that prodromal PD features, such as ED, depression, anxiety, constipation, and RBD were associated with a higher risk of developing PD21,22,23,24,25,26,27. In our previous study based on the Health Professionals Follow-up Study, which included 32,616 men free of PD at baseline, participants reported their erectile function. We found that participants with ED were 3.8 times more likely to develop PD during the 16 years of follow-up compared to those who reported to have very good erectile function (HR = 3.8, 95% CI: 2.4–6.0)28. A case-control study involving 8166 PD and 46,755 individuals without PD from the Health Improvement Network UK primary care database showed that participants with PD had a higher incidence of constipation compared with controls (RR = 2.24, 95% CI: 2.04–2.46), hypotension (RR = 3.23, 95% CI: 1.85–5.52), ED (RR = 1.30, 95% CI: 1.11–1.51), urinary dysfunction (RR = 1.96, 95% CI: 1.34–2.80), depression (RR = 1.76, 95% CI: 1.41–2.17), and anxiety (RR = 1.41, 95% CI: 1.09–1.79)29. Despite the field of prodromal PD has expanded dramatically over the past decade, further investigation in large-scale prospective studies is warranted. Our study identified depression, RBD, urinary incontinence, constipation, anxiety, orthostatic hypotension, hyposmia, and ED as individual risk factors for developing PD, with estimates ranging from 1.55–7.31. Of note, most prodromal PD features may not only be specific to PD but could also be other extracerebral systems29. Our study, utilizing a combination of these prodromal features, extended and refined the evidence of the predictive role in developing PD.
The lead times, that is the period between the appearance of a feature and conversion to clinical PD, vary greatly across different prodromal features, range from 5 years for impaired motor performance to >20 years for autonomic symptoms and RBD1,30,31,32,33. In the current study, prodromal PD features were associated with higher risk of PD which occurred during the first 6 years, suggesting that these prodromal features could precede the typical clinical manifestations by several years. Taken together, identifying potential temporal window of PD is critical for understanding disease pathology and developing preventative strategies.
The relationship between prodromal PD features and PD-related mortality has been less well studied. A proof-of-concept study using data from electronic health records of participants with PD (n = 2522) and showed that psychosis/hallucinations (HR = 1.71, 95% CI: 1.46–1.99), cognitive impairment (HR = 1.23, 95% CI: 1.05–1.43), constipation (HR = 1.34, 95% CI: 1.15–1.56), and pain (HR = 1.34, 95% CI: 1.12–1.60) identified within 3 years before the PD diagnosis were associated with worse survival for PD patients34. In the current study, our initial observations were in line with these findings, suggesting that individuals with prodromal PD features (either before or after PD diagnosis) were found to have a higher risk of subsequent all-cause mortality compared to those without features. Regarding the associations between prodromal PD features and the risk of dementia, we found that having prodromal PD was associated with a higher probability of developing dementia among participants with PD, especially for prodromal PD features that occurred after PD. However, in the 2-year lag analysis, we did not find the significant associations of prodromal PD features with the risk of mortality or dementia. This could be partially explained by the difficulty in determining the exact timing of PD diagnosis because some participants with prodromal features before PD diagnosis already had PD. Therefore, whether prodromal PD features prior to PD onset could predict PD progression warrants further studies. Taken together, we illustrated evidence that participants with newly diagnosed PD prodromal PD features may be screened for these features not only before but especially after diagnosis of PD to reduce the risk of all-cause mortality and dementia.
The strengths of this study include its prospective study design, large sample size, long-term follow-up, and meticulous adjustment for a wide range of potential confounding factors. However, several potential limitations need to be addressed. First, given the challenges in diagnosing new PD cases during hospital admissions, accurately determining the exact timing of PD diagnosis can be difficult. Nevertheless, we used a combined criterion of ICD–9 and ICD–10 codes, death registry data, and self-reported information to categorize the PD status and to capture the date of PD diagnosis. If multiple diagnosis dates were recorded for the same disease, the earliest one was used as the primary diagnosis date. Second, although we included eight out of twelve key prodromal PD features with clinical diagnoses, other prodromal PD features such as dopaminergic PET/SPECT clearly abnormal, subthreshold parkinsonism (UPDRS-III > 3 excluding action tremor or MDS-UPDRS-III > 6 excluding postural and action tremor) or abnormal quantitative motor testing, excessive daytime somnolence, and global cognitive deficit were not included. Because these features were neither available nor clinical diagnoses and were only assessed in a sub-cohort of the UK Biobank. Third, although the UKB collected accelerometry data during the follow-up period (June 2013 to January 2016), we did not use this data to evaluate prodromal motor symptoms due to the limited sample size and relatively short follow-up period. Moreover, the current study did not classify the type of PD, we thus, could not fully evaluate the association between prodromal PD features and different types PD. In addition, participants the UK Biobank were relatively healthy and affluent, predominantly of White ethnicity, and thus the generalization of the current findings was of concern. Finally, although a wide range of confounding factors has been adjusted, residual and unmeasured confounding cannot be fully controlled.
In conclusion, the accuracy of identification of prodromal clinical features is limited by the quality of the raw data and the methods used to extract it. Nevertheless, the signal from the prodromal features is strong enough to be detected in this large-scale prospective population sample. Screening and intervention for prodromal PD features are warranted for preventing PD and reducing mortality.
Responses