Profiling muscle transcriptome in mice exposed to microgravity using gene set enrichment analysis
Introduction
The ongoing endeavour of humankind to explore space and potentially inhabit other planets is gaining momentum, with both public and private entities actively planning for long-duration space missions. Ongoing projects aimed at manned missions to the Moon and Mars are immediate examples of this reality1,2. Over the past three decades, contemplative research on the impact of long-duration spaceflight on the overall physiology of the human body has greatly expanded and grown. A wealth of scientific knowledge and technologies emanating from this space mission-related research unveils the deleterious physiological impact of space radiations, stresses and microgravity conditions on overall human physiology as well as the possible countermeasures to mitigate them3. Additionally, these studies have benefitted significantly from the advancement of science and technology in diverse medical and industrial sectors on Earth4,5.
According to published peer-reviewed scientific literature, some of the most well-documented spaceflight-associated psychological and physiological health hazards to astronauts include visual impairment, cardiovascular deconditioning, cognitive dysfunction, significant change in body weight and deterioration of the musculoskeletal system6,7,8,9,10. NASA’s longest-duration human spaceflight study, conducted on identical twin astronauts during a 340-day mission, revealed a notable resilience in the majority of biological and human health variables, with many either remaining stable or returning to baseline11. This adaptive physiological stability was observed in most of the risk parameters measured in this comprehensive multi-dimensional study, including epigenetic and transcriptional data, gut microbiome composition, body weight, carotid artery dimensions, neuro-ocular changes, and as bone turnover markers. However, some other parameters measured such as genome integrity, immune response and attenuated cognitive functioning were significantly affected and exhibited persistent changes by the stress of the space mission11. Research indicates considerable variability among individuals as well as sex and gender specific differences with regards to the systemic and physiological impact of astronauts’ health during and post space missions3,12,13,14,15,16,17. However, rapid volumetric loss of skeletal muscle tissue or muscle atrophy is a common phenomenon observed among astronauts during both short-term and long-term spaceflights which leads to muscle weakness and diminished functional capacity upon return to a normal gravity condition18. Research studies aimed at tackling space flight associated muscle atrophy has resulted in the development of nutritional and exercise countermeasures19,20,21, but with little success. Hence, detailed molecular analysis are required to delineate the underlying physiological mechanisms that can support the development of interventions to prevent muscle atrophy which is an inevitable health hazard during space missions.
Muscle atrophy, a significant adaptation seen in astronauts during spaceflight, shares common molecular mechanisms, like altered growth factor signalling, proteolysis, oxidative stress, catabolism, and mitochondrial dysfunction, with conditions on Earth such as cachexia, spinal cord injuries, chronic degenerative diseases, and ageing, despite their different causes22,23,24,25,26. Space research studies using rodent models further substantiated the inevitable role played by molecular mechanisms, such as ubiquitination and autophagy, in mediating muscle atrophy phenotype27. Moreover, multi-omics data resources that are generated from space research studies provide an immense opportunity to delineate the therapeutically amenable biological mechanisms underlying muscle atrophy. GeneLab, is one such open access data resource, funded by NASA’s Division of Biological and Physical Sciences. This resource provides an integrated collection of diverse omics data generated from spaceflight and spaceflight-relevant biological experiments28. NASA’s goal of GeneLab is to provide a common, curated resource of molecular data to all researchers to enable meta-analysis across multiple datasets to draw new conclusions, enhancing the utility of each dataset’s original intent. Da Silveira WA et al. demonstrated how applying comprehensive analytical methods based on systems biology can leverage this data source to identify the fundamental molecular causes affecting multiple tissues exposed to space radiation and microgravity29. It also provides a platform to interrogate and study clinically established pathophysiological mechanisms underlying muscle atrophy identified from other research domains. A recent scientific report from Vitry G et al. is an excellent corroboration of this conception30.
A targeted approach was adopted in the current study for the gene-set enrichment and clustering based gene expression analysis. For this a reference gene set was generated which encompassed core cellular biological processes that have been linked to muscle atrophy phenotype across diverse disease conditions31. The primary goal was to create a transcriptomics based reference expression profile of major biological processes underlying muscle atrophy during space missions. Besides performing the role of a reference framework, the current study also provides insights into the importance of glycosylation post-translational modification in muscle atrophy, which is often overlooked due to limitations in pathway enrichment databases as well as data analysis methods. We hypothesize that the transcriptomics-based reference expression profile generated in this study will shed light on the significance of glycosylation post-translational modification as well as fundamental biological processes driving muscle atrophy during space missions. Additionally, we propose that our investigation will address a gap in current pathway enrichment databases and data analysis methodologies, thus contributing to a more comprehensive understanding of the molecular mechanisms involved in muscle atrophy.
Results
Nine transcriptomic datasets, originating from six mouse muscle samples as part of the NASA Rodent Research 1 (RR1) protocol available on NASA’s GeneLab public omics repository, displayed a significant representation of differentially expressed genes (DEGs) (adj. p-value ≤ 0.05). Data available from the Illumina HiSeq 4000 platform for multiple experiments (GLDS-99, GLDS-101, GLDS-103, GLDS-104, and GLDS-105), represented a comparable number of space flight and ground control samples. However, data from the Affymetrix Mouse Genome 430 A 2.0 Array platform (GLDS-111 and GLDS-135) exhibited variable sample numbers for space flight, ground, and vivarium samples. Moreover, in experiment GLDS-21, data from hindlimb suspension and reloading were included in addition to space flight, ground, and vivarium samples, all generated using the Affymetrix Mouse Genome 430 A Array platform (Supplementary Data 1). The expression pattern of housekeeping gene markers demonstrated reliability and consistency between the two technologies (Supplementary Data 2; Supplementary Fig. 1). Therefore, a combined analysis of the significant DEGs generated from the two technology platforms from these nine datasets were performed for subsequent gene expression analysis. Significant DEGs (adj. p-value ≤ 0.05) with either complete or partial gene annotation were identified from the matrix and were pooled for each muscle types for subsequent analysis (Supplementary Data 13).
Visualizing transcriptomic changes using jVenn Diagrams
Noteworthy among our findings is the remarkable differential expression observed in the Sol muscles of mice subjected to spaceflight, with 7099 genes which exhibited significant alterations, surpassing those in other muscle types. Given this extensive representation, a notable overlap of shared entities was also observed between Sol and EDL muscle (n = 912) and between Sol and LD muscle (n = 482) (Fig. 1). Interestingly, there were 4 DEGs that were found to be differentially regulated across all the muscle samples from mice exposed to microgravity condition (Fig. 2) which are involved in metal ion homeostasis (Tfrc and Mt2); cell proliferation (Cdkn1a) and regulation of DNA-binding transcription factor activity (Arid5b).
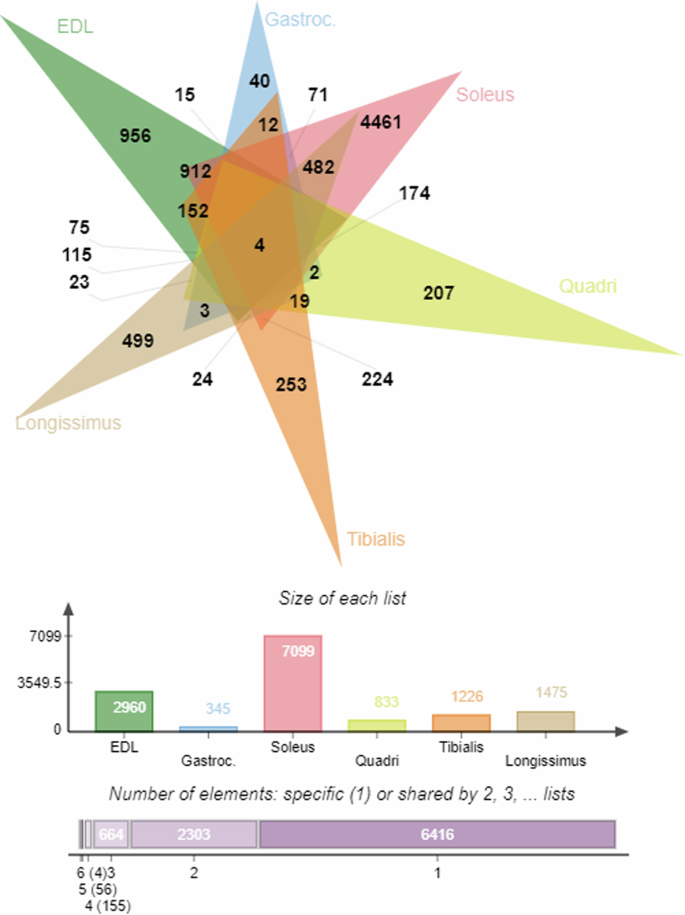
Numbers in bold represents the total number of DEGs belonging to individual muscle sample as well as the intersection between samples. The bar chart shows the total number of DEGs within each muscle samples used for the current analysis. (EDL- Extensor digitorum longus; Gastroc. – Gastrocnemius muscle; Soleus – Soleus muscle; Quadri – Quadriceps muscle; Tibialis – Tibialis anterior muscle; Longissimus – Longissimus dorsi muscle). Only genes with complete or partial gene annotation details were considered as input. All genes that satisfies the stringent statistical significance cut off value (adj. p-value ≤ 0.05) were pooled for each muscle type to generate the jVenn diagram.
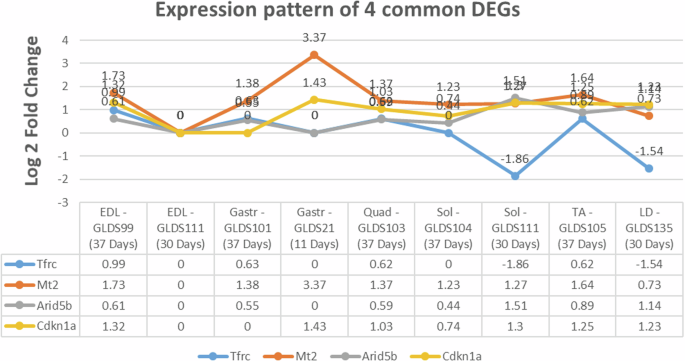
The table lists the datasets identified from NASA’s Genelab open science data repository that have been used for the gene expression analysis. The log 2 fold change values for each gene has been obtained from the processed expression matrix available from the Genelab repository, under respective accession numbers in Genelab data systems (GLDS). All genes satisfy the stringent statistical significance cut off value (adj. p-value ≤ 0.05). Positive and negative values indicate both up and down regulated genes in microgravity condition when compared to the respective ground controls (EDL Extensor digitorum longus; Gastr Gastrocnemius muscle, Sol Soleus muscle, Quad Quadriceps muscle, TA Tibialis anterior muscle, LD Longissimus dorsi muscle).
Clustering analysis
The results of hierarchical clustering analysis indicate that among the datasets, GLDS105 from the TA muscle samples and GLDS99 from the EDL tend to exhibit similar gene expression patterns after 37 days of exposure to the International Space Station. (Fig. 3). Individual enrichment analysis of these datasets revealed that Circadian rhythm, response to stress, response to cytokines and tissue development are some of the common cellular processes common between the two datasets (Supplementary Fig. 2a, b).
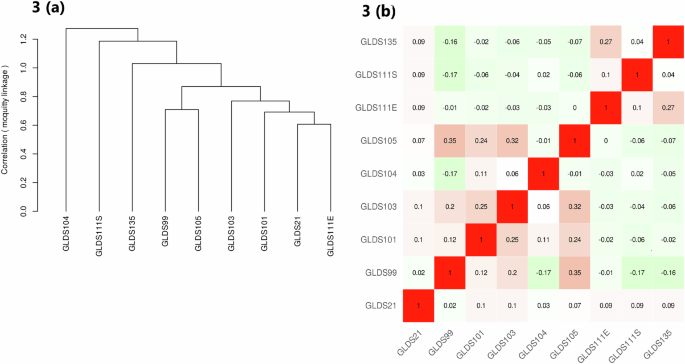
a The sample tree and (b) the correlation matrix view of the gene expression datasets obtained from the mice muscle samples in NASA’s GeneLab data systems. IDEPv0.96, the open-source web application, was used for hierarchical clustering by selecting the Pearson Correlation and the Mcquitty’s linkage method. The Z-score cut-off value was selected as 2 and “normalize genes and samples” options were selected in the application. The red colour denotes positive correlation and the green colour represents the negative correlation.
Bicluster analysis, performed to identify molecular signatures using the MosBi online web application, yielded 175 biclusters (Supplementary Figure 3). Molecular signatures of highly similar bicluster communities from this network were then identified. This was achieved by adjusting the thresholds for the minimum number of biclusters in a community and the minimum occurrence of a row and column element within those biclusters as 20 and 0.2 (20%) respectively. A consistent pattern of similar DEGs were identified to occur from community 1 during different test trials and were functionally enriched by the more specific biological processes of circadian rhythm and response to metals (Fig. 4 (Cluster 1; Supplementary Data 3). The increased expression pattern of Mt1 and Mt2 genes across multiple muscle types (Sol, Quad, TA, Gastr, LD and the EDL muscle samples), in context with the microgravity condition, demands special attention as it is a major regulator of cellular zinc ion homeostasis32. Increased expression of these proteins have been previously associated with human skeletal muscle atrophy and the gene silencing studies in rodent models showed a beneficial impact on increasing muscle size33. DEGs in community 2, were majorly represented by the expression pattern of either 3 out of 9 or 2 out of 9 datasets obtained from the LD, EDL and Sol muscle samples (Supplementary Data 4). Functional analysis revealed that the major biological processes were centred on muscle cell development and differentiation along with carbohydrate metabolic process, ion transport, membrane polarization, growth factor signalling, extracellular matrix interactions and immune response pathways (Fig. 4 (Cluster 3)). Similar expression pattern distribution were observed for the DEGs in community 3 with additional DEGs from the Quad muscle samples (Supplementary Data 5). Functional enrichment analysis revealed autophagy, apoptosis and protein catabolic processes as the major biological processes affected by the microgravity condition (Fig. 4 (Cluster 2)).
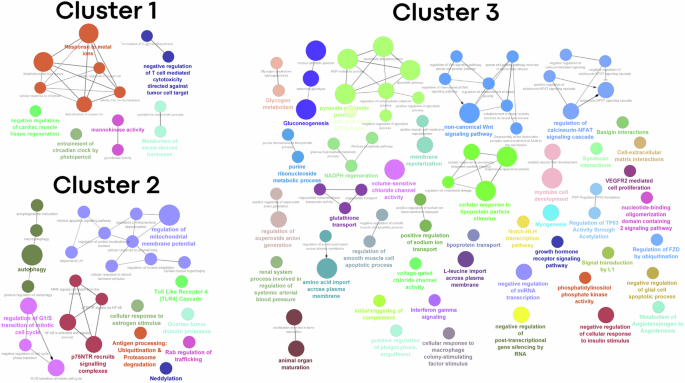
The functional enrichment was performed by using the ClueGO plugin application (version 2.5.9) available through the Cytoscape (version 3.9.0). Mus musculus species was used along with the GO-Biological Processes-EBI-UniProt-GOA-ACAP-ARAP-2502.2022 and REACTOME-Pathways-25.02.2022 ontologies for the enrichment processes. Network specificity was defined by selecting the GO Tree Intervals 3 and 10 for the minimum and maximum respectively. Based on the cluster size (number of DEGs), the GO Term/Pathway selection filters were adjusted by selecting the minimum number of gene size as 1, 4 and 3 and the percentage (%) coverage of genes with the associated terms as 5, 20 and 3 for the Clusters 1 (representing DEGs from molecular community 1), 2 (representing molecular community 3) and 3 (representing molecular community 2) respectively. The graph display was generated after applying a Network connectivity score of 0.4 and selecting the yFiles Organic layout. Only those pathways that satisfies the p-value cut-off ≤ 0.05 was used for the graph generation.
Knowledge-based gene-set analysis
Given the possibility of missing subtle gene expression signatures relevant to phenotypes by using standard clustering methods and annotation database-based enrichment analysis, we decided to perform an additional knowledge-based gene-set analysis. This analysis utilized muscle-specific biological markers identified from the NeuroMuscleDB34,35 SysMyo36, Gene table of Neuromuscular Disease37, and the candidate gene list reported by Raza SHA et al. 38 (Supplementary Data 6–10). By applying a filter criteria of maximum representation across the muscle samples (4 out of 9 datasets), in total 291 DEGs were identified from this muscle-specific biological markers. Interestingly the data obtained from the Sol, EDL and TA muscle samples were having the maximum number of gene representation, sharing about 173 genes common among them. (Fig. 5, Supplementary Data 11).
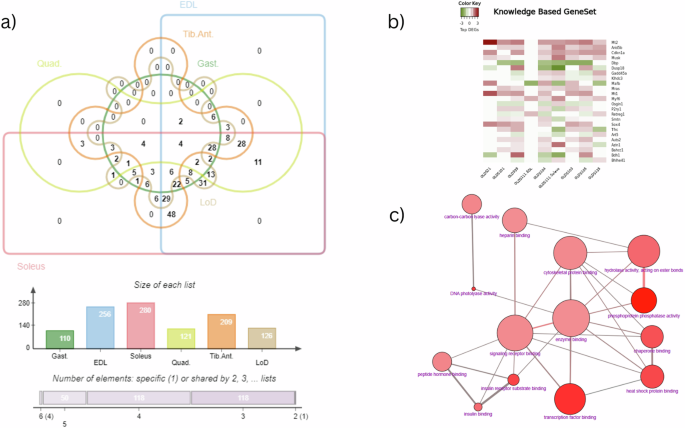
a Edward style Venn diagram representing the distribution of DEGs identified from the knowledge based gene-set enrichment analysis. Numbers in represents the total number of DEGs shared among the muscle samples exposed to microgravity conditions. The charts in the bottom of the diagram shows the list size as well as the size of the shared entities among the 6 muscle samples. (EDL extensor digitorum longus, Gast Gastrocnemius muscle, Soleus Soleus muscle, Quad Quadriceps muscle, Tib. Ant Tibialis anterior muscle, LoD Longissimus dorsi muscle). b Heatmap displaying the top 25 genes that are differentially expressed in most of the muscle samples (in at least 5 out of 9 datasets). The graph is generated using the heatmap2 tool in Galaxy without clustering the gene expression pattern. The dark red colour represents the upregulated genes and the dark green represents the downregulated genes. c GO molecular function enrichment analysis graph generated from the CPDB database. The DEGs identified from the SysMyo database was used as the input gene list and the overrepresentation analysis feature was used with Fisher’s exact test.
Majority of the DEGs representation were identified from the SysMyo database, which incorporates markers reported in other muscle specific biomarker databases that were selected for the current study. GO molecular function analysis revealed that majority of these DEGs belong to genes encoding proteins involved in transcriptional regulation, phosphoprotein phosphatase activity, cytoskeletal proteins and chaperones (Fig. 5c, Supplementary Data 8). Analysis of this gene-set category, revealed the differential expression of genes involved in transcriptional regulation of muscle specific biological process prominent by the upregulated expression pattern of Myf6 (Myogenic factor 6) and Sox4 (SRY (sex determining region Y)-box 4) vital regulators of muscle differentiation39. The increased expression pattern of transcriptional coactivator Arid5b (AT rich interactive domain 5B (MRF1-like)), is noticeable as knockdown of this gene has been shown to cause metabolic changes in skeletal muscle preferring more anaerobic glucose metabolism in conjunction with increased fat oxidation for energy generation40. Correlated increase in expression pattern of Enho (energy homeostasis associated, Adropin) gene across muscle samples could appear as an adaptive mechanism to balance glucose metabolism in skeletal muscle41. Similarly, genes encoding cytoskeletal proteins such as Sync (Syncoilin), Tcap (Titin cap protein), Smtnl1 (Smoothelin-like protein 1); Mylk2 (Myosin light chain kinase 2, skeletal/cardiac muscle) and Atp2a1 (Sarcoplasmic/endoplasmic reticulum calcium ATPase 1) were identified to be differentially regulated which play crucial role in regulating muscle contraction and assembly. A noticeable observation is the upregulated expression pattern of Musk (Muscle-Specific Kinase) gene and the downregulated expression pattern of Dmpk (Dystrophia myotonica protein kinase) genes. The receptor tyrosine kinase Musk, in conjunction with the extracellular heparan sulfate proteoglycan Agrn (Agrin), is a key protein that plays a vital role in regulating neuromuscular junction development42. Moreover, the non-receptor serine/threonine protein kinase Dmpk, is also a pivotal kinase that regulate muscle differentiation and calcium homeostasis in skeletal muscle43 (Supplementary Data 8). On a similar note, the downregulated expression pattern of major transcriptional repressors and upregulated expression pattern of transcriptional activators forming core circadian clock component might indicate disruption in circadian expression of clock and clock-controlled genes which is known to regulate >2300 genes in skeletal muscle44. This is consistent with previous reports that studied similar model organisms45 and also pertinent to muscle atrophy phenotype as similar atypical expression pattern has been reported in denervated skeletal muscle46.
Glycogene analysis
A similar approach was adapted to analyse the expression pattern of glycogenes as well. Glycosylation pathways are ubiquitous and vital post-translational modifications involved in regulating the muscle structure and function. This is exemplified in congenital muscular dystrophies (CMD)47. Expression patterns were varied depending on the source of the mouse muscle samples subjected to microgravity conditions but some important trends are noted. Data from Sol muscle samples displayed the maximum number of glycogene DEGs (33%) followed by EDL (12%) and LD muscle samples (8%) respectively (Fig. 5; Supplementary Data 12). Representation of glycogenes DEGs specifically in Sol samples (n = 113) was higher when enriched with biological process involved in N-glycan biosynthesis and Glycosaminoglycan metabolism pathways (Supplementary Data 12). Additionally, the 30 DEGs observed in both EDL and Sol samples were largely represented by the proteoglycans involved in the extracellular matrix organization and N-linked glycosylation pathways (Fig. 6). Similarly, the 18 DEGs common between Sol and LD are enriched with N-glycan antennae elongation and Keratan sulfate biosynthesis processes (Fig. 6). Interestingly, the gene Gmppb (GDP-mannose pyrophosphorylase B), which encodes the key protein for the formation of the sugar donor GDP-mannose and also identified as one of the causal genes for CMD, and was differentially expressed across the three muscle samples (Supplementary Data 12).
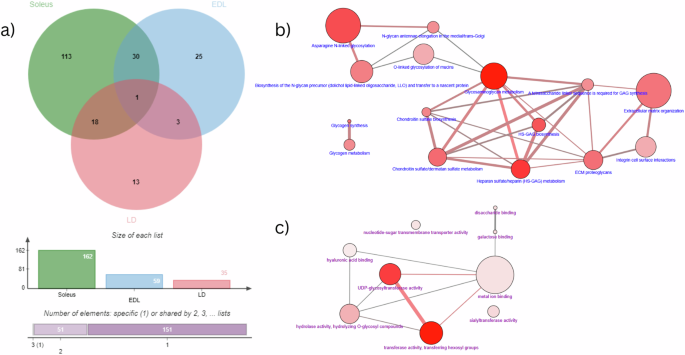
a Classic jVenn diagram displaying the shared and unshared glycogene DEGs between three different mice muscle samples. Numbers in bold represents the total number of DEGs belonging to individual muscle sample as well as the intersection between samples. The charts in the bottom of the diagram shows the list size among the three muscle samples. (EDL extensor digitorum longus, Soleus Soleus muscle, LD Longissimus dorsi muscle). All genes satisfies the stringent statistical significance cut off value (adj. p-value ≤ 0.05). The 69 glycogene DEGs identified from the three muscle samples were considered as the input genes for the over-representation analysis in the CPDB software. b Enrichment analysis results of the glycogene DEGs from the three muscle samples generated using the CPDB software with the Reactome database as the Biological process representation. c Enrichment analysis results of the glycogene DEGs from the three muscle samples generated using the CPDB software with the GO Molecular function level 4 as the Biological process representation.
Discussion
Space travel for longer-term habitation to the moon and beyond is becoming technologically feasible and potentially a reality in the coming decades. The research community is interpreting the growing pool of data generated over the last decade on the impact of space travel on biological systems. As technology improves and RNASeq and expression arrays become more uniform, data repositories like NASA’s GeneLab provide the resource to perform valid meta-analyses across multiple experiments. Extended exposure to microgravity during space flight induces irreversible or less reversible alterations, particularly concerning skeletal muscle mass and function, posing a significant concern for long-duration space missions48,49. This phenomenon, commonly referred to as spaceflight-induced muscle degeneration, presents a significant challenge for astronauts as it can impair their ability to carry out tasks essential for mission success and may lead to long-term health consequences. The inactivity and reduced mechanical stress on muscles in microgravity contribute to spaceflight-induced muscle atrophy, and researchers have extensively examined and reviewed underlying mechanisms. For more than a decade, researchers have been investigating muscle atrophy, both in rodent and human models, during spaceflight missions50. Recent advancements in this field have identified pivotal molecular pathways implicated in muscle atrophy. Alterations in biological pathways, such as oxidative stress, DNA damage, mitochondrial dysregulation, epigenetics, telomere length alterations, and microbiome shifts, have been recognized as underlying mechanisms directly associated with the health risks to astronauts in spaceflight3,29. Analysis of NASA’s GeneLab omics data source has revealed a multitude of metabolic pathways contributing to the phenomenon of muscle atrophy51. The study identified notable differential gene expression patterns in mouse muscle samples subjected to spaceflight conditions, revealing insights into molecular pathways underlying muscle atrophy and highlighting potential targets for intervention to mitigate the negative impacts of microgravity on skeletal muscle health during long-duration space missions.
Through the analysis of this data source using OMICS techniques, a multitude of metabolic pathways contributing to the phenomenon of muscle atrophy have been unveiled, building upon the findings of prior investigations52. A targeted knowledge driven approach was adopted in the current study coupled with biclustering method53 to study the expression pattern of genes encoding the glycosylation post-translational modification along with genes encoding muscle differentiation factors, cytoskeletal proteins, circadian regulators and proteins involved in neuromuscular junction development. Expression patterns of the latter correlate with the muscle atrophy phenotype previously reported in denervated skeletal muscle as well as age-related sarcopenia54. The large representation of DEGs from the Sol muscle samples might underscore the distinctive molecular responses within Sol muscles during spaceflight. This might also indicate the potential role of this muscle type as key contributors to the physiological adaptations associated with extended periods of extra-terrestrial exposure. However, more targeted experimental validation might provide robust insights into the understanding of this molecular dynamics in musculature, under microgravity conditions. For instance, our analysis revealed significant alterations in genes involved in metal ion homeostasis (e.g., Tfrc, Mt2), cell proliferation (e.g., Cdkn1a), and regulation of DNA-binding transcription factor activity (e.g., Arid5b). The increased expression pattern of transcriptional coactivator Arid5b is notable, as knockdown studies have shown its involvement in metabolic changes within skeletal muscle, favouring anaerobic glucose metabolism and increased fat oxidation for energy generation40. Furthermore, the correlated increase in the expression of energy homeostasis-associated gene Enho across muscle samples suggests its potential role in balancing glucose metabolism in skeletal muscle under microgravity conditions41. Notably, the differential expression of genes encoding key regulators of muscle differentiation (e.g., Myf6, Sox4). Myf6, one of the key determinant myogenic regulatory factor in regulating skeletal muscle differentiation is known to transcriptionally regulate a broad spectrum of myokines and the knock down in adult skeletal muscle caused myofibre hypertrophy and prevents denervation-induced atrophy55,56. Analysis of the transcriptional regulation of muscle gene-set category on muscle-specific biological processes revealed several key DEGs implicated in skeletal muscle adaptation to space biology. Notably, the upregulated expression patterns of Myf6 and Sox4, vital regulators of muscle differentiation39, highlight specific molecular mechanisms underlying skeletal muscle adaptation to microgravity. Myf6, one of the key determinant myogenic regulatory factors in regulating skeletal muscle differentiation is known to transcriptionally regulate a broad spectrum of myokines and the knockdown in adult skeletal muscle caused myofibre hypertrophy and prevents denervation-induced atrophy55,56. Previous rodent studies conducted under space flight and hindlimb unloading conditions have reported a substantial loss of contractile proteins and slow-to-fast transitions in contractile protein and regulatory proteins resulting in atrophy and loss of contractile function57. In this regard differential regulation of genes such as Sync,Tcap, Smtnl1, Mylk2 and Atp2a1 which encode proteins that are essential for maintaining muscle structure, regulating contractile activity, and ensuring calcium homeostasis within muscle cells might indicate alterations in the contractile function of skeletal muscle under microgravity conditions. Among them, the enhanced expression pattern of Sync is notable as it correlates with that previously reported in dystrophic muscles of α-dystrobrevin knockout rodent models. Sync, one of the key intermediatory filament-like proteins of the dystrophin protein complex plays a vital role in the mechanical stability of skeletal muscles. Additionally, in the current analysis, we identified altered expression patterns of genes involved in neuromuscular junction development and circadian rhythm regulation, suggesting potential adaptations of skeletal muscle to microgravity conditions. For instance, the upregulated expression of Musk and downregulated expression of Dmpk genes indicate potential alterations in neuromuscular junction function and muscle differentiation processes42,43. The receptor tyrosine kinase Musk, in conjunction with the extracellular heparan sulfate proteoglycan Agrn (Agrin), is a key protein that plays a vital role in regulating neuromuscular junction development42. Moreover, the non-receptor serine/threonine protein kinase Dmpk, is also a pivotal kinase that regulates muscle differentiation and calcium homeostasis in skeletal muscle43. Furthermore, the observed dysregulation of genes forming core components of the circadian clock suggests disruptions in circadian gene expression patterns within skeletal muscle under microgravity, which may contribute to muscle atrophy phenotypes44,45,46. The downregulated expression pattern of major transcriptional repressors and upregulated expression pattern of transcriptional activators forming the core circadian clock component might indicate disruption in the circadian expression of clock and clock-controlled genes which is known to regulate >2300 genes in skeletal muscle44. This is consistent with previous reports that studied similar model organisms45 and also pertinent to muscle atrophy phenotype as similar atypical expression patterns have been reported in denervated skeletal muscle46.
Interestingly, the EDL and Sol samples have more representation of the glycogene DEGs that were associated with the structure of the extracellular matrix and N-linked glycosylation pathways. Given this initial finding in our study, it warrants further investigation into the pivotal role of glycogenes in regulating neuromuscular junctions and their influence on muscle protein equilibrium and differentiation under microgravity conditions. The scientific foundation for this assumption is further supported by reports emphasizing the significance of these pathways in the context of CMD58. Furthermore, one of the most important observations from the bi-clustering analysis is the observed expression pattern of metallothioneins across mouse muscle samples subjected to microgravity conditions. The heightened expression of metallothioneins (Mt1 and Mt2) genes, which are key regulators of cellular zinc ion balance, warrants scrutiny due to their previous links to human muscle atrophy and potential positive effects on muscle size observed in rodent gene silencing studies32,33. It may be worthwhile to investigate the potential benefits of zinc supplementation in preserving muscle function and mass under microgravity conditions. This avenue holds promise for enhancing our understanding of muscle physiology in space and ultimately improving the well-being and performance of astronauts during extended missions.
The study presents a comprehensive analysis of transcriptomic changes in various mouse muscle samples under microgravity conditions, utilizing datasets from the NASA Rodent Research 1 protocol and the Gene Expression Omnibus. While the approach offers valuable insights into gene expression alterations, several limitations warrant consideration. Firstly, the study primarily relies on publicly available datasets, which may vary in quality, experimental design, and sample handling protocols, potentially introducing bias or confounding factors. Secondly, the use of low-stringency filters in the preliminary screening of differentially expressed genes (DEGs) may lead to the inclusion of noise or false positives, affecting the robustness of the findings. Moreover, the assumption of consistent gene expression patterns between different technology platforms (microarrays vs. RNA-Seq) and across muscle types may oversimplify the complexity of gene regulation mechanisms. Additionally, while clustering and biclustering analyses provide valuable insights into transcriptomic patterns, the interpretation of these results relies heavily on the choice of parameters and thresholds, which may influence the identification of biologically relevant clusters. Furthermore, the knowledge-based gene-set analysis, while informative, relies on existing databases and may overlook novel or context-specific gene expression signatures.
The insights gained from this study open may allow some direct interventions to address the most pressing issues, such as muscle degeneration, but future goals in the field of space physiology are being revealed through the effective use of meta-analysis. Zinc supplementation as a means to mitigate muscle atrophy is a low-risk/high reward intervention that can be implemented immediately with little to no cost/side effects. Deeper research into the specific roles of glycogenes in neuromuscular junction regulation and muscle protein balance offers a captivating area for investigation. Building upon our findings, future studies can delve deeper into these molecular pathways, with the aim of developing targeted interventions. Some interventions may be low risk but non-obvious; these are the greatest return on the original GeneLab investment. These endeavours hold the promise of not only advancing our knowledge of space-related muscle physiology but also contributing to the overall success and well-being of space travellers.
Methods
In the current study, for the transcriptomics analysis, gene expression data of mice muscle (Extensor digitorum longus (EDL), Quadriceps (Quad), Soleus (Sol), Tibialis anterior (TA), Longissimus dorsi (LD) and Gastrocnemius (Gastr muscle samples) were obtained from the NASA Rodent Research 1 (RR1) mission accessible on the NASA’s GeneLab public omics repository. A majority of the datasets from the NASA GeneLab database contained processed, normalized, log2 transformed gene expression matrix files which were used for the analysis. Several pre-processing steps were used to filter, enrich, sort or exclude data using low-stringency rules. For gene expression microarrays, the Affymetrix arrays were subject to the standard perfect match/mismatch analysis to exclude low-affinity binding, and the GC-RMA normalization which adjusts for the differential thermodynamics of mRNA fragments to the 25-mer probes. For RNA-Seq, pre-processing used standard bcl2fastq, FASTQ to BAM, and BAM to RNA counts, then counts to RNA expression using the Salmon TPM pipeline. RNA was then median normalized by column to ensure the median signal across different experiments was maintained. A preliminary screen of differentially expressed genes (DEGs) from this matrix was performed by using a very low stringency p-value filter of p ≤ 0.05. This enrichment simply excluded data with extremely large variability across factors, or data with virtually no change between ground and space flight samples, which was the primary factor of interest. We then evaluated various assumptions regarding the measurement of gene expression using RNA-Seq and expression microarrays and whether these technologies could reliably capture differences in gene expression between ground and flight conditions. To achieve this, we performed a comprehensive cross-laboratory meta-analysis of pre-existing datasets, meticulously evaluating the predictability of gene expression across various sources and laboratories. We made the following assumptions: first, we evaluated genes generally accepted as housekeepers59,60 to decide whether there is a systematic bias. One such evaluation involves a simple comparison of the ratio of the expression of a given housekeeping gene between ground and flight. A systematic bias between ground and flight that affects all genes would likely affect a housekeeping gene. Next, we assume the two relevant technologies, microarray and RNA-Seq, may differ in absolutely quantitation but will not have a systematic bias between ground and flight. We allow for the possibility that the technology might affect the rank-order of the expression of genes. Indeed, it is likely that variations exist in the definition of gene transcripts, the consolidation of alternative splicing transcripts, and the distribution of data between RNA-Seq and gene expression microarrays. Given this assumption, we propose that the ratio of gene expression between ground and flight will be in the same direction and within a statistically acceptable range (for example 2 standard deviations) between the two technologies. We then evaluated these assumptions using very simple mathematics prior to investigating more complex gene expression relationships. We used ratios between several canonically high and low-expression genes in single experiments to measure the gross difference in these genes from one to another. Since the exact values of each gene could differ from one experiment to the next, we asked whether genes that rarely changed expression, even under low-G conditions, had the same relative value vs. another housekeeping gene. Knowing that high-expressing and low-expressing genes were relatively stable across experiments allowed us to decide whether the variability inherent in an experiment was too large to allow us to rely on that data in our meta-analysis. Our interpretation of these investigations does incorporate the variability related to potential nuisance factors such as sequencers, technicians, reagents, array batches, scanners, or RNA quality scores. When we interpreted the results at a high level, we looked for recurring patterns that were common across platforms, such that the probability of a nuisance factor influencing the interpretation was minimized.
Clustering, gene enrichment analysis and network visualization
The jVenn interactive Venn diagram viewer was used for visualizing shared and unshared differential expressed genes (DEGs) across the muscle samples61. For generating the visualization layout, DEGs identified across the muscle samples were manually organized into six classes, representing the six muscle types, for which the gene expression was obtained.. Clustering analysis of the processed gene expression matrices was performed by using the open-source web application software, iDEP-v0.96 (http://bioinformatics.sdstate.edu/idep96/) and MoSBi (https://exbio.wzw.tum.de/mosbi/)62,63. The processed matrix containing genes considered statistically significant (adjusted p-values < 0.05) with the fold-change values was considered as the input file. The filtered matrix contained only those genes with expression values present in at least 2 out of 9 datasets. In IDEPv0.96, hierarchical clustering with heatmap was generated by selecting the Pearson Correlation and the Mcquitty’s linkage method. The Z-score cut-off value was selected as 2 and the ‘normalize genes’ and ‘normalize samples’ options were selected. In MoSBi platform, 10 algorithms (Fabia, isa2, QUBIC, Plaid, Bimax, Spectral, CC, Xmotifs, biclustpy and UNIBIC) were selected to perform the bicluster analysis after performing the row-wise z-score computation of the data matrix. Default Ensemble parameters were selected in the MoSBI platform for generating the molecular signatures and the bicluster network. Depending on the results, appropriate threshold values were used to extract the bicluster communities from the network for subsequent analysis. For knowledge driven gene-set enrichment analysis, a list of gene markers relevant to muscle atrophy were compiled by referring the published open-access data sources such as NeuroMuscleDB34,35 SysMyo36, Gene table of Neuromuscular Disease37, and the candidate gene list reported by Raza SHA et al. 38. Similarly, a reference gene-set markers for glycosylation PTM and muscle atrophy was derived by leveraging the GlycoGAIT database64 and the gene list published by Taillandier D et al. 65, respectively. Rodent homologs for the human gene counterparts were derived from the vertebrate homologs data provided by the Mouse Genome Informatics (MGI) database (http://www.informatics.jax.org/homology.shtml, accessed on 15 January 2022)66. Detailed functional enrichment analysis of the DEGs, identified from the bi-clustering analysis, were conducted using the PANTHER (Protein Analysis Through Evolutionary Relationship) website (http://pantherdb.org)67(accessed on 15 January 2023), g:Profiler68 (https://biit.cs.ut.ee/gprofiler/ (accessed on 15 January 2023), and ConsensusPathDB-human (CPDB—http://cpdb.molgen.mpg.de/ (accessed on 15 January 2023)69 open-source web application. In PANTHER database, Mus musculus was selected as the reference organism. “Statistical over-representation test” was selected for the analysis in PANTHER database using the unique gene list identified from each community extracted from the bicluster molecular signature network analysis. The complete GO biological process was selected for the annotation dataset. Fisher’s Exact and a Bonferroni correction for multiple testing were selected for the overrepresentation analysis. Similarly, the gene symbol of the DEGs were used as the query in the g:GOST functional profiling interface in g:Profiler using Mus musculus as the organism species, g:SCS threshold as the significance threshold and the user-defined p-value threshold as 0.05 in the advanced options. In the CPDB database, the “over-representation analysis” feature was used for the enrichment analysis using the HGNC gene symbol as the gene identifier. To facilitate the biological interpretation as well as to visualize the functionally grouped Gene Ontology pathway term networks and associated markers, plugins ClueGo and CluePedia were utilized70,71 within Cytoscape v.3.9 (http://www.cytoscape.org/)72.

Responses