Prognostic, biological, and structural implications of FLT3-JMD point mutations in acute myeloid leukemia: an analysis of Alliance studies
Introduction
Acute myeloid leukemia (AML) is a highly aggressive cancer of the blood and bone marrow that is difficult to treat. The diverse genetic mutations that define its molecular landscape have posed significant challenges for researchers and clinicians. Among the different mutations found in AML, those in the FMS-like tyrosine kinase 3 (FLT3) gene have received considerable attention. The FLT3 gene encodes a transmembrane receptor normally expressed by hematopoietic stem or progenitor cells which, when mutated, has been implicated in AML pathogenesis [1, 2]. The FLT3 receptor is a monomer composed of an extracellular domain (ECD), a transmembrane domain (TMD), a juxtamembrane domain (JMD), and two tyrosine kinase domains (TKD1 and TKD2) separated by a short kinase insert domain (KID) [3]. Receptor activation is triggered by FLT3 ligand binding which causes receptor dimerization and phosphorylation of the intracellular kinase [3, 4]. Mutations in FLT3 are found in approximately 30% of newly diagnosed patients with AML and primarily occur as either internal tandem duplication (ITD) (~25%) or point mutations in the TKDs (7–10%) [5, 6]. The two main types of FLT3 alterations have been extensively studied for their roles in leukemogenesis. ITD involves internal duplications within the juxtamembrane region of FLT3, leading to constitutive activation of the receptor, aggressively expansive disease, and poor patient prognosis [7]. On the other hand, TKD mutations entail point mutations within the tyrosine kinase domain, leading to ligand-independent activation [8]. Additionally, Tamburini et al. have recently described extremely rare very short insertions as another biologically relevant alteration in FLT3 [9].
Distinct from the more widely studied ITD and TKD mutations, prior reports indicated the presence of mutations within the JMD region representing new FLT3 alterations in AML [10,11,12,13,14,15,16,17]. For example, new missense point mutations were identified in exon 14 of FLT3, two of which were single nucleotide substitutions in codons 579 and 592, which changed the amino acid valine to alanine (V579A and V592A) [11, 12]. In addition, novel S574G and E598G mutations were identified in three cases of HLA-DR-negative M1/M2 AML patients [14]. The JMD of FLT3 has an auto-inhibitory role in preventing FLT3 receptor dimerization, and disruption of this key region whether by an ITD or a point mutation is expected to result in FLT3 receptor constitutive activation. In preclinical studies, the JMD point mutations V579A, V592A, and F594L were defined as activating mutations when expressed in Ba/F3 cells and shown to be sensitive to the FLT3 inhibitor midostaurin (PKC412) [15]. In addition, Y572C and V592G mutations induced constitutive phosphorylation of FLT3 and conferred high sensitivity to PKC412 [16]. Although non-ITD mutations within the FLT3 JMD region are less common than ITD mutations, they are being described as recurrent alterations that may have significant prognostic implications. Recent research identified FLT3/Q575Δ, Y572Δ, E573Δ, and S574Δ mutations in patients with AML through next-generation sequencing (NGS). These mutations were found to be activating and targetable deletions located in the FLT3 JMD region [17]. Additionally, Stasik et al. [11] recently studied a cohort of adults with AML treated on various protocols to assess the prognostic impact of non-ITD mutations (point mutations and deletions) in FLT3 JMD and TKD1. Among these patients, 1.23% had non-ITD mutations that did not emerge as an independent prognostic factor in multivariable analysis [11].
Given the infrequent occurrence of FLT3-JMD mutations, the current understanding is largely based on case reports, which provide limited insights into their molecular and clinical implications. In this study, we aimed to comprehensively characterize the molecular landscape and prognostic significance of FLT3-JMD mutations in AML from a large cohort of patients. We further explored biological consequences, potential for therapeutic targeting, and structural implications of FLT3-JMD point mutations, shedding light on a lesser-known yet increasingly important subset of FLT3 mutations.
Methods
Patient next-generation sequencing and outcome analysis
All patients investigated (n = 1660) had newly diagnosed de novo AML treated similarly on frontline Cancer and Leukemia Group B (CALGB) protocols (for details see the Supplementary Information) [18,19,20,21,22,23,24,25]. CALGB is now part of Alliance for Clinical Trials in Oncology (Alliance). All patients provided written informed consent to participate in treatment studies and for the research use of their specimens before enrollment in agreement with the Declaration of Helsinki. Study protocols were approved by the Institutional Review Board at each center.
All patients underwent high-throughput sequencing analysis of 80 AML-associated genes [26], including FLT3 JMD and TKD regions, enabling FLT3-JMD variant curation. NGS data previously generated was re-analyzed using an updated pipeline. Sequenced reads were aligned to the GRCh38 genome build using the Burrows-Wheeler Aligner (BWA). GATK’s MuTect2 was used in mitochondria mode to perform variant calling. After variant calling, variants were annotated using SnpEff and vcfanno along with the dbsnp, COSMIC, and gnomAD v3 variant databases. The Mucor3 algorithm was used for integrative mutation assessment [27]. All called variants within the region of interest underwent visual inspection using the Integrative Genomics Viewer (Broad Institute, Cambridge, MA, USA). A variant allele frequency (VAF) cutoff of ≥5% was chosen for inclusion in the outcome analyses using our depth of sequencing coverage as a guide [28].
Statistical analysis
Clinical characteristics by FLT3 mutation in de novo AML patients were compared using the Fisher’s exact test for categorical variables and Kruskal-Wallis test for continuous variables. Continuous variables were summarized using the median and range. Outcome analyses were performed on patients aged <60 years. Estimated probabilities of disease-free (DFS) and overall survival (OS) were calculated using the Kaplan-Meier method, and the log-rank test evaluated differences between survival distributions. Data collection and statistical analyses were conducted by the Alliance Statistics and Data Management Center. Alliance data was locked on October 4, 2022. Analyses were performed using SAS 9.4 and R version 4.3.
Reagents and cell lines
Murine Ba/F3 cells were obtained from DSMZ (Braunschweig, Germany) and maintained as previously described [29] in RPMI 1640 + L-Glutamine (Gibco, Thermo Fisher Scientific, Waltham, MA, USA) supplemented with 10% fetal bovine serum (FBS) (Gibco, Thermo Fisher Scientific) and 10 ng/mL IL-3 (PeproTech). Lentiviral supernatants were produced using Lenti-X 293 T cells (Takara) and were maintained in DMEM (Gibco, Thermo Fisher Scientific) supplemented with 10% FBS. FLT3 (clone 8F2), pFLT3 (clone 30D4), STAT5 (clone D206Y), p-STAT5 (clone D47E7), GAPDH (clone D16H11) and HRP-conjugated secondary anti-rabbit (clone NA) antibodies were purchased from Cell Signaling Technology. Drugs were obtained from the following sources: gilteritinib (ChemieTek), crenolanib (AROG Pharmaceuticals LLC), midostaurin (LC Laboratories), quizartinib (ChemieTek), sorafenib (LC Laboratories). DMSO (Fisher Bioreagent) was used as a vehicle.
Ex vivo drug testing
Viably frozen tumor samples were obtained from the Ohio State University Comprehensive Cancer Center (OSUCCC) Leukemia Tissue Bank Shared Resource. Samples were thawed and plated at a density of 100,000 cells per well of a 96-well plate in Gibco RPMI (Thermo Fisher Scientific) supplemented with 10% FBS and 10 ng/mL of the following recombinant human cytokines: SCF, IL-3, GM-CSF, and FLT3 Ligand (Peprotech). Cells were then treated with various FLT3 inhibitors (gilteritinib, midostaurin, sorafenib, crenolinib) in triplicate at concentrations ranging from 0.01 to 20 uM. Plates were then incubated at 37 °C in 5% CO2 for 72 hr at which point CellTiter-Glo Luminescent Cell Viability Assay (Promega) was performed according to the manufacturer’s instructions. Dose-response curves were plotted and IC50s calculated using GraphPad PRISM 9 (Dotmatics).
Single cell nested amplification sanger sequencing (scNASS)
Viably frozen tumor samples were thawed and stained with Live Dead green stain (Thermo Fisher Scientific L23105) and CD45-Amcyan (clone 2D1). Single live BLASTS were sorted into the wells of a PCR plate containing 3uL of DirectPCR Lysis-Reagent for cells (peQlab 31-301-C) with 0.2 mg/mL Proteinase K (Qiagen). To amplify FLT3 exons 13-15 PCR was performed with outer primers, left: (CCTGATTGTCTGTGGGGAGT) right:(GTTGACACCCCAATCCACTC), using Q5 High-Fidelity 2X Mater Mix (NEB) in the same plate as cell lysis. Nested PCR was performed using 2uL of PCR product from the outer PCR as template, primers left:(AGGAATTCTGTTTCATCGCTGA) right:(TCTTTGTTGCTGTCCTTCCAC) and the same PCR master mix as above. Product size of 594 bp was confirmed by 1% agarose gel. ExoSAP-IT PCR Product Cleanup Reagent (Thermo Fisher Scientific) was used according to the manufacturer’s instructions. Clean PCR product was Sanger sequenced in the OSUCCC Genomics Shared Resource on an Applied Biosystems 3730xl using both the left and the right the nested primers. Sequences were aligned to reference (NCBI: NG_007066.1) using Sequencher 5.4.6 (Gene Codes Corporation).
In vitro mutagenesis
The FLT3-JMD point mutations (V572A, V579A, V592A), FLT3-ITD, FLT3-TKD point mutation (D835Y), and a double mutation of FLT3-ITD and V592A were introduced into the FLT3-WT construct (pCDH-MCS-T2A-copGFP-MSCV-FLT3) using the QuikChange Site-Directed Mutagenesis Kit (Agilent) according to the manufacturer’s instructions. Mutagenesis primers were designed using the QuikChange Primer Design program. Mutations were sequenced confirmed using primers TK1F (TGCTGTGCATACAATTCCCTTGGC) and TK1R (AGTCCTCCTCTTCTTCCAGCCTTT). Alignments to the FLT3-WT sequence were performed using Sequencher 5.4.6.
Stable expression of mutations in Ba/F3 cells
Lentiviral production performed as previously described in Lenti-X 293 T cells [30]. Briefly, 3×10⁶ cells/mL were seeded into 10 cm plates one day before transfection. Transfections were then carried out using the different pCDH-MCS-T2A-copGFP-MSCV-FLT3 constructs, pPACKH1-XL Lentiviral Packaging Kit (System Bioscience, Mountain View, CA, USA) and Lipofectamine 3000 Transfection Reagent (Thermo Fisher Scientific, Waltham, MA, USA) according to the manufacturer’s instructions. After 18 h, the medium was replaced, and cells were cultured for 48 h. Lentivirus particles were then collected, concentrated, and used to transduce Ba/F3 cells. Transduced cells were centrifuged, GFP-positive cells were selected after 48 h by FACS analysis.
Cell proliferation and cell viability of Ba/F3 cells
Cells were seeded at 0.5 × 10⁵ cells/ml with or without IL-3 and grown for 7 days. At each time point, 500 µL samples were diluted and counted on a Coulter Z1-D Particle Cell Counter Size Analyzer (Beckman Coulter). Growth curves show mean values and standard deviations of triplicate aliquots, and representative curves from at least two experiments are shown. Cell viability upon drug treatment was assessed using the Thiazolyl Blue Tetrazolium Bromide, MTT reagent (Sigma-Aldrich) as previously described [31]. Cells were plated and treated with DMSO or with drugs in increasing concentrations and incubated for 72 h. Viability was measured relative to DMSO-treated cells, and curves were generated in GraphPad PRISM 9 (Dotmatics).
Western blot analysis
For FLT3 blots, cells were serum-starved (RPMI + 0.5%FBS) for 24 h, then cells were collected for lysis. For drug treatments, cells were treated for 4 h with drugs at varying concentrations and then collected for lysis. All cells were lysed in Cell Lysis Buffer (Cell Signaling Technology) containing protease and phosphatase. Protein concentration was determined by BCA (Pierce); equal protein concentrations were run on NuPage Bis-Tri 4–12% gels (Thermo Fisher Scientific) using MOPS buffer (Thermo Fisher Scientific). Transfer was carried out to PVDF using NuPage Transfer buffer (Thermo Fisher Scientific) and according to manufacturer’s recommendations. Western analysis was carried out using the antibodies indicated above and developed with either Signal Fire ECL reagent (Celling Signaling Technology) or Super Signal West Femto Maximum Sensitivity Substrate (Thermo Fisher Scientific) using film. Western blots were repeated in 2–3 biological replicate experiments.
In silico structural analysis
The crystal structures of FLT3 in Apo-state (PDB ID: 1RJB) [32] and in complex with gilteritinib (PDB ID: 6JQR) [33] state were retrieved from RCSB Protein Databank. CHARMM-GUI v3.7 was used for processing the structures and point mutations were introduced in these structures using the PDB manipulator tool [34,35,36,37,38,39]. The native and mutated structures were solvated in a 15 Å rectangular box and neutralized with 0.15 M K+ and Cl– ions using a Monte-Carlo method. Each structure was restrained with 250.0 kcal/mol/Ų on residues 1–330, including the ligand C6F in 6JQR, and underwent gradient equilibration. After equilibration in the NVT ensemble, a 500 ns production run was performed in the NPT ensemble at 303.15 K and 1 atm. Simulations were conducted with AMBER 16, and the cpptraj program was used to analyze the distance between alpha carbon atoms of the residues of interest [40]. Clustering analysis of simulated trajectories was performed using cpptraj, and centroid frames were visualized and extracted with VMD Molecular Graphics Viewer [41]. Ensemble docking was performed using Schrodinger Maestro [42] for gilteritinib against an ensemble of centroid frames obtained from the MD simulations. Residue network maps (RINs) were generated using RING 3.0 based on dynamic protein structures, with default thresholds for interactions including 3.5 Å for hydrogen bonds, 4 Å for ionic bonds, and other relevant distances for various interactions [43]. Allosteric pathways between the mutated residues and the drug binding site were identified through Ohm with distance cut-off of contacts at 3.4 Å and 10,000 rounds of perturbation propagation [44].
Results
Prevalence and spectrum of FLT3-JMD mutations and their prognostic relevance
Among all patients investigated (n = 1660), we identified a total of 37 point mutations and deletions (VAF, 2–58%) within the FLT3-JMD in 34 patients, with a prevalence of 2% (Fig. 1A). The most common were amino acid exchanges at residue V592 (A/D/F/I/fs; n = 11). JMD alterations frequently co-occurred with FLT3-ITD and TKD mutations: of 34 patients, eight (23.5%) also had ITD and four (11.8%) had TKD. NPM1, TET2, and RUNX1 were the most frequently co-mutated genes (Fig. 1B). Single-cell analysis of tumor samples investigating the distribution of FLT3-JMD point mutations and their coexistence with FLT3-ITD in leukemic clones showed that FLT3-JMD point mutations are present mostly in clonal populations distinct from those harboring ITD mutations (Fig. 1C). However, there was an exception in sample C97-0386, where FLT3-JMD point mutations coexisted with FLT3-ITD mutations within the same clone, challenging their exclusivity. The baseline clinical characteristics by FLT3 mutation of patients under the age of 60 years are listed in Supplementary Table 1.

A Frequencies of molecular alterations detected in the FLT3-JMD region of AML patients in the Alliance dataset. lg-like, ligand binding domain; TMD, transmembrane domain; JMD, juxtamembrane domain; TKD1, tyrosine kinase domain-1; KID, kinase insert domain; TKD2, tyrosine kinase domain-2. B Associated co-mutations in FLT3-JMD mutated patients. C Single-cell analysis of the FLT3-ITD/JMD locus of tumor samples showing the frequency of various clones within FLT3 mutated primary patient samples. D Kaplan–Meier plot showing overall survival of patients <60 years old with different FLT3 mutations.
Concerning treatment outcomes of patients with FLT3-JMD aged <60 years and with VAF ≥ 5%, although the complete remission (CR) rates of patients with FLT3-JMD and those with FLT3-TKD were similar (85% vs 80%, P = 1.00), the relapse rate (RR) of patients with FLT3-JMD was higher (82% vs 40%, P = 0.01), and their disease-free survival (DFS) (median, 1.1 vs 5.1 years, P = 0.01) and overall survival (OS) (by trend; median, 1.6 vs 4.5 years, P = 0.14) were shorter than those of patients with FLT3-TKD. The latter did significantly better than patients harboring FLT3-ITD: FLT3-TKD-positive patients had a higher CR rate (80% vs 66%, P = 0.01), lower RR (40% vs 72%, P < 0.001), and longer DFS (median, 5.1 vs 0.7 years, P < 0.001) and OS (median 4.5 vs 1.1 years, P < 0.001) than those with FLT3-ITD. In contrast, outcomes of the FLT3-JMD and FLT3-ITD patients were not significantly different, with patients harboring FLT3-JMD having similar CR rates (85% vs 66%, P = 0.23), RR (82% vs 72%, P = 0.73), DFS (median, 1.1 vs 0.7 years, P = 0.75) and OS (median, 1.6 vs 1.1 years, P = 0.37) to those of patients with FLT3-ITD (Fig. 1D).
Transforming potential of FLT3-JMD mutations
To complement the clinical observations, we explored the biologic consequences associated with FLT3-JMD point mutations. Central to this investigation was the assessment of the transforming potential of the most common FLT3-JMD mutations (Y572C, V579A, and V592 A). Our results confirmed the transformative potential of point mutations within the FLT3-JMD. Ba/F3 cells engineered to express Y572 C, V579A, V592A, and double mutant ITD-V592A mutations within the FLT3-JMD exhibited the ability to sustain growth in the absence of IL-3, closely resembling the behavior observed with FLT3-ITD mutations, although with a slightly slower growth rate (Fig. 2A).
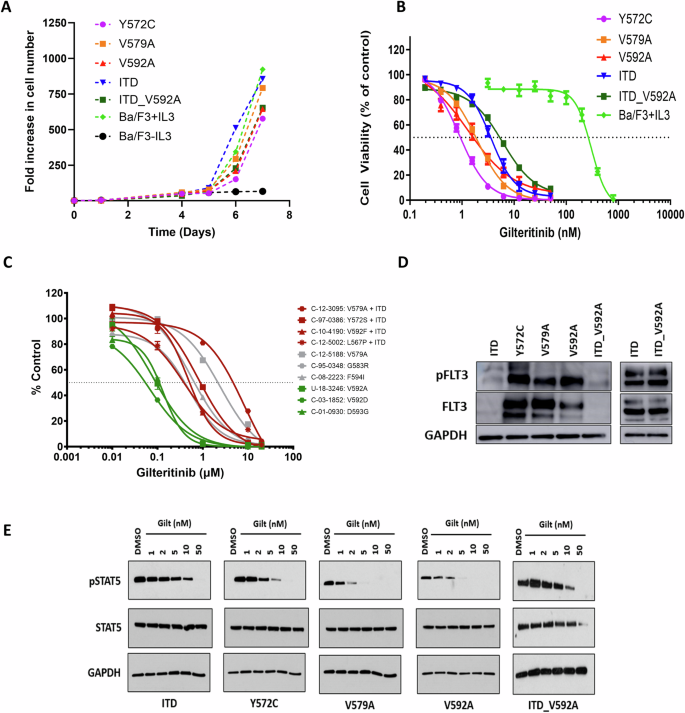
A Growth Curves of Ba/F3 cells expressing FLT3 Y572C, V579A, V592A, ITD-V592A or ITD in addition to the parental cell line in the presence or absence of IL3 for 7 days. B Effect of gilteritinib on cell viability of Ba/F3 cells expressing FLT3 Y572C, V579A, V592A, ITD-V592A or ITD in addition to parental cell line (MTT assay, 72 h, n = 18). C Response of primary samples with FLT3-JMD point mutations to gilteritinib treatment (CellTiter-Glo Luminescent Cell Viability Assay, 72 h). D Western blot analysis of phosphorylated FLT3 in BaF3 cells expressing FLT3 Y572C, V579A, V592A, ITD-V592A or ITD. E Western blot analysis of cell signaling in BaF3 cells expressing FLT3 Y572C, V579A, V592A, ITD-V592A or ITD with or without gilteritinib (Gilt) treatment.
Sensitivity of FLT3-JMD mutations to FLT3 inhibitors
To comprehensively assess the sensitivity of FLT3-JMD point mutations to a spectrum of FLT3 inhibitors, we conducted cell survival assays in cell lines and primary samples harboring FLT3-JMD point mutations. These assays revealed that FLT3-JMD point mutations were amenable to targeting by existing FLT3 inhibitors. Notably, in a comparative analysis with FLT3-ITD mutations, the Y572C, V579A, and V592A mutations within the FLT3-JMD exhibited enhanced sensitivity to gilteritinib (Fig. 2B). Furthermore, when we extended our analysis to primary samples, a consistent pattern emerged, highlighting the increased sensitivity of cells with FLT3-JMD point mutations, such as V592A, V592D, and D593G, to gilteritinib in comparison to cells with FLT3-ITD (Fig. 2C). This sensitivity was not confined to gilteritinib alone, as JMD mutations also displayed notable responsiveness to other available FLT3 inhibitors (Supplementary Table 2). Of note, the type II inhibitors quizartinib and sorafenib emerged as effective agents against FLT3-JMD mutations, in contrast to FLT3-TKD mutations, which were less responsive to these compounds [29].
Cell signaling dynamics of FLT3-JMD mutations
Western blot analysis of cell signaling in Ba/F3 cells revealed insights into the impact of various FLT3 mutations on receptor activation and intracellular signaling pathways. We observed robust FLT3 phosphorylation of the Y572C, V579A, and V592A mutants relative to ITD, emphasizing the role of these genetic alterations in FLT3 receptor activation (Fig. 2D). Moreover, cell lines expressing FLT3-JMD point mutations exhibited differential patterns of activated phospho-STAT5 (Fig. 2E), and gilteritinib treatment of these cell lines resulted in inhibition of phospho-STAT5 signaling at lower doses compared to those with FLT3-ITD.
Domain motions and structural mechanisms in mutant FLT3 kinases
To assess the impact of FLT3-JMD point mutations on domain motions, we conducted measurements of the distances between the centers of mass (COMs) of alpha carbon atoms in the catalytic lobes domains (C-lobe and N-lobe). In comparison to the wild-type structure, the mutants exhibited less movement, appearing constrained in a more open state (Fig. 3A). The mean domain distances for each were as follows: wild-type (38.9 ± 5.6 Å), Y572C (44.2 ± 4.0 Å), V579A (44.4 ± 3.9 Å), and V592A (41.2 ± 5.4 Å). Furthermore, we observed a small aperture on the surface of the FLT3 kinase structure, which appeared to function as a gate for drug entry into the binding pocket. Distance analysis revealed that mutants had greater separation between the gate residues compared to wild-type FLT3 (Fig. 3B). The mean gate opening distances were as follows: wild type (10.9 ± 0.4 Å), Y572C (11.6 ± 0.3 Å), V579A (11.5 ± 0.3 Å), and V592A (11.2 ± 0.4 Å). This wider opening implied a higher likelihood of drug binding, potentially increasing the sensitivity of the mutants. To understand how the mutations influenced domain motions, we constructed residue interaction network maps for the wild-type and mutant FLT3 kinases (Fig. 4). In mutants, interactions were more confined to neighboring residues, indicating restricted hinge function, and altering the domain motions. Secondary structural changes in the vicinity of the mutated residues also contributed to the altered domain motions in the mutants.
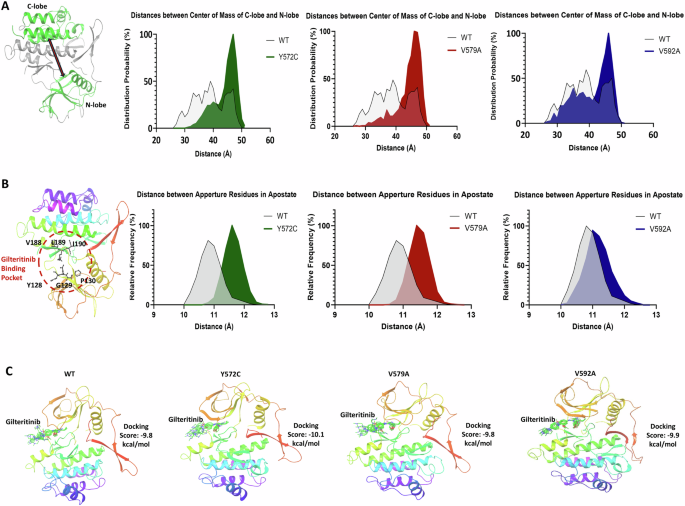
A Structure of FLT3 with the C-lobe and N-lobe domains shown in green; probabilities of domain distance distributions for the three mutants in comparison to the wild-type FLT3. B Schematic showing a gate controlling the drug binding site accessibility; probabilities of gate opening distance distributions for the three mutants in comparison to the wild-type FLT3. C Top binding poses of gilteritinib showing a similar binding pose in the three mutants as compared to the wild-type.

A Altered secondary structures surrounding the mutated residues in the three mutants as compared to the wild-type FLT3. B Residue interaction network maps for the three mutants as compared to the wild-type FLT3.
Impact on gilteritinib dissociation rate and allosteric mechanisms
To investigate the effect of mutations on gilteritinib drug binding and dissociation rate, we performed ensemble docking using centroid states from molecular dynamics (MD) simulations. The docking studies revealed identical binding poses and comparable minimum docking scores: −9.8 kcal/mol for wild-type, −10.1 kcal/mol for Y572C, −9.8 kcal/mol for V579A, and −9.9 kcal/mol for V592A (Fig. 3C, Supplementary Fig. 1A). Additionally, root mean square fluctuation (RMSF) profiles of key binding site residues during MD simulations demonstrated minimal deviation from the wild-type structure, corroborating that the mutations did not affect drug dissociation rate (Supplementary Fig. 1B). To understand the mutation’s impact on the drug binding site, we explored allosteric mechanisms. We found that mutants had more allosteric paths and involved other residues than wild-type FLT3, suggesting that restricted interactions in mutants required longer transmission channels, while wild-type residues could use shorter, direct pathways. (Supplementary Fig. 1C).
Discussion
In this study, we analyzed a cohort of patients with AML to provide insights into the prevalence, spectrum, clinical implications, and biological consequences of FLT3-JMD mutations in AML. The analysis revealed a prevalence of JMD mutations of 2% in the studied cohort, which is a frequency in the range of previous estimates [15, 16]. Notably, amino acid exchanges at residue V592 were the most common mutations, with other various substitutions also observed. The diversity in V592 mutations suggests the structural and functional significance of this residue in FLT3, which have been described previously in patients with AML [14, 15]. FLT3-JMD alterations often co-occurred with other FLT3 mutations, such as FLT3-ITD and FLT3-TKD, and predominantly manifested in separate clonal populations. This co-occurrence suggests potential synergistic or additive effects of these mutations in leukemogenesis, and the fact that these mutations primarily exist in different clonal lineages may indicate a notable divergence in their genetic origins and developmental paths, or alternatively a convergence due to shared environmental selection [45]. Moreover, the frequent co-mutations in such genes as NPM1, TET2, and RUNX1 highlight the complex genetic landscape of AML and the interconnectedness of various genetic events. Our study also revealed distinct patient outcomes based on FLT3 mutation status, where patients younger than 60 years with FLT3-JMD mutations had a poorer prognosis, with a higher relapse rate and shorter DFS and OS (by trend) than those with FLT3-TKD mutations. Notably, outcomes of patients with FLT3-JMD were similar to those with FLT3-ITD, with comparable CR and relapse rates, DFS and OS. This suggests that treatment strategies effective for patients with FLT3-ITD may also be applicable to those with FLT3-JMD.
Our exploration of the biological implications of FLT3-JMD point mutations has provided valuable insights into their transforming potential and responsiveness to FLT3 inhibitors. We found that these mutations are indeed activating mutations in Ba/F3 cells, but not to the same extent as FLT3-ITD mutations. The relatively weaker transforming potential observed with FLT3-JMD point mutations may be attributed to the fact that, in contrast to FLT3-ITDs, point mutations induce subtle changes in the protein structure of the autoinhibitory JMD. Furthermore, our study explored the sensitivity of FLT3-JMD mutations to a spectrum of FLT3 inhibitors. Cell survival assays in both cell lines and primary samples revealed that these point mutations within FLT3-JMD are amenable to targeting by existing FLT3 inhibitors. When compared to FLT3-ITD mutations, the candidate mutations displayed enhanced sensitivity to gilteritinib. Importantly, this heightened sensitivity extended beyond gilteritinib and encompassed other available FLT3 inhibitors. Notably, quizartinib and sorafenib emerged as effective agents against FLT3-JMD mutations, setting them apart from FLT3-TKD mutations, which show less responsiveness to type II FLT3 inhibitors [46]. This is important clinically as it confirms a broader set of tools to treat patients with these rare abnormalities. Our exploration of cell signaling dynamics in Ba/F3 cells expressing FLT3-JMD mutations also provided additional insights into the impact of these genetic alterations on intracellular signaling pathways. These mutations triggered distinctive signaling patterns, with phosphorylation of FLT3 and activation of STAT5, which is the most important downstream target of FLT3 and is strongly associated with leukemogenesis [47, 48]. Furthermore, we demonstrated that gilteritinib effectively reduced autoactivated pSTAT5 levels, confirming its ability to block FLT3’s signaling pathways. FLT3-JMD point mutations also showed significantly higher sensitivity to gilteritinib compared to FLT3-ITDs, suggesting that patients with these mutations may respond well to gilteritinib treatment.
The kinase domain of FLT3 consists of a smaller N-terminal lobe and a larger C-terminal lobe and these domain movements are essential for kinase activation and autophosphorylation [32]. Our molecular dynamics simulations revealed that FLT3-JMD mutations have constrained domain motions, effectively adopting a more open state compared to the wild-type structure. This is likely due to the disruption of key interactions between the two domains. The wider gate opening observed in the mutants may also contribute to the constrained domain motions. Additionally, the residue interaction network maps revealed that interactions in the mutants are more confined to neighboring residues, indicating restricted hinge function. This further supports the notion that FLT3-JMD mutations alter the domain motions of the FLT3 kinase.
While our study sheds light on the significance of FLT3-JMD mutations in AML, there are limitations. The small sample size reflects the rarity of these mutations, requiring larger cohorts for validation and exploration of subgroups. The lack of long-term follow-up data limits our ability to assess patient outcomes with FLT3-JMD mutations treated with FLT3 kinase inhibitors. Additionally, therapeutic responses were mainly analyzed in vitro, so clinical trials and real-world data are needed to evaluate the effectiveness of these treatments.
Responses